Orion Multi-Trader is a high-performance, multi-asset, broker-neutral platform for sophisticated investors. A powerful analysis and trading tools that enables you to design, execute and manage automated order strategies with ease.
Easy order management directly from Charts, Price Ladder or Quotes
Technical indicators with Orion MT’s advanced charts
Design, execute and manage automated order strategies with ease
Simulated trading environment
…..
RJO Echo Trading!
Attention New or Frustrated Traders:
Do you want to get into futures trading, but don’t have the time or knowledge necessary to do so? If yes, then RJO Echo Trading is for you. RJO Echo Trading is a new intuitive way for investors or “echo followers” to automatically match the performance of veteran and accomplished traders. As an “Echo Follower” you will choose from a selection of proven, vetted, and experienced “Echo Leaders”, all you have to do is a pay a subscription fee and your account will mimic the trades of your chosen “Leader”. RJO Echo Trading eliminates the learning curve needed to trade futures, making it an option for all.
The Markets
Metals - Bulls Seem to Be Leading Silver
Bulls Seem to Be Leading Silver
By: Eli Tesfaye, Senior Market StrategistPosted Dec 20, 2019 10:14AM CT
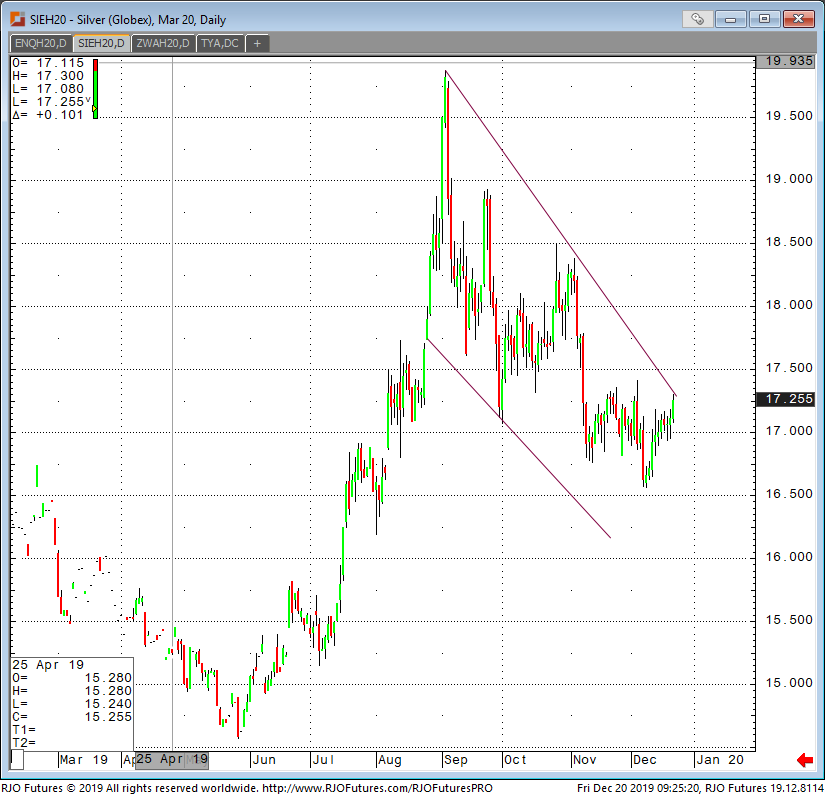
March silver is trading 17.25 up about 10 cents on the day. This morning, the bulls seem to be in charge as the technical landscape is continuing to be supportive of silver. A break above $17.50 is needed to give the bulls the confirmation that near terms lows are potentially in. The global outlook for silver continues to be supportive. I have been watching the copper market closely and will comment on that soon, but in general, industrial demand for metals as the economy continues to rip and roar will be strong. Silver is generally friendly to the stock market. Other factors to consider are the Chinese domestic problem that could potentially could ad additional support. Overall the trend is up; a close below $16.50 will probably trigger a sell-off. I could see silver trading range-bound between $15-20 for a little bit proving a range-bound trading strategy using options.
If you have any questions or would like to discuss the markets further, please feel free to contact me at 800-367-7290 or etesfaye@rjofutures.com. Energy - Oil Heading for Third Straight Weekly Gain
Oil Heading for Third Straight Weekly Gain
By: Alexander Turro, Senior Market StrategistPosted Dec 20, 2019 9:15AM CT
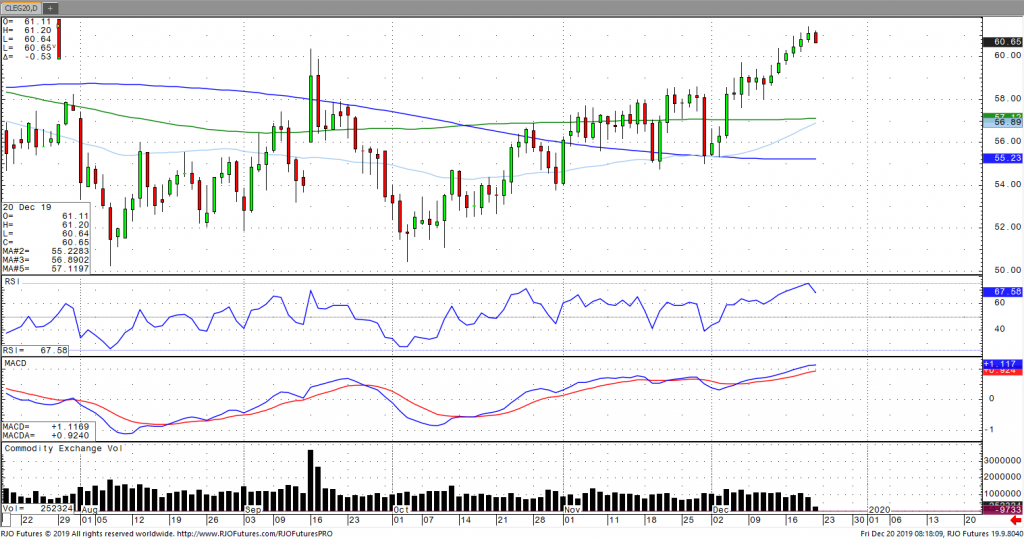
Oil is under pressure in the early session following a continual daily grind higher and is on pace for third straight week of gains despite a surprise decline in U.S. crude stockpiles on Wednesday. Sentiment has largely settled with oil trading near three-month highs amid improving demand expectations following the completion of a ‘phase one deal’ between the U.S. and China. This comes as a U.S. probe has reported that the attack on the Saudi oil facilities in September came from the north, reinforcing earlier assumptions that Iran was behind the attack, which only serve to heighten geopolitical risk. Prices have also gained momentum from OPEC and other major producers agreeing to further output production cuts. This has come despite the waning open interest and thin volume around the holiday season. The market remains bullish trend but signaling immediate term overbought with today’s range seen between 58.50 – 61.66.
If you have any questions or would like to discuss the markets further, please feel free to contact me at 800-438-4805 or aturro@rjofutures.com. Softs - An Opportunity in Coffee
An Opportunity in Coffee
By: Eric ScolesPosted 12/18/2019
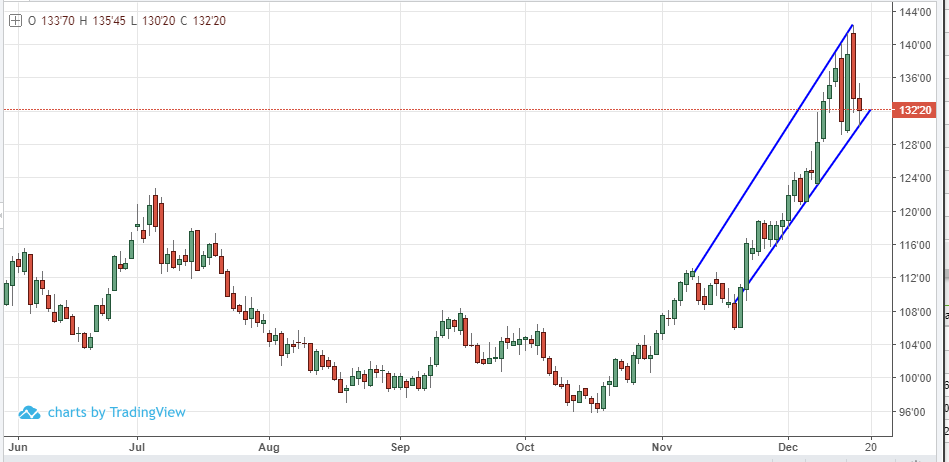
Mar ’20 coffee futures continue with volatile price action but at the time of writing have rejected the lows and have potential to reverse positive as bulls seek to push this rally forward. The previous 3 trading sessions have seen extreme volatility being 3 of the largest daily ranges March coffee has seen! So far, the rally has remained supported by strong fundamentals with tightening supplies and strong demand but after several weeks of steep gains it’s reasonable to expect some resistance. It’s possible that the overbought condition has been corrected but the bulls should be cautious about a sharp pull back in prices if coffee closes below resistance levels. On the daily charts Mar ’20 coffee I still in a strong upward channel, the funds have covered their shorts and are now strong buyers, and the fundamentals are still bullish. In my opinion, there is still an opportunity in coffee.
On
the heels of mid-Sep-to-early-Oct's steeper, accelerated, 3rd-wave-looking
recovery, the past week-and-a-half's boringly lateral chop is first considered
a corrective/consolidative event that warns of a continuation of the uptrend
that preceded it to new highs above 04-Oct's 891.0 high. This count
remains consistent with our broader base/correction/recovery count introduced
in 13-Sep's Technical Blog following that
day's bullish divergence in short-term momentum above 07-Sep's 809.5 minor
corrective high detailed in the hourly chart below.
The
important takeaway from this month's lateral, sleepy price action is the
definition of Wed's 851.5 low as
the end or lower boundary of a suspected 4th-Wave correction. A failure
below 851.5 will confirm a bearish divergence in daily momentum and defer or
threaten a bullish count enough to warrant non-bullish decisions like
long-covers. A failure below 851.5 will not
necessarily negate a broader bullish count, but it will threaten it enough to
warrant defensive measures as the next pertinent technical levels below 851.5 are
13-Sep's prospective minor 1st-Wave high at 813.8 and obviously 08-Sep's 766.0
low. And making non-bullish decisions "down there" is
sub-optimal to say the least. Per such, both short- and longer-term
commercial traders are advised to pare or neutralize bullish exposure on a
failure below 851.5, acknowledging and accepting whipsaw risk- back above 04-Oct's
891.0 high- in exchange for much deeper and sub-optimal nominal risk below
766.0.
On
a broader scale, the daily log scale chart above shows the developing potential
for a bearish divergence in daily momentum that will be considered confirmed
below 851.5. This chart also shows the past month's recovery thus far
stalling in the immediate neighborhood of the (888.0) Fibonacci
minimum 38.2% retrace of Apr-Sep's entire 1128 - 766 decline). COMBINED
with a failure below 851.5, traders
would then need to be concerned with at least a larger-degree correction pf the
past month's rally and possibly a resumption of Apr-Sep's major downtrend.
Until
and unless the market fails below 851.5 however, we would
remind longer-term players of the key elements on which our bullish count is
predicated:
a confirmed bullish divergence in WEEKLY momentum
(below)
amidst
an
historically low 11% reading in out RJO Bullish Sentiment Index and
a
textbook complete and major 5-wave Elliott sequence down from 29-Apr's
1128 high to 08-Sep's 766.0 low.
Thus
far, the market is only a month into correcting a 4-MONTH, 32% drawdown, so
further and possibly protracted gains remain well within the bounds of a major
(suspected 2nd-Wave) correction of Apr-Sep's decline within an even more
massive PEAK/reversal process from 17-May's 1219 high on an active continuation
basis below.
These
issues considered, a bullish policy and exposure remain advised with a failure
below 851.5 required to defer or threaten this call enough to warrant moving to
a neutral/sideline position. In lieu of such weakness, we anticipate a
continuation of the past month's rally to new highs and potentially significant
gains above 891.0.
Agricultural - Grain Futures Update w/Stephen Davis - 12/20/2019
Grain Futures Update w/Stephen Davis - 12/20/2019
By: Stephen DavisPosted 12/20/2019
Stephen Davis discusses this week's movements in the grain markets. With the Phase One Trade Deal signed, Stephen discusses how China will impact the grains through the use of monthly charts
Agricultural - Live Cattle Market Starting to Pull Back
Live Cattle Market Starting to Pull Back
By: Peter McGinnPosted 12/18/2019
After what looked like a breakout in the live cattle market
on Friday after a $2.37 rally with the news of Phase 1 of the China deal being
done, we are starting to see a little bit of a pullback in the market after
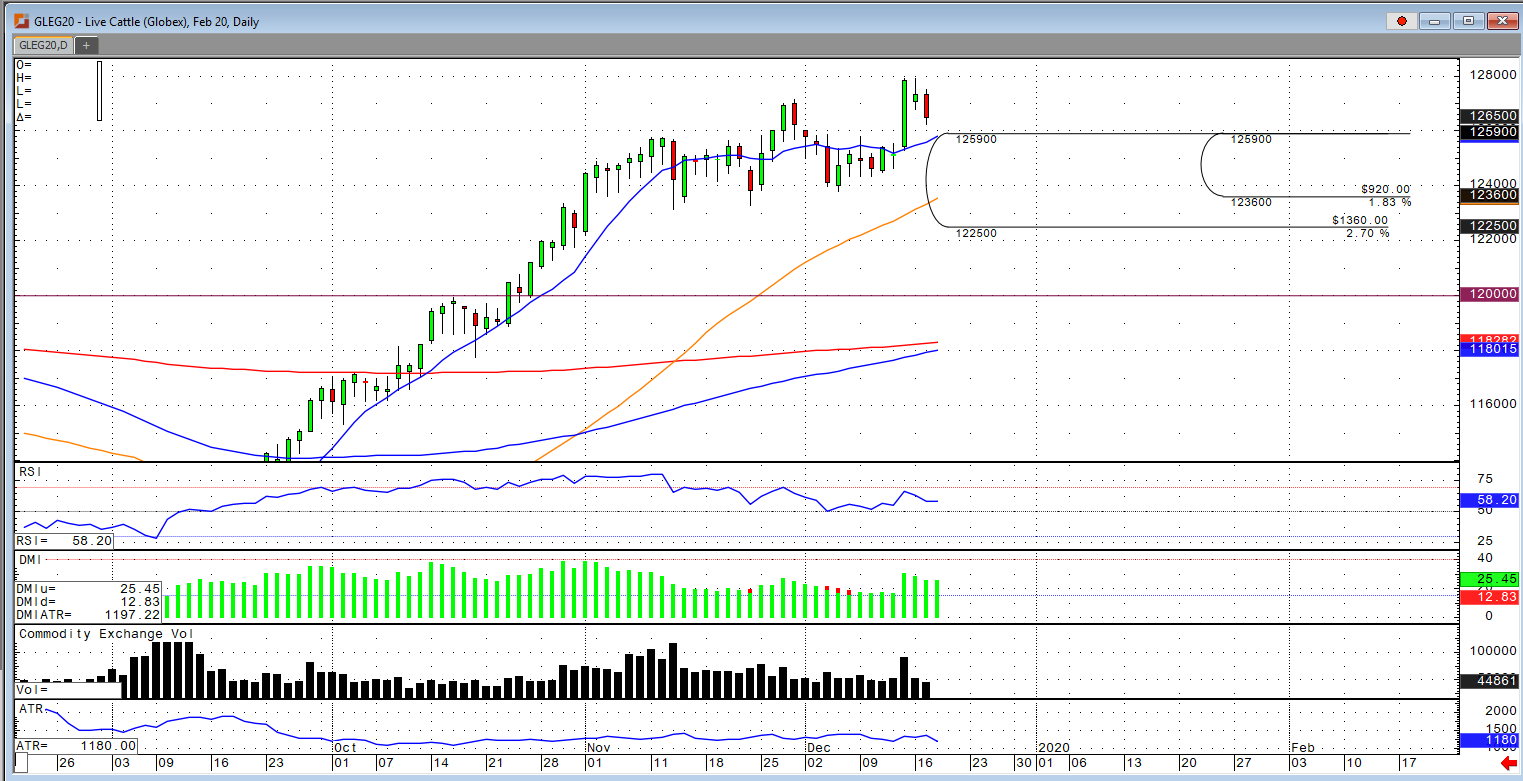
Monday and Tuesday’s trade. I see the market continuing to trade sideways or
down for the rest of the week and test the 10 DMA at $125.815 (FEB Contract).
If more details emerge on what China will be buying, then I would think this
market bounces off the 10 DMA and make another move to the upside. The April
contract showed us that a top is in with a possible key reversal on the chart
and that could signal to the longs in the market to liquidate their position
giving back the premium the futures market had to the cash for the near-term.
Managed money fund traders held a relatively large net long
position of 78,214 contracts in the last COT update. The USDA boxed beef cutout
was down $3.05 at mid-session yesterday and closed $4.27 lower at $212.81. Cash
trade for Tuesday was quiet with no trades reported and the drop in the
boxed-beef market was the biggest one day drop since Nov. 7 and the lowest
since Oct. 7.
Finally, we have the Cattle on Feed report comes out this Friday and the expectation is that the placements are going to increase 1.2%; marketings are looking to be 2.6% lower than last year; and the on feed number is expected to increase 1.9% from last year. The USDA estimated cattle slaughter came in at 123,000 head yesterday. This brings the total for the week so far to 243,000 head, unchanged from last week, but up from 228,000 a year ago. If we get the numbers that are expected in the CoF report then I suspect that would be the confirmation of the downturn in the market and have further liquidation of the longs, with a target of 122.50 to 120.00 in the Feb contract.
Currency - Fed’s Inflation Target Looks to Push the Greenback Lower
Fed’s Inflation Target Looks to Push the Greenback Lower
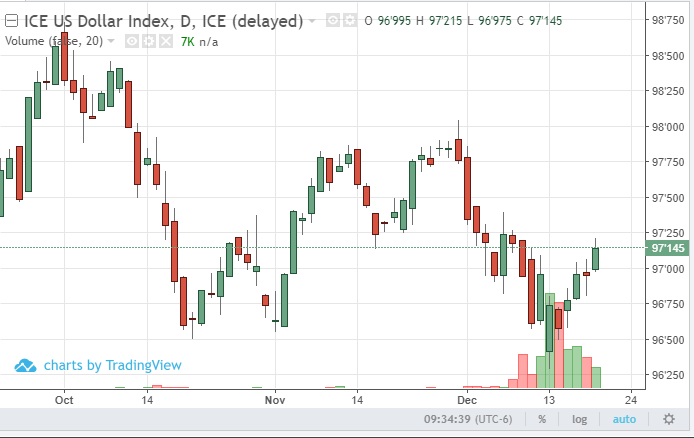
By: Ian BannonPosted 12/20/2019
March U.S. dollar futures are 17 points higher Friday morning after a week of gains. This retracement higher is likely the result of higher interest rates and an oversold technical condition. Continue to watch the 96.58 level; any close under key support should hint at further downside. Fundamentally, the breakdown in the dollar can be attributed to two things. The first is the injection of liquidity being pushed into the US economy by the Fed. A higher supply in any market will drive prices lower. The second factor pushing the dollar lower is the business cycle. Higher inflation is one of the goals of the Fed and is often observed during later stages of the business cycle. The dollar index is most heavily weighted against the euro and the pound, so those currencies have the most to gain if the dollar breaks. Once inflation returns to the economy, it will elevate the price of commodities across the board, so commodity currencies, like the Australian and Canadian dollars, will likely move higher as well.
Equity - Trade Optimism for the New Year
Trade Optimism for the New Year
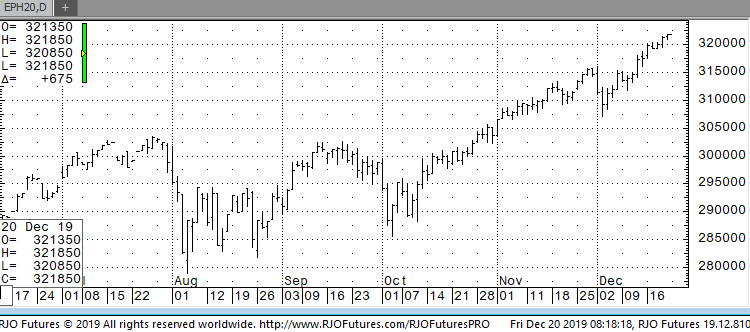
By: Jeff Yasak, Senior Market StrategistPosted Dec 20, 2019 9:18AM CT
U.S. stock futures are climbing to new record highs this morning as traders are staying optimistic that Washington and Beijing will sign a long- awaited trade deal early this new year. U.S. Treasury Secretary, Steven Mnuchin , said that the deal had already been written and translated and it would not face any renegotiation. “We are going through a technical issue now where again the agreement is translated,” Mnuchin said on CNBC. “I don’t expect there’s any changes. We’ll sign the agreement in the beginning of January.” Overall, the increased Chinese purchases of U.S. agricultural, manufactured goods, energy and services will add roughly a half of a point in the next two years to US economic growth.
This year the
S&P 500 is up roughly 28%, on a dovish Federal Reserve, upbeat economic
indicators and expectations of the improving trade relations between the
world’s two largest economies. The market hit a sixth straight intraday high on
Thursday with the benchmark index gaining 1.2% this week.
Resistance is showing 322000 and 322500 while support is checking in around 320300 and 319000.
If you have any questions or would like to discuss the markets further, please feel free to contact me at 888-861-1656 or jyasak@rjofutures.com. Economy - S-T Mo Failure Insufficient to End RBOB Correction, But Beware
S-T Mo Failure Insufficient to End RBOB Correction, But Beware
By: RJO Market InsightsPosted 11/08/2022
Posted on Nov 08, 2022, 07:51 by Dave Toth
In Fri's Technical Webcast we identified a
minor corrective low at 2.6328 from Thur as a mini risk parameter the market
needed to sustain gains above to maintain a more immediate bullish count.
The 240-min chart below shows the market's failure overnight below this level,
confirming a bearish divergence in very short-term momentum. This mo
failure defines Fri's 2.8172 high as
one of developing importance and a parameter from which very short-term traders
can objectively base non-bullish decisions like long-covers.
Given
the magnitude of the past three weeks' broader recovery however, this
short-term momentum failure is of an insufficient scale to conclude anything
more than another correction within this broader recovery from 26-Sep's 2.1877
low. Indeed, overnights failure below 2.6328 only allows us to conclude
the end of the portion of the month-and-a-half rally from 31-Oct's 2.4822 next
larger-degree corrective low. 2.4822 is the
risk parameter this market still needs to fail below to break the uptrend from
18-Oct's 2.3526 low while this 2.3526 low
remains intact as the risk parameter this market needs to fail below to break
the month-and-a-half uptrend. From an
intermediate-to-longer-term perspective, this week's setback falls well within
the bounds of another correction ahead of further gains. This is another
excellent example of the importance of technical and trading SCALE and
understanding and matching directional risk exposure to one's personal risk
profile.
The
reason overnight's admittedly minor mo failure might have longer-term
importance is the 2.8172-area from which it stemmed. In
Fri's Technical Blog we also noted the market's engagement of the
2.8076-to-2.8159-area marked by the 61.8% retrace of Jun0-Sewp's 3.2758 -2.1877
decline and the 1.000 progression of Sep-Oct's initial 2.1877 - 2.6185
(suspected a-Wave) rally from 18-Oct's 2.3526 (suspected b-Wave) low. We
remind longer-term players that because of the unique and compelling confluence
of:
early-Aug's bearish divergence in WEEKLY momentum
amidst
historically
extreme bullish sentiment/contrary opinion levels in our RJO Bullish
Sentiment Index
an
arguably complete and massive 5-wave Elliott sequence from Mar'20's 0.4605
low to Jun's 4.3260 high (as labeled in the weekly log active-continuation
chart below) and
the
5-wave impulsive sub-division of Jun-Sep's (suspected initial 1st-Wave) decline
The
recovery attempt from 26-Sep's 2.1877 low is arguably only a 3-wave (Wave-2)
corrective rebuttal to Jun-Sep's decline within a massive, multi-quarter
PEAK/reversal process. Now granted, due to the magnitude of 2020 -2022's
secular bull market, we discussed the prospect for this (2nd-Wave corrective)
recovery to be "extensive" in terms of both price and time. A
"more extensive" correction is typified by a retracement of 61.8% or
more and spanning weeks or even months following a 3-month decline. Per
such, the (suspected corrective) recovery from 26-Sep's 2.1877 low could easily
have further to go, with commensurately larger-degree weakness than that
exhibited this week (i.e., a failure below at least 2.4822) required
to consider the correction complete. Indeed, the daily log chart above
shows the market thus far respecting former 2.6185-area resistance from 10-Oct
as a new support candidate.
These
issues considered, very shorter-term traders have been advised to move to a neutral/sideline
position following overnight's momentum failure below 2.6328, with a recovery
above 2.8172 required to negate this call, reaffirm the recovery and re-expose
potentially significant gains thereafter. For intermediate- and
longer-term players, a bullish policy and exposure remain advised with a
failure below 2.4822 required to threaten this call enough to warrant
neutralizing exposure. We will be watchful for another bearish divergence
in momentum following a recovery attempt that falls short of Fri's 2.8172 high
that would be considered the next reinforcing factor to a count calling that
2.8172 high the prospective end to the month-and-a-half 2nd-Wave
correction. In lieu of such, a resumption of the current rally to
eventual new highs above 2.8172 should not surprise.