Attention New or Frustrated Traders:
Do you want to get into futures trading, but don’t have the time or knowledge necessary to do so? RJO Echo Trading is an intuitive way for investors or “echo followers” to automatically match the performance of veteran and accomplished traders. As an “Echo Follower” you will choose from a selection of vetted and experienced “Echo Leaders”, all you have to do is pay a subscription fee and your account will mimic the trades of your chosen “Leader”. Echo Trading eliminates the learning curve needed to trade futures, making it an option for all.
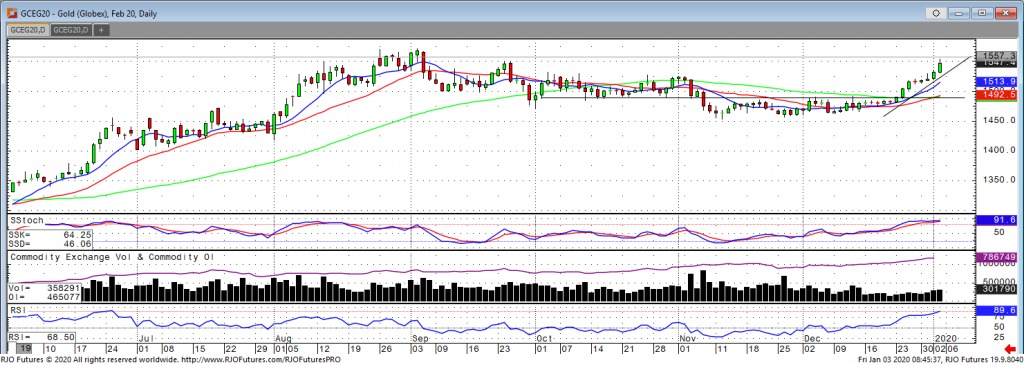
Uncertainty and tensions spiked in the Middle East with the U.S. airstrike overnight which killed an Iranian military leader. The February gold contract traded up to a high of 1554.0 in the overnight session and will likely close positive for the fourth week in a row. Earlier this week we saw weakness in Chinese gold imports for the month of November as well as a decline in India’s gold imports last year. The short-term trend in the gold market remains higher since it broke resistance of 1490.0 on December 24th. Momentum studies are approaching overbought levels which could indicate a pullback. A close below 1513.0 is needed to reverse the trend to the downside. Over the past month the gold market has held up well despite continued gains in in the stock market. Any escalations with the Middle East could see a risk off environment with a flight to safe-haven assets.
If you have any questions or would like to discuss the markets further, please feel free to contact me at 800-826-2270 or therrmann@rjofutures.com. Energy - Oil Prices Surge Following Killing of Iranian Military Leader
Oil Prices Surge Following Killing of Iranian Military Leader
By: Alex Turro, Senior Market StrategistPosted Jan 3, 2020 9:21AM CT
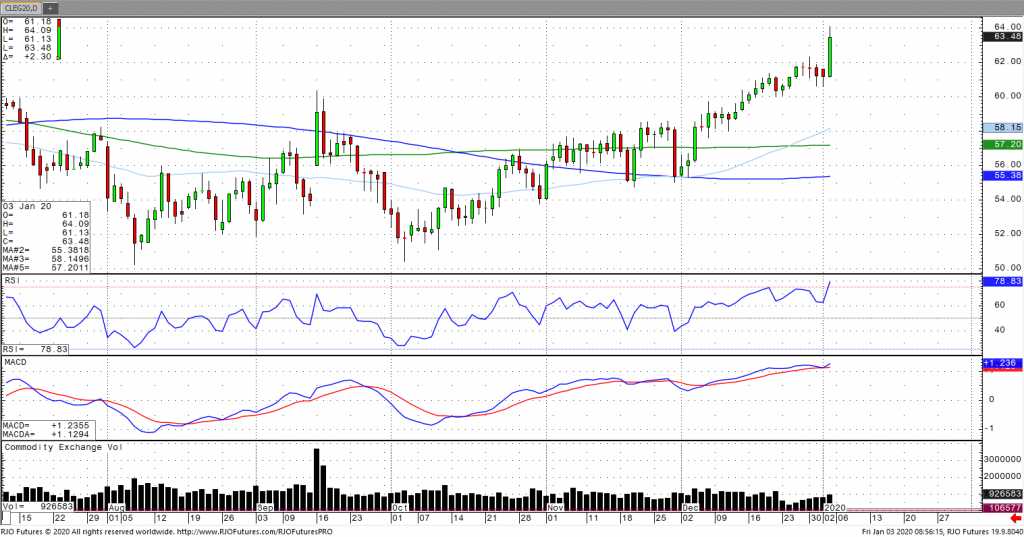
Oil prices have surged over 4% after a U.S. airstrike killed a high-ranking Iranian military leader, Qassem Soleimani, the Iranian general who led the Revolutionary Guard’s Quds force. The attack heightens geopolitical risk sentiment with fears of retaliation from Tehran on Middle Eastern energy infrastructure. This comes as tensions have been building after Iran backed Iraqi’s raided the American embassy earlier this week to protest U.S. airstrikes. The trade, now raised with geopolitical risk premium, will be looking ahead to oil demand growth as well as the current deal between OPEC and its partners. OPEC and its allies had agreed to a production cut of an additional 500,00 bpd to 1.2 million bpd that extends through March. Increased U.S. shale output has helped the U.S become the largest oil producer, doubling its oil production to 12.66 million bpd over the last decade according the EIA. Expectations, however, are for slower U.S. production growth to 1.1 million bpd down from 1.6 million bpd the year prior in 2019. With the recent spike in prices, the market is signaling immediate term overbought with today’s range see between 60.38 – 64.
If you have any questions or would like to discuss the markets further, please feel free to contact me at 800-438-4805 or aturro@rjofutures.com. Softs - Cocoa Futures - New Year, New Demand
Cocoa Futures - New Year, New Demand
By: Peter MoosesPosted 01/03/2020
March
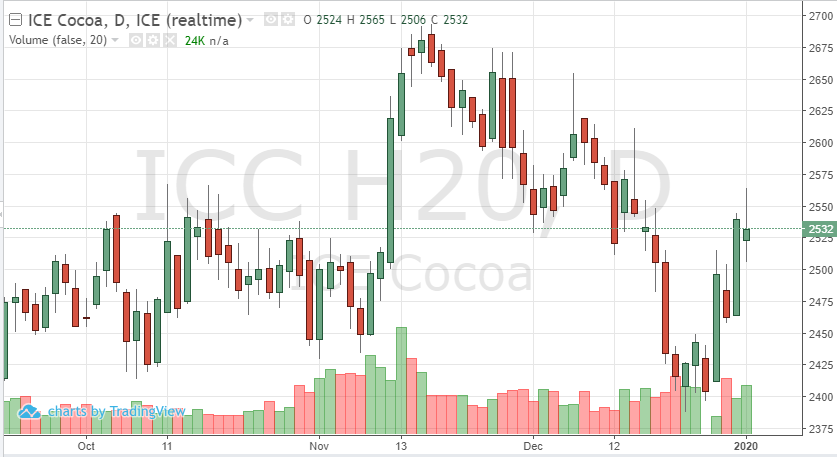
cocoa futures have rallied this past trading week as we leave 2019 and enter
2020. After the new year, the contract continued the move higher back towards
2550. The market has been supported by the recent positive global sentiment.
Equities continue to make all-time highs which is carrying over to most
commodities.
Cocoa is also finding a positive tone in the near-term demand of the soft. With the Euro and Pound moving higher, cocoa has followed. The Pound has climbed since the UK election. If demand can continue to grow out of Europe, even in the short-term, prices should be able to test 2600 by next month’s contract roll.
Softs - Coffee Facing Possible Strong Correction
Coffee Facing Possible Strong Correction
By: Adam TuiaanaPosted 01/02/2020
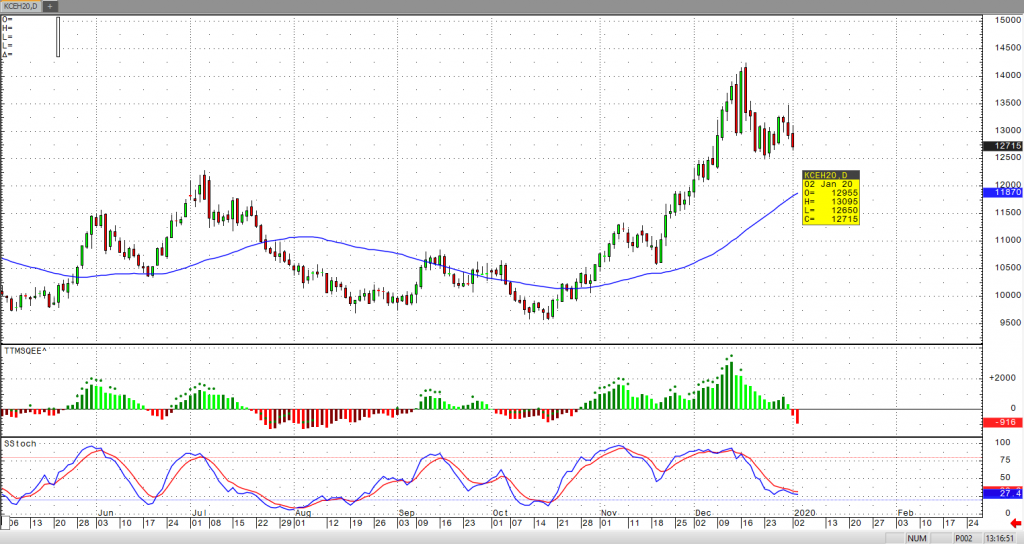
Tightening supplies have sparked a strong bull ran
in March coffee prices over the past month, but we are likely to see a
temporary selloff back down to the 122 level in the very near term. I am still
very much bullish due to the fundamentals of March coffee, but such strong
buying over a short period of time is likely to be met by profit taking and new
longs may step aside for the time being. Our friends at The Hightower Group
shared that “In spite of the year-ending pullback, coffee prices climbed more
than 25% value during 2019 and rallied more than 50% above their 14-year lows
posted last April.” This is significant for a market that has been in a major
bear trend for such long period of time. We have broken above the 142245 high
from October of 2018 and we will likely continue in this direction, after this
pullback has taken place.
From a technical perspective, we have cleared several resistance areas, including 14225, but in the near term we should see some continued long liquidation, and the 122 level is critical for holding support. With momentum and volume at high levels, the bull camp should take a breath and re-join once the 122 level has been reached.
On
the heels of mid-Sep-to-early-Oct's steeper, accelerated, 3rd-wave-looking
recovery, the past week-and-a-half's boringly lateral chop is first considered
a corrective/consolidative event that warns of a continuation of the uptrend
that preceded it to new highs above 04-Oct's 891.0 high. This count
remains consistent with our broader base/correction/recovery count introduced
in 13-Sep's Technical Blog following that
day's bullish divergence in short-term momentum above 07-Sep's 809.5 minor
corrective high detailed in the hourly chart below.
The
important takeaway from this month's lateral, sleepy price action is the
definition of Wed's 851.5 low as
the end or lower boundary of a suspected 4th-Wave correction. A failure
below 851.5 will confirm a bearish divergence in daily momentum and defer or
threaten a bullish count enough to warrant non-bullish decisions like
long-covers. A failure below 851.5 will not
necessarily negate a broader bullish count, but it will threaten it enough to
warrant defensive measures as the next pertinent technical levels below 851.5 are
13-Sep's prospective minor 1st-Wave high at 813.8 and obviously 08-Sep's 766.0
low. And making non-bullish decisions "down there" is
sub-optimal to say the least. Per such, both short- and longer-term
commercial traders are advised to pare or neutralize bullish exposure on a
failure below 851.5, acknowledging and accepting whipsaw risk- back above 04-Oct's
891.0 high- in exchange for much deeper and sub-optimal nominal risk below
766.0.
On
a broader scale, the daily log scale chart above shows the developing potential
for a bearish divergence in daily momentum that will be considered confirmed
below 851.5. This chart also shows the past month's recovery thus far
stalling in the immediate neighborhood of the (888.0) Fibonacci
minimum 38.2% retrace of Apr-Sep's entire 1128 - 766 decline). COMBINED
with a failure below 851.5, traders
would then need to be concerned with at least a larger-degree correction pf the
past month's rally and possibly a resumption of Apr-Sep's major downtrend.
Until
and unless the market fails below 851.5 however, we would
remind longer-term players of the key elements on which our bullish count is
predicated:
a confirmed bullish divergence in WEEKLY momentum
(below)
amidst
an
historically low 11% reading in out RJO Bullish Sentiment Index and
a
textbook complete and major 5-wave Elliott sequence down from 29-Apr's
1128 high to 08-Sep's 766.0 low.
Thus
far, the market is only a month into correcting a 4-MONTH, 32% drawdown, so
further and possibly protracted gains remain well within the bounds of a major
(suspected 2nd-Wave) correction of Apr-Sep's decline within an even more
massive PEAK/reversal process from 17-May's 1219 high on an active continuation
basis below.
These
issues considered, a bullish policy and exposure remain advised with a failure
below 851.5 required to defer or threaten this call enough to warrant moving to
a neutral/sideline position. In lieu of such weakness, we anticipate a
continuation of the past month's rally to new highs and potentially significant
gains above 891.0.
Agricultural - Grain Futures Update w/Stephen Davis - 01/03/2020
Grain Futures Update w/Stephen Davis - 01/03/2020
By: Stephen DavisPosted 01/03/2020
Its a new year and with that, a whole new slew of opportunities in the grain markets. Stephen Davis discusses these opportunities in addition to commentary on how the phase one deal with China is affecting grains.Agricultural - While Fundamentals Support, There Are still Uncertainties in Corn Market
While Fundamentals Support, There Are still Uncertainties in Corn Market
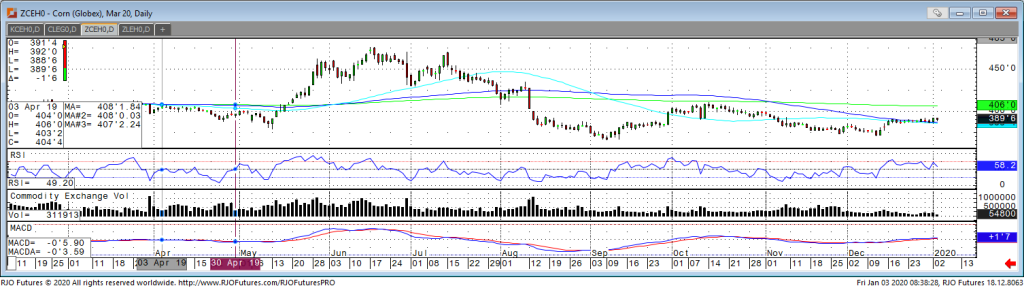
By: Tony Cholly, Senior Market StrategistPosted Jan 3, 2020 8:48AM CT
March corn appears to be setup for a breakout coming soon. Overnight
news has caused some confusion as to how this will impact phase one of a trade
deal. Managed money is holding a net short position of 85,000+ contracts while
open interest remains low. On top of the potential short covering rally, the
market may also need to absorb new buying from index funds. The Jan USDA
supply/demand update is likely to show lower production and higher demand, with
the wild card still being that China may buy more corn. Forecasts for drier
weather in Brazilian and Argentine corn growing areas through mid-January. In addition, corn continues to find support
from the prospect of increased Chinese imports this year.
Corn fundamentals are shifting more in the favor of the bull camp. Today, resistance comes in at 393 and 395 with support coming in around 389 and then 386 below that.
If you have any questions or would like to discuss the markets further, please feel free to contact me at 800-826-2270 or tcholly@rjofutures.com. Currency - U.S. Dollar Futures Look to Weaken Further
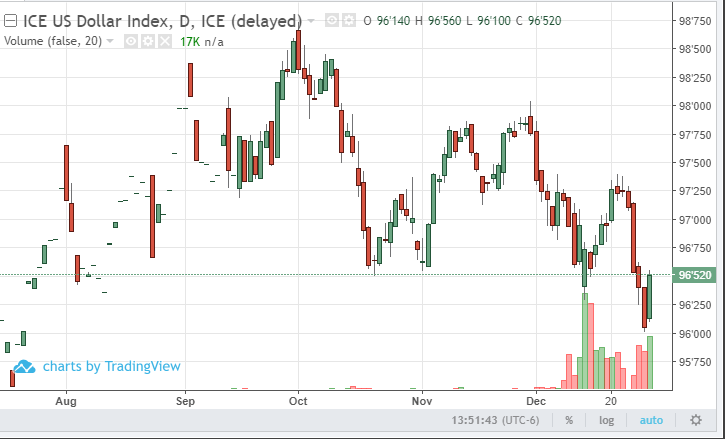
U.S. Dollar Futures Look to Weaken Further
By: Ian BannonPosted 01/02/2020
U.S. dollar futures traded nearly 40 points higher on the first trading day of the new year. It appears that the oversold condition is being corrected, however the overall pattern in the dollar index is still extremely bearish. The Federal Reserve’s repurchase package is clearly pressuring the greenback as lower highs and lower lows take shape on the chart. The euro holds the most weight against the dollar index, constituting 58% of the weighing followed by the yen at 14%. Therefore, I believe these two currencies have the most to gain should the sell-off in the dollar continue. The daily chart pattern of the euro indicates a bottoming process is in place. President Trump is set to sign the phase one China deal on January 15th, which could help support the dollar. Furthermore, US interest rates remain more attractive relative to other countries. So the dollar will likely put up a fight before moving significantly lower, but the momentum is adamantly negative at the moment.
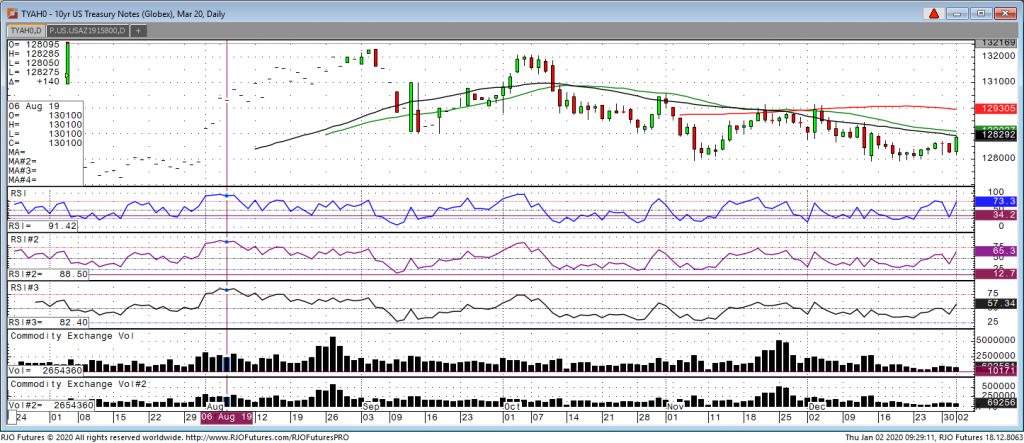
As we enter 2020, treasuries, including the lead bond, the
10-year note is up 11 ticks at 128.25. Stocks opened higher as well as the S&P
500 hit a high of 3251.75 but failed to take out the contract high at 3254
which was hit on Dec 27. My belief is that treasuries will find good bids early
in the first quarter on continued uncertainty with trade issues from China. Just
because “Phase One” will be signed and delivered, there will still be obstacles
going forward as China is very reluctant to budge on futures demands from the U.S.
Economic news around the globe overnight was somewhat strong as many countries reported decent PMI numbers and, in the U.S., we saw the Markit PMI come in a tad weaker. Looking at technicals in the 10-year note, 12829 is the 40-day moving average and 129-02 is the 50-day moving average. If the note clears those levels on a closing basis, look for the market to attack the 100-day moving average at 129-31. The remainder of the week in terms of the economic news is light with the highlight next week comes the monthly employment number which comes out next Friday.
If you have any questions or would like to discuss the markets further, please feel free to contact me at 800-826-2270 or gperlin@rjofutures.com. Equity - Stock Rally Paused After Assassination of Iranian General
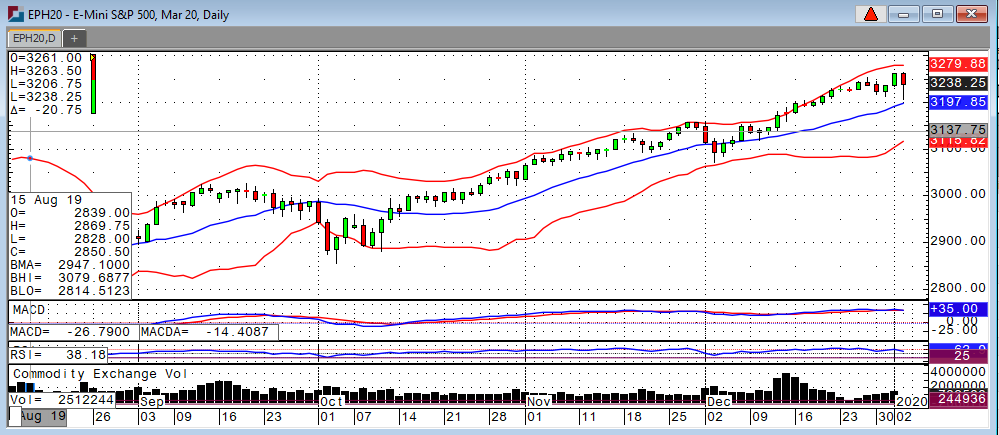
Stock Rally Paused After Assassination of Iranian General
By: Ian BannonPosted 01/03/2020
U.S. equity futures are under pressure Friday morning after the assassination of top Iranian general, Qassem Suleimani, by American drones. Iran’s supreme leader vowed “severe revenge” against US forces. The commitment of traders’ summary reported non-commercial traders adding over 56,000 contracts to the long side of the S&P as of Monday, taking the overall position net long and not yet overbought. Meanwhile, the index is 4% higher since the beginning of December and finished 29% higher for 2019. I believe the market is stretched at these levels, so any escalation with Iran will likely cause further stock market selling. Adding to downside pressure is a large discrepancy between corporate earnings and index levels. Lastly, the melt-up in equities goes together with the repurchase operations coming from the Fed. This is pushing markets higher on the back of increased dollar liquidity, instead of positive economic data.
Economy - S-T Mo Failure Insufficient to End RBOB Correction, But Beware
S-T Mo Failure Insufficient to End RBOB Correction, But Beware
By: RJO Market InsightsPosted 11/08/2022
Posted on Nov 08, 2022, 07:51 by Dave Toth
In Fri's Technical Webcast we identified a
minor corrective low at 2.6328 from Thur as a mini risk parameter the market
needed to sustain gains above to maintain a more immediate bullish count.
The 240-min chart below shows the market's failure overnight below this level,
confirming a bearish divergence in very short-term momentum. This mo
failure defines Fri's 2.8172 high as
one of developing importance and a parameter from which very short-term traders
can objectively base non-bullish decisions like long-covers.
Given
the magnitude of the past three weeks' broader recovery however, this
short-term momentum failure is of an insufficient scale to conclude anything
more than another correction within this broader recovery from 26-Sep's 2.1877
low. Indeed, overnights failure below 2.6328 only allows us to conclude
the end of the portion of the month-and-a-half rally from 31-Oct's 2.4822 next
larger-degree corrective low. 2.4822 is the
risk parameter this market still needs to fail below to break the uptrend from
18-Oct's 2.3526 low while this 2.3526 low
remains intact as the risk parameter this market needs to fail below to break
the month-and-a-half uptrend. From an
intermediate-to-longer-term perspective, this week's setback falls well within
the bounds of another correction ahead of further gains. This is another
excellent example of the importance of technical and trading SCALE and
understanding and matching directional risk exposure to one's personal risk
profile.
The
reason overnight's admittedly minor mo failure might have longer-term
importance is the 2.8172-area from which it stemmed. In
Fri's Technical Blog we also noted the market's engagement of the
2.8076-to-2.8159-area marked by the 61.8% retrace of Jun0-Sewp's 3.2758 -2.1877
decline and the 1.000 progression of Sep-Oct's initial 2.1877 - 2.6185
(suspected a-Wave) rally from 18-Oct's 2.3526 (suspected b-Wave) low. We
remind longer-term players that because of the unique and compelling confluence
of:
early-Aug's bearish divergence in WEEKLY momentum
amidst
historically
extreme bullish sentiment/contrary opinion levels in our RJO Bullish
Sentiment Index
an
arguably complete and massive 5-wave Elliott sequence from Mar'20's 0.4605
low to Jun's 4.3260 high (as labeled in the weekly log active-continuation
chart below) and
the
5-wave impulsive sub-division of Jun-Sep's (suspected initial 1st-Wave) decline
The
recovery attempt from 26-Sep's 2.1877 low is arguably only a 3-wave (Wave-2)
corrective rebuttal to Jun-Sep's decline within a massive, multi-quarter
PEAK/reversal process. Now granted, due to the magnitude of 2020 -2022's
secular bull market, we discussed the prospect for this (2nd-Wave corrective)
recovery to be "extensive" in terms of both price and time. A
"more extensive" correction is typified by a retracement of 61.8% or
more and spanning weeks or even months following a 3-month decline. Per
such, the (suspected corrective) recovery from 26-Sep's 2.1877 low could easily
have further to go, with commensurately larger-degree weakness than that
exhibited this week (i.e., a failure below at least 2.4822) required
to consider the correction complete. Indeed, the daily log chart above
shows the market thus far respecting former 2.6185-area resistance from 10-Oct
as a new support candidate.
These
issues considered, very shorter-term traders have been advised to move to a neutral/sideline
position following overnight's momentum failure below 2.6328, with a recovery
above 2.8172 required to negate this call, reaffirm the recovery and re-expose
potentially significant gains thereafter. For intermediate- and
longer-term players, a bullish policy and exposure remain advised with a
failure below 2.4822 required to threaten this call enough to warrant
neutralizing exposure. We will be watchful for another bearish divergence
in momentum following a recovery attempt that falls short of Fri's 2.8172 high
that would be considered the next reinforcing factor to a count calling that
2.8172 high the prospective end to the month-and-a-half 2nd-Wave
correction. In lieu of such, a resumption of the current rally to
eventual new highs above 2.8172 should not surprise.