It’s time to turn the page to a new year! Receive $5-A-Side commissions for 60-days when you open a Broker-Assisted account anytime during January and February!
New: E-mini S&P 500 Investor Kit
Historically, the E-mini S&P 500 is one of the most popular and widely traded futures contracts around the world. The reason behind its popularity lies within the leverage it affords the trader, and when you couple that with its accessibility and ease to trade it makes the contract viable to virtually any trader. The S&P 500 hits new highs seemingly every day and now is the perfect time to add it to your portfolio. Complete with actionable trading strategies our E-mini S&P 500 Investor kit is here to help all traders, regardless of experience!
The Markets
Metals - Silver is Looking to Benefit From Stimulus Check
Silver is Looking to Benefit From Stimulus Check
By: Eli Tesfaye, Senior Market StrategistPosted Jan 15, 2021 8:47AM CT
Silver is trying to start the new year on solid footing. Of course, the silver market hasn’t had the kind of run Bitcoin has been experiencing. With more stimulus looking to get passed with the new Biden administration, any major sell-off in silver resulting from US dollar strength will probably be met by bargain buying interest. Silver price structure suggests that sideways to slightly higher price action might be in the cards in the coming weeks. If traders are not inclined to chase Bitcoin, they could consider using options to get involved in the Silver market. You can reach out to me to further discuss trade ideas.
From a technical perspective, a close above 26.20 is needed to get more upside interest in the short run. Though the long term, Silver could have a better run in 2021 than it did in 2020.
Silver Weekly Chart If you have any questions or would like to discuss the markets further, please feel free to contact me at 800-367-7290 or etesfaye@rjofutures.com. Energy - Oil Alerts for Pullback
Oil Alerts for Pullback
By: Alex Turro, Senior Market StrategistPosted Jan 15, 2021 8:40AM CT
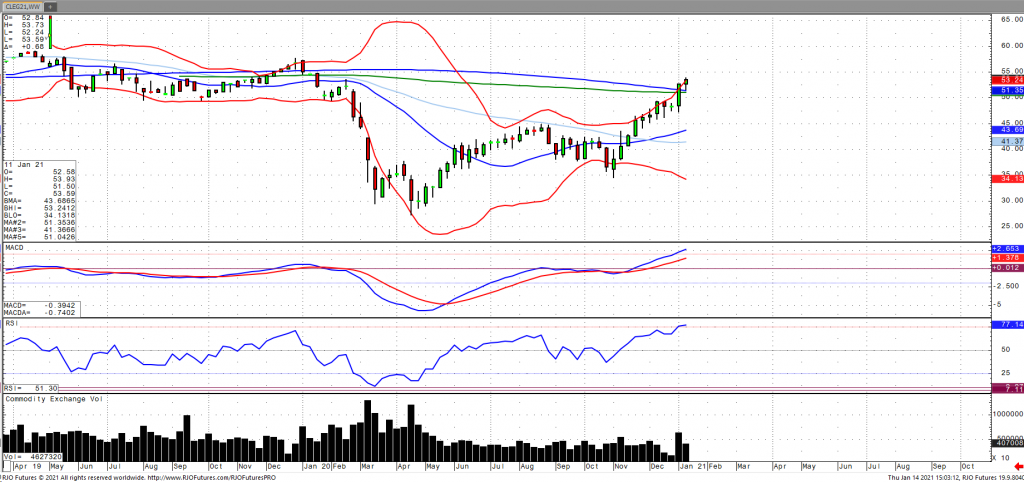
Oil prices have continued to ramp higher as of Thursday afternoon on the back of Chinese 2020 imports jumping 7.3% despite a 15.8% decrease in imports for the month of December as well as an expansion in Chinese refineries. Concerns regarding global demand prospects appear to have been renewed as restrictions and lockdowns across Europe and parts of Asia have come back into effect. OPEC+ left its world demand forecast unchanged, suggesting oil usage will rise by 5.9 million barrels per day to 95.9 million bpd noting, however, that the outlook remains clouded due to the ongoing pandemic. The market remains bullish trend and will continue its inflation higher as oil volatility (OVX) breaks closer to/below 30. However, currently the market signaling immediate term overbought with today’s range seen between 48.65 – 54.49.
Crude Oil Feb '21 Weekly Chart If you have any questions or would like to discuss the markets further, please feel free to contact me at 800-438-4805 or aturro@rjofutures.com. Softs - Cocoa Futures - New Year, Same Story
Cocoa Futures - New Year, Same Story
By: Peter MoosesPosted 01/15/2021
Although
we turned the calendar to a new year, most of our market stories remain the
same. How will Covid restrictions affect supply and demand? How are the global
markets and political unrest going to affect commodity and currency prices?
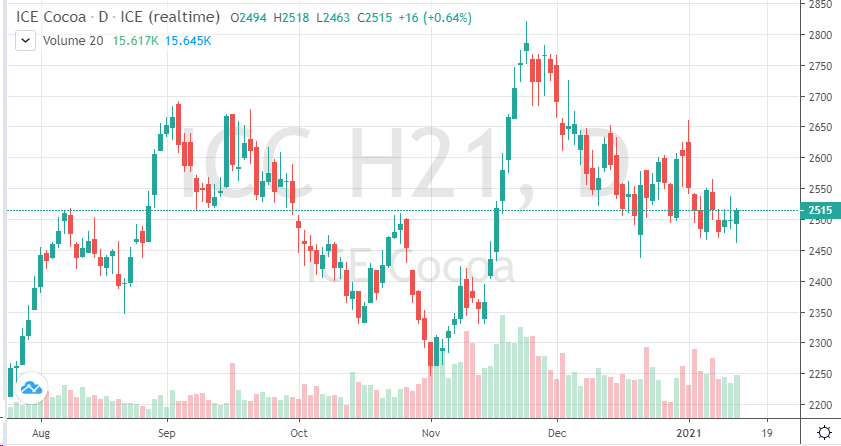
Two
weeks into the new year and the March cocoa contract has found a range to trade
in. On the chart, after a short sell-off, prices have consolidated. The market
seems to like cocoa prices between 2450-2550 for now.
As
the European and US stock markets move higher and continue to act like any news
is good news – cocoa hasn’t been able to find its direction. Demand continues
to be weak for cocoa and production remains strong. Volatility in the
currencies, mainly Pound, Euro and Dollar, have added stress to an already uncertain
market.
Once restrictions are eased and more openings occur, cocoa prices should head back to 2800. Traders should consider buying calls in further out months.
On
the heels of mid-Sep-to-early-Oct's steeper, accelerated, 3rd-wave-looking
recovery, the past week-and-a-half's boringly lateral chop is first considered
a corrective/consolidative event that warns of a continuation of the uptrend
that preceded it to new highs above 04-Oct's 891.0 high. This count
remains consistent with our broader base/correction/recovery count introduced
in 13-Sep's Technical Blog following that
day's bullish divergence in short-term momentum above 07-Sep's 809.5 minor
corrective high detailed in the hourly chart below.
The
important takeaway from this month's lateral, sleepy price action is the
definition of Wed's 851.5 low as
the end or lower boundary of a suspected 4th-Wave correction. A failure
below 851.5 will confirm a bearish divergence in daily momentum and defer or
threaten a bullish count enough to warrant non-bullish decisions like
long-covers. A failure below 851.5 will not
necessarily negate a broader bullish count, but it will threaten it enough to
warrant defensive measures as the next pertinent technical levels below 851.5 are
13-Sep's prospective minor 1st-Wave high at 813.8 and obviously 08-Sep's 766.0
low. And making non-bullish decisions "down there" is
sub-optimal to say the least. Per such, both short- and longer-term
commercial traders are advised to pare or neutralize bullish exposure on a
failure below 851.5, acknowledging and accepting whipsaw risk- back above 04-Oct's
891.0 high- in exchange for much deeper and sub-optimal nominal risk below
766.0.
On
a broader scale, the daily log scale chart above shows the developing potential
for a bearish divergence in daily momentum that will be considered confirmed
below 851.5. This chart also shows the past month's recovery thus far
stalling in the immediate neighborhood of the (888.0) Fibonacci
minimum 38.2% retrace of Apr-Sep's entire 1128 - 766 decline). COMBINED
with a failure below 851.5, traders
would then need to be concerned with at least a larger-degree correction pf the
past month's rally and possibly a resumption of Apr-Sep's major downtrend.
Until
and unless the market fails below 851.5 however, we would
remind longer-term players of the key elements on which our bullish count is
predicated:
a confirmed bullish divergence in WEEKLY momentum
(below)
amidst
an
historically low 11% reading in out RJO Bullish Sentiment Index and
a
textbook complete and major 5-wave Elliott sequence down from 29-Apr's
1128 high to 08-Sep's 766.0 low.
Thus
far, the market is only a month into correcting a 4-MONTH, 32% drawdown, so
further and possibly protracted gains remain well within the bounds of a major
(suspected 2nd-Wave) correction of Apr-Sep's decline within an even more
massive PEAK/reversal process from 17-May's 1219 high on an active continuation
basis below.
These
issues considered, a bullish policy and exposure remain advised with a failure
below 851.5 required to defer or threaten this call enough to warrant moving to
a neutral/sideline position. In lieu of such weakness, we anticipate a
continuation of the past month's rally to new highs and potentially significant
gains above 891.0.
Agricultural - Grain Futures Update w/Stephen Davis - 01/15/2021
Grain Futures Update w/Stephen Davis - 01/15/2021
By: Stephen DavisPosted 01/15/2021
Stephen Davis discusses the latest news moving the grain markets including the very real possibility that the U.S. may have to start importing soybeans come summer time,Agricultural - Questions in Short-Term Live Cattle Demand
Questions in Short-Term Live Cattle Demand
By: Peter McGinnPosted 01/15/2021
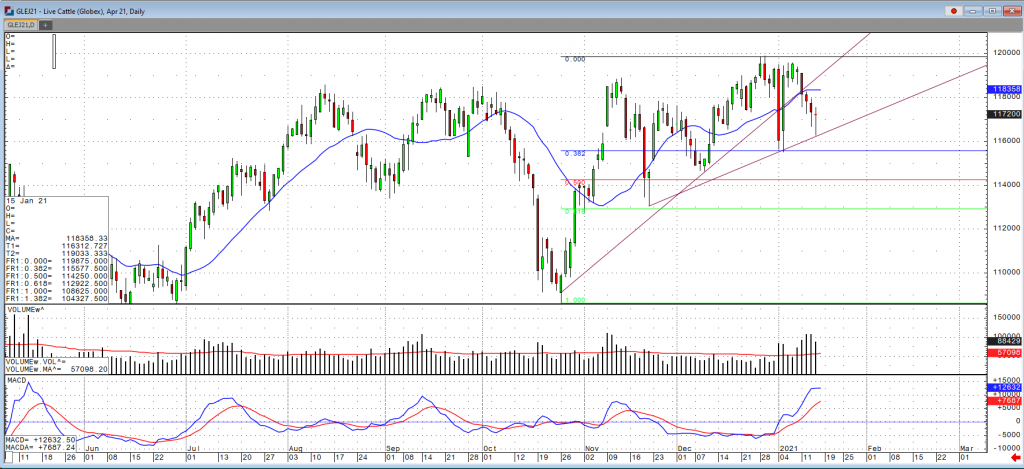
Cash cattle has been trading within the 107-110 range this entire week and continued to trend lower as there have been some trades in Kansas reported at $108. There still seems to be some doubts that short-term demand just won’t be there along with the increased weights seems to be putting negative pressure in the market. With those factors accounted for we have seen a jump in beef prices to the highest levels since December 11th, a shift towards the harsher weather in the plains for the second half of January could cause the market to have some support. The USDA boxed beef cutout was up $2.49 at mid-session yesterday and closed $2.37 higher at $213.37. This was up from $205.81 the previous week and was the highest the cutout had been since December 11. Cash live cattle continued their drift lower on Wednesday, but reported volume was light as of the afternoon. Average dressed steer weights for the week ending January 2 came in at 920 pounds, up from 913 pounds the previous week and 912 a year ago. The 5-year average weekly weight for that week is 902.6. US beef export sales for the week ending January 7 came in at 16,835 tonnes, up from 7,775 the previous week and slightly above the four-week average at 16,254. Cumulative sales for 2021 have reached 202,243 tonnes versus 148,762 last year at this time and a five-year average of 107,783. With the current short-term weather forecast and a solid recovery on the close for the April Cattle off what looks to be the 117 support level, the market looks to retest the recent highs of late December around $120.
Live Cattle Apr '21 Daily ChartEquity - Stocks Down on Biden's Relief Package
Stocks Down on Biden's Relief Package
By: Jeff Yasak, Senior Market StrategistPosted Jan 15, 2021 9:13AM CT
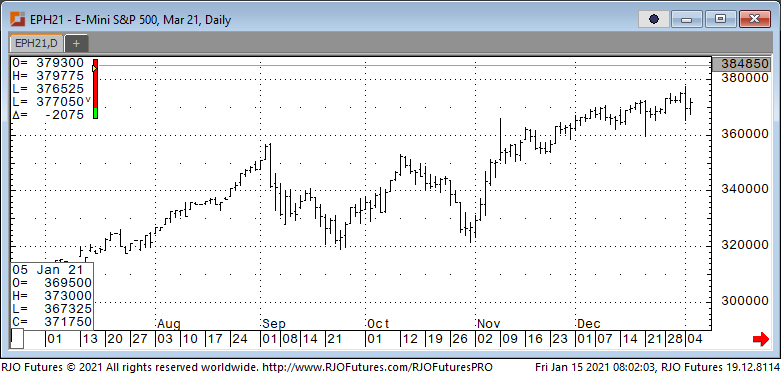
U.S. stocks futures are lower this morning after a $1.9 trillion COVID-19 relief package was released by President-Elect Biden’s team. This package will boost unemployment benefits, include a $1,400 stimulus check to individuals and fund the distribution of COVID-19 vaccines. This package also included a proposal to increase the national minimum wage to $15 an hour, creating some fear with investors. This morning also saw the Commerce Department releasing a surprising drop in December retail sales of 0.7% from the prior month with an adjusted number of 1.4% in November from the previous stated 1.1% decline. This negative news adds to the hit that the U.S economy took at the end of 2020 with rising COVID numbers, increased lockdown restrictions and a loss of 140,000 jobs in December which was the first decline since April.
Resistance today is showing 380500 and 382800 with support at 377500 and 376000.
E-mini S&P 500 Mar '21 Daily Chart If you have any questions or would like to discuss the markets further, please feel free to contact me at 888-861-1656 or jyasak@rjofutures.com. Economy - S-T Mo Failure Insufficient to End RBOB Correction, But Beware
S-T Mo Failure Insufficient to End RBOB Correction, But Beware
By: RJO Market InsightsPosted 11/08/2022
Posted on Nov 08, 2022, 07:51 by Dave Toth
In Fri's Technical Webcast we identified a
minor corrective low at 2.6328 from Thur as a mini risk parameter the market
needed to sustain gains above to maintain a more immediate bullish count.
The 240-min chart below shows the market's failure overnight below this level,
confirming a bearish divergence in very short-term momentum. This mo
failure defines Fri's 2.8172 high as
one of developing importance and a parameter from which very short-term traders
can objectively base non-bullish decisions like long-covers.
Given
the magnitude of the past three weeks' broader recovery however, this
short-term momentum failure is of an insufficient scale to conclude anything
more than another correction within this broader recovery from 26-Sep's 2.1877
low. Indeed, overnights failure below 2.6328 only allows us to conclude
the end of the portion of the month-and-a-half rally from 31-Oct's 2.4822 next
larger-degree corrective low. 2.4822 is the
risk parameter this market still needs to fail below to break the uptrend from
18-Oct's 2.3526 low while this 2.3526 low
remains intact as the risk parameter this market needs to fail below to break
the month-and-a-half uptrend. From an
intermediate-to-longer-term perspective, this week's setback falls well within
the bounds of another correction ahead of further gains. This is another
excellent example of the importance of technical and trading SCALE and
understanding and matching directional risk exposure to one's personal risk
profile.
The
reason overnight's admittedly minor mo failure might have longer-term
importance is the 2.8172-area from which it stemmed. In
Fri's Technical Blog we also noted the market's engagement of the
2.8076-to-2.8159-area marked by the 61.8% retrace of Jun0-Sewp's 3.2758 -2.1877
decline and the 1.000 progression of Sep-Oct's initial 2.1877 - 2.6185
(suspected a-Wave) rally from 18-Oct's 2.3526 (suspected b-Wave) low. We
remind longer-term players that because of the unique and compelling confluence
of:
early-Aug's bearish divergence in WEEKLY momentum
amidst
historically
extreme bullish sentiment/contrary opinion levels in our RJO Bullish
Sentiment Index
an
arguably complete and massive 5-wave Elliott sequence from Mar'20's 0.4605
low to Jun's 4.3260 high (as labeled in the weekly log active-continuation
chart below) and
the
5-wave impulsive sub-division of Jun-Sep's (suspected initial 1st-Wave) decline
The
recovery attempt from 26-Sep's 2.1877 low is arguably only a 3-wave (Wave-2)
corrective rebuttal to Jun-Sep's decline within a massive, multi-quarter
PEAK/reversal process. Now granted, due to the magnitude of 2020 -2022's
secular bull market, we discussed the prospect for this (2nd-Wave corrective)
recovery to be "extensive" in terms of both price and time. A
"more extensive" correction is typified by a retracement of 61.8% or
more and spanning weeks or even months following a 3-month decline. Per
such, the (suspected corrective) recovery from 26-Sep's 2.1877 low could easily
have further to go, with commensurately larger-degree weakness than that
exhibited this week (i.e., a failure below at least 2.4822) required
to consider the correction complete. Indeed, the daily log chart above
shows the market thus far respecting former 2.6185-area resistance from 10-Oct
as a new support candidate.
These
issues considered, very shorter-term traders have been advised to move to a neutral/sideline
position following overnight's momentum failure below 2.6328, with a recovery
above 2.8172 required to negate this call, reaffirm the recovery and re-expose
potentially significant gains thereafter. For intermediate- and
longer-term players, a bullish policy and exposure remain advised with a
failure below 2.4822 required to threaten this call enough to warrant
neutralizing exposure. We will be watchful for another bearish divergence
in momentum following a recovery attempt that falls short of Fri's 2.8172 high
that would be considered the next reinforcing factor to a count calling that
2.8172 high the prospective end to the month-and-a-half 2nd-Wave
correction. In lieu of such, a resumption of the current rally to
eventual new highs above 2.8172 should not surprise.
Economy - Futures Market Outlook w/John Caruso - 01/15/2021
Futures Market Outlook w/John Caruso - 01/15/2021
By: John Caruso, Senior Market StrategistPosted Jan 15, 2021 8:53AM CT
Buy the damn dip!?
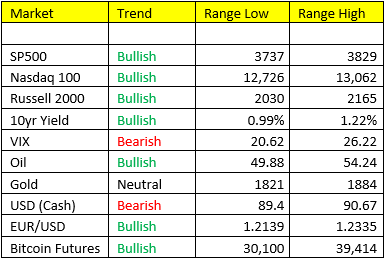
Stocks- pulling off this morning, a well deserved break by the bulls. We’ve got downside in the S&P 500 to 3737 with a compressed volatility index. So long as the VIX remains bearish trend, S&P 500 bullish trend, and within Scenario 2 G/I accelerating, AND the IVOL remains at a heavy PREMIUM (which of course says the market is FEARFUL and hedged for downside risk….we fade that action – we’ll be buying the damn dip. Same goes for the Nasdaq. Wonder why the Russell is setting the pace? That’s an easy one…A. The bastards of 2020, are now the darlings of the reflation trade. B. 26% of the Russell Index consists of bank and other various financial stocks and we all know what financial love….Rising Yields! Banks borrow at the short end of the curve via the Fed overnight lending rate of 0.00-0.25% and lend to the private sector at the long end of the curve via 10yr - 30yr loans. I haven’t sent an index signal out in a while, we’ve been doing well playing the commodity and bond game, but I’m warming up to it.
Bond Yields- I pressed some of our shorts in bonds yesterday, we’ll see how that works out. I think it’s going to workout very well, so long as A. Scenario 2, B. rates remain bullish trend, and C. the stock and commodity bull persists. There will be rallies in bonds throughout the year, but likely within their bearish trend, but we think the 30-35 some odd year Bond bull market is sinking slowly but surely. Honestly I think the Fed wants a steeper yield curve for the health of the banks and also to attempt to stave off any potential for rampant inflation coming down the road. Remember, the new administration, although they’ll never admit it, subscribes to modern monetary theory. Deficits are no big deal and a net positive for the private sector so long as inflation doesn’t become a problem….and remember the Fed has the ability to manipulate the yield curve if necessary to fight inflation.
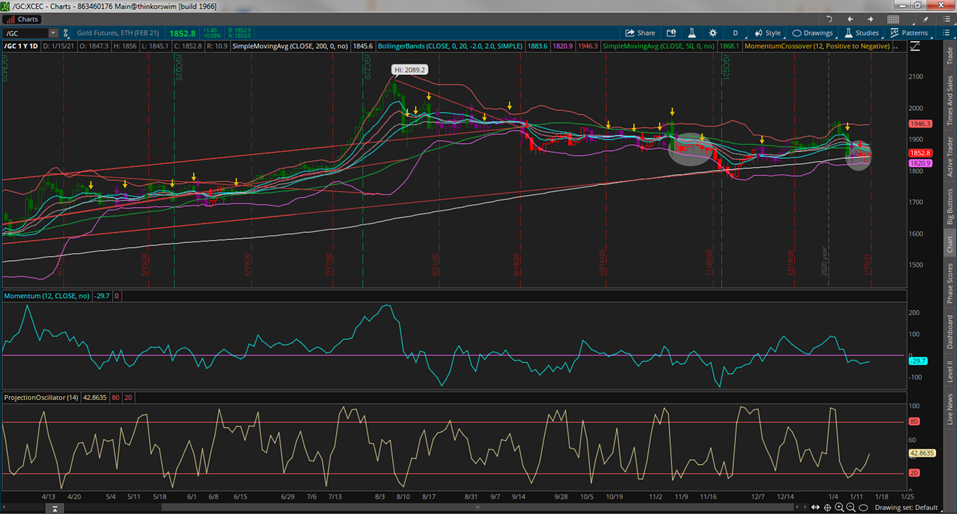
Gold- not doing anything here, as a matter of fact I’ll probably short it if it gets to the top of my range. That’s it….it’s neutral trend, likely range bound for now. It gets ugly if it breaks 1816 from our assessment. If I may, let me share the below chart with you, that show’s two highlighted areas on the chart that look eerily similar, which is why Gold is a risk on the long side that we’re not willing to take:
Disclosure: I’m not a technician so…. 😊
and I know some of you are, so bear with me here….
So you’ve got the break down candle in both of the highlighted areas – we went from bullish (green candles) momentum straight into bearish momentum (red candles). In the first highlighted area from mid-November, you see the breakdown, then about 6/7 trading sessions of sideways action, followed by another 100 point drop. The right shaded area looks to be the same, could this time be different ABSOLUTELY, but this pattern looks unresolved and way too risky for my taste. Besides being in the wrong Scenario, and Neutral trend….Hopefully this further clarifies my stance on gold for the moment.
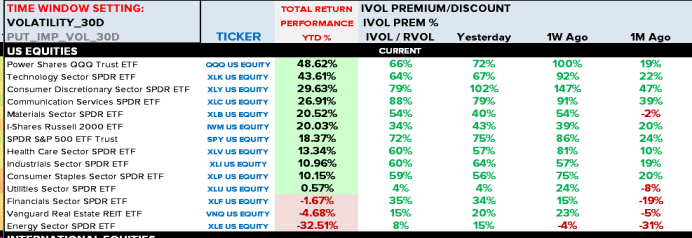
Implied Volatility Ranges If you have any questions or would like to discuss the markets further, please feel free to contact me at 800-669-5354 or jcaruso@rjofutures.com.