RJO FuturesCast

February 7, 2020 | Volume 14, Issue 6

The Markets

Metals - Coronavirus Keeps Gold Supported

Coronavirus has been front and center among every news and media outlet in the world since its inception. It’s no surprise that traders are looking to safe havens such as gold as a way to diversify away from the stock market. Gold traders are probably torn between the fantastic economic data that has been pouring out of the U.S. recently and the coronavirus slowing everything down (at least in the future.) U.S. equities data has had blowout jobs numbers, low unemployment and great company earnings over the past few weeks. It seems like everything is fine if coronavirus didn’t exist. Traders might be bracing for weaker economic data to come in the following months, as the coronavirus will have a lagging effect on the economy with ripple effects yet to be felt. The big picture, longer term central bank buying of the precious metal is the behind the scenes buying support to keep gold above 1500, but to push through 1600 I think more bearish economic data coupled with an acceleration in coronavirus outbreaks is needed.

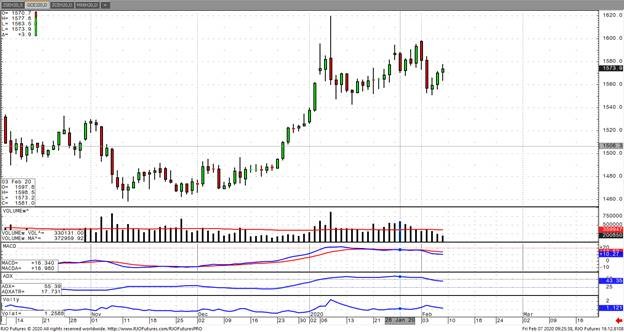
Technically, gold traders must be happy about the key pivot point of 1550 on the April contract holding. I think that really, the next major technical hurdle that gold will need to break is 1600. Once that’s taken out all bets are off as to where it could go. Traders should be carefully watching the volume as well. Rising volume on rising markets is great, but the latter of falling volume is not a good sign. We need confidence in the trade with volume pressing higher along with price action. Besides this technical red flag, gold as a whole in my opinion is completely tied to the US equity market right now. If we do in fact see a major selloff more than just one or two sessions, this could be enough to push gold beyond 1600 when coupled with coronavirus. Options are a great way to step in lightly, with limited risk. If you would like more information on how to play gold please contact me directly.

Gold Apr '20 Daily Chart
Metals - Silver in Tight Consolidation

With astonishing job growth in January, unemployment risk is coming off and keeping silver in check. The trading "risk" from coronavirus is fading. So, all the supportive news that supported silver in the past week has been coming off, leaving it in tight consolidation. The only way I see silver heading higher is if we see inflation creep up. I fear that the impact of the coronavirus has not translated into the dollar; therefore it is hard to know if we will be in an inflationary environment. If anything, I see the risk of short-term deflation.

Technically, silver is looking into more consolidation; below is the gold/silver ratio chart and it suggests that gold is cheap as and is more likely to outperform silver in the coming days. The ratio is poised to go above 90, which means gold will be worth nine-fold.

Gold/Silver Ratio Daily Chart
If you have any questions or would like to discuss the markets further, please feel free to contact me at 800-367-7290 or etesfaye@rjofutures.com.
Energy - Rising Risk in Oil Markets

Oil is headed for a fifth weekly loss as prices have remained aligned with Chinese demand prospects as the threat from the coronavirus continues to settle out. Prices for the last few sessions have looked to an emergency session by OPEC and Russia to further cut production in order to underpin the market, as demand could temporarily drop by 1 - 2 million barrels a day. However, this appears unlikely as Russia is unwilling to compromise with the recommended reduction of 600k barrels a day, down from 800k to 1 million barrels a day. In addition, China moved to reduce tariffs this week on $75 billion worth of goods, which would set to curtail ongoing demand fears. Geopolitical risk remains high as the Katyusha rocket attack on the US Embassy compound in Baghdad the other week exemplifies. This comes amidst the oil market largely fading geopolitical risk between the US and Iran following a non-response by President Trump to the missile attack at the Al Asad air base in Iraq. The market is now bearish trend with today’s range seen between 48.77 – 54.18.

Crude Oil Mar '20 Daily Chart

If you have any questions or would like to discuss the markets further, please feel free to contact me at 800-438-4805 or aturro@rjofutures.com.
Softs - Cotton Prices Jump on Positivity

Mar ’20 cotton prices jump up this with the return of risk on and strong equities. The global attitude towards the Coronavirus has seemingly turned form concern to indifference as the spread of the virus outside of China has been limited by rapid response and containment. There is even talk of progress on treatment and vaccines. The fact that China has gone to great lengths to cushion the economic impact of the outbreak by pumping over $200 billion into the economy and working to lower interest rates. Cotton being an economically sensitive market with a great deal of demand coming out of Asia should see solid gains based on this but there will likely be a cap on cotton prices as the longer-term demand and big picture impact of the viral outbreak is still to be determined.

Cotton Mar '20 Daily Chart
Agricultural - Bullish Canola Count Intact Above Minimum 851.5

Posted on Oct 14, 2022, 07:42 by Dave Toth

On the heels of mid-Sep-to-early-Oct's steeper, accelerated, 3rd-wave-looking recovery, the past week-and-a-half's boringly lateral chop is first considered a corrective/consolidative event that warns of a continuation of the uptrend that preceded it to new highs above 04-Oct's 891.0 high.  This count remains consistent with our broader base/correction/recovery count introduced in 13-Sep's Technical Blog following that day's bullish divergence in short-term momentum above 07-Sep's 809.5 minor corrective high detailed in the hourly chart below.

The important takeaway from this month's lateral, sleepy price action is the definition of Wed's 851.5 low as the end or lower boundary of a suspected 4th-Wave correction.  A failure below 851.5 will confirm a bearish divergence in daily momentum and defer or threaten a bullish count enough to warrant non-bullish decisions like long-covers.  A failure below 851.5 will not necessarily negate a broader bullish count, but it will threaten it enough to warrant defensive measures as the next pertinent technical levels below 851.5 are 13-Sep's prospective minor 1st-Wave high at 813.8 and obviously 08-Sep's 766.0 low.  And making non-bullish decisions "down there" is sub-optimal to say the least.  Per such, both short- and longer-term commercial traders are advised to pare or neutralize bullish exposure on a failure below 851.5, acknowledging and accepting whipsaw risk- back above 04-Oct's 891.0 high- in exchange for much deeper and sub-optimal nominal risk below 766.0.

On a broader scale, the daily log scale chart above shows the developing potential for a bearish divergence in daily momentum that will be considered confirmed below 851.5.  This chart also shows the past month's recovery thus far stalling in the immediate neighborhood of the (888.0) Fibonacci minimum 38.2% retrace of Apr-Sep's entire 1128 - 766 decline).  COMBINED with a failure below 851.5, traders would then need to be concerned with at least a larger-degree correction pf the past month's rally and possibly a resumption of Apr-Sep's major downtrend.

Until and unless the market fails below 851.5 however, we would remind longer-term players of the key elements on which our bullish count is predicated:

  • a confirmed bullish divergence in WEEKLY momentum (below) amidst
  • an historically low 11% reading in out RJO Bullish Sentiment Index and
  • a textbook complete and major 5-wave Elliott sequence down from 29-Apr's 1128 high to 08-Sep's 766.0 low.

Thus far, the market is only a month into correcting a 4-MONTH, 32% drawdown, so further and possibly protracted gains remain well within the bounds of a major (suspected 2nd-Wave) correction of Apr-Sep's decline within an even more massive PEAK/reversal process from 17-May's 1219 high on an active continuation basis below.

These issues considered, a bullish policy and exposure remain advised with a failure below 851.5 required to defer or threaten this call enough to warrant moving to a neutral/sideline position.  In lieu of such weakness, we anticipate a continuation of the past month's rally to new highs and potentially significant gains above 891.0.

Agricultural - Grain Futures Update w/Stephen Davis - 02/07/2019

Stephen Davis discusses the latest movements in the grain markets. With Australia committing to importing U.S. wheat and a the crop report due out next Tuesday, next week is shaping up to be interesting.

Agricultural - Live Cattle Recovering From Coronavirus

The April live cattle contract gapped open yesterday but eventually traded lower to fill the gap putting in a low for the day at 120.45 then eventually closing at 120.97. During the trading session, the high it made on the day was 121.80 which was right at the 10-day moving average before eventually finishing lower. Near term supply looks to be in abundance due to record beef production and aggressive slaughter numbers. Coronavirus played a huge role in this market when the news first came out with the scare essentially depleting demand. It seems that the bottom has been put in for cattle around the 120 level, but looking at the open interest we could see some more long liquidation. I’d like to see the market take out yesterday’s high and close above the 10 DMA, if that happens then I would suspect that the market would make a run to the 123-123.50 level to fill that gap made back on Jan 27.

With April fats trading lower on the day but with less volume than on Monday, it gives me an indication that this was just some profit taking along with the market making a successful effort to fill the gap it made on the open. I am targeting this market to be trading at 123-125 by the end of the month and into March. The USDA estimated cattle slaughter came in at 122,000 head yesterday. This brings the total for the week so far to 243,000 head, up from 239,000 last week and up from 237,000 a year ago. There was no trade in cash live cattle yesterday after prices traded roughly $2 lower last week.

Live Cattle Apr '20 Daily Chart
Economy - S-T Mo Failure Insufficient to End RBOB Correction, But Beware

Posted on Nov 08, 2022, 07:51 by Dave Toth

In Fri's Technical Webcast we identified a minor corrective low at 2.6328 from Thur as a mini risk parameter the market needed to sustain gains above to maintain a more immediate bullish count.  The 240-min chart below shows the market's failure overnight below this level, confirming a bearish divergence in very short-term momentum.  This mo failure defines Fri's 2.8172 high as one of developing importance and a parameter from which very short-term traders can objectively base non-bullish decisions like long-covers.

Given the magnitude of the past three weeks' broader recovery however, this short-term momentum failure is of an insufficient scale to conclude anything more than another correction within this broader recovery from 26-Sep's 2.1877 low.  Indeed, overnights failure below 2.6328 only allows us to conclude the end of the portion of the month-and-a-half rally from 31-Oct's 2.4822 next larger-degree corrective low.  2.4822 is the risk parameter this market still needs to fail below to break the uptrend from 18-Oct's 2.3526 low while this 2.3526 low remains intact as the risk parameter this market needs to fail below to break the month-and-a-half uptrend.  From an intermediate-to-longer-term perspective, this week's setback falls well within the bounds of another correction ahead of further gains.  This is another excellent example of the importance of technical and trading SCALE and understanding and matching directional risk exposure to one's personal risk profile.

The reason overnight's admittedly minor mo failure might have longer-term importance is the 2.8172-area from which it stemmed.  In Fri's Technical Blog we also noted the market's engagement of the 2.8076-to-2.8159-area marked by the 61.8% retrace of Jun0-Sewp's 3.2758 -2.1877 decline and the 1.000 progression of Sep-Oct's initial 2.1877 - 2.6185 (suspected a-Wave) rally from 18-Oct's 2.3526 (suspected b-Wave) low.  We remind longer-term players that because of the unique and compelling confluence of:

  • early-Aug's bearish divergence in WEEKLY momentum amidst
  • historically extreme bullish sentiment/contrary opinion levels in our RJO Bullish Sentiment Index
  • an arguably complete and massive 5-wave Elliott sequence from Mar'20's 0.4605 low to Jun's 4.3260 high (as labeled in the weekly log active-continuation chart below) and
  • the 5-wave impulsive sub-division of Jun-Sep's (suspected initial 1st-Wave) decline

The recovery attempt from 26-Sep's 2.1877 low is arguably only a 3-wave (Wave-2) corrective rebuttal to Jun-Sep's decline within a massive, multi-quarter PEAK/reversal process.  Now granted, due to the magnitude of 2020 -2022's secular bull market, we discussed the prospect for this (2nd-Wave corrective) recovery to be "extensive" in terms of both price and time.  A "more extensive" correction is typified by a retracement of 61.8% or more and spanning weeks or even months following a 3-month decline.  Per such, the (suspected corrective) recovery from 26-Sep's 2.1877 low could easily have further to go, with commensurately larger-degree weakness than that exhibited this week (i.e., a failure below at least 2.4822) required to consider the correction complete.  Indeed, the daily log chart above shows the market thus far respecting former 2.6185-area resistance from 10-Oct as a new support candidate.

These issues considered, very shorter-term traders have been advised to move to a neutral/sideline position following overnight's momentum failure below 2.6328, with a recovery above 2.8172 required to negate this call, reaffirm the recovery and re-expose potentially significant gains thereafter.  For intermediate- and longer-term players, a bullish policy and exposure remain advised with a failure below 2.4822 required to threaten this call enough to warrant neutralizing exposure.  We will be watchful for another bearish divergence in momentum following a recovery attempt that falls short of Fri's 2.8172 high that would be considered the next reinforcing factor to a count calling that 2.8172 high the prospective end to the month-and-a-half 2nd-Wave correction.  In lieu of such, a resumption of the current rally to eventual new highs above 2.8172 should not surprise.

Economy - Popping the hood on Non Farm Payrolls Report

On the surface, this looks like an outstanding NFP Jobs Report.  But what concerns us, is the pace of growth in this data is slowing.  If you “pop the hood” on the Jobs data and it’s another year-over-year rate of change slowdown in NFP.  You’re reading this and thinking to yourself, what is he talking about?  Well this is what we’re talking about…

Rate of Change of Jobs Growth continues to decelerate….

UNEMPLOYMENT CONTINUED:

-Slowdown in people hired

-Slowdown in hours worked

These 2 components ultimately translate into slower production which is ultimately a major component of GDP growth. 

Market Reaction:

The Bond market gets it – 10yr yields are dropping this morning (again) to 1.58% - 30yr Bonds up over a full handle (+1’04) and the 10yr Notes trading up +14 points

Stocks: Russell 2000 (Small Caps) down -1.0% this morning; SP500 -0.45%; NASDAQ -0.58%

Gold: +5.50 to 1575.50

Our overall view of the US Economy is that we’re very late cycle.  The peak of the US growth cycle was Q3 2018 just prior to the market  massacre that took place in Q4 2018.  Our call is for US GDP rate of change growth is expected to continue to decelerate from here. 

Our suggested market positioning for a Growth Slowing/Inflation Slowing Environment:

Top “Longs”
Long US Treasuries
Long US Dollars (until the Fed signals more stimulus via rate cuts and repos)
Long Gold

If you have any questions or would like to discuss the markets further, please feel free to contact me at 800-669-5354 or jcaruso@rjofutures.com.

Coming Up Next Week...

View Futures Calendar