Attention New or Frustrated Traders:
Do you want to get into futures trading, but don’t have the time or knowledge necessary to do so? RJO Echo Trading is an intuitive way for investors or “echo followers” to automatically match the performance of veteran and accomplished traders. As an “Echo Follower” you will choose from a selection of vetted and experienced “Echo Leaders”, all you have to do is pay a subscription fee and your account will mimic the trades of your chosen “Leader”. Echo Trading eliminates the learning curve needed to trade futures, making it an option for all.
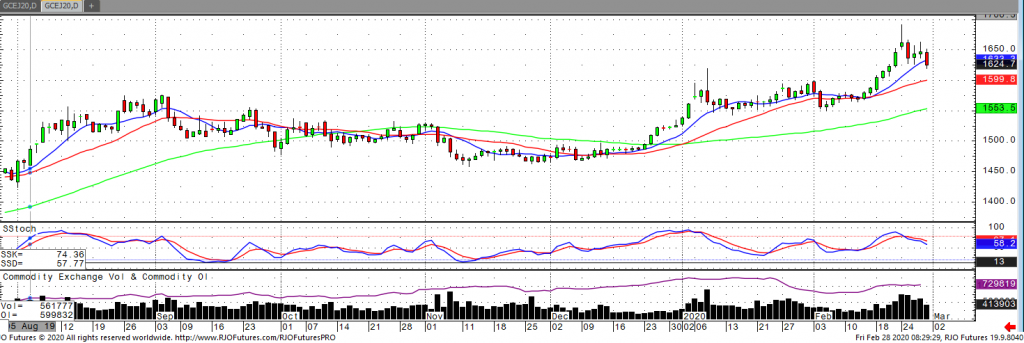
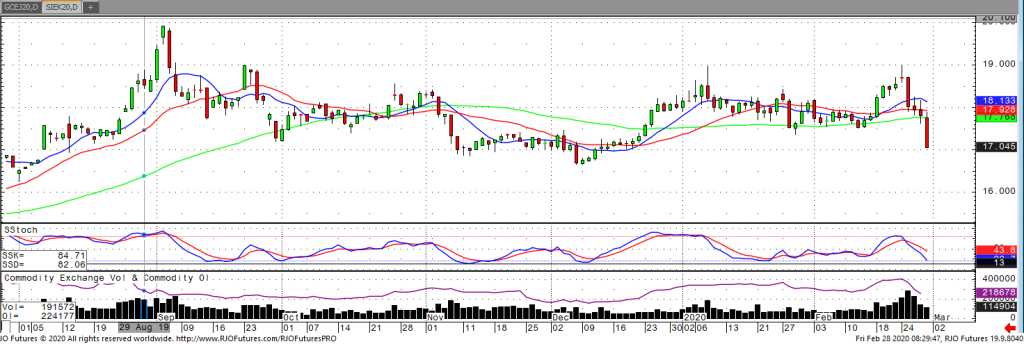
This week we saw a sharp slide lower in global equity markets amid growing concerns of a continued spread of the virus. Gold and silver pushed higher to start the week with the initial sell-off in stocks but with the spread of the coronavirus dominating headlines this week, we haven’t seen the safe haven flow to gold and silver as one would typically expect. We’ve also seen the dollar lose its attractiveness versus the other currencies which is a positive sign for those bullish metals. The longer it takes to contain the spread of the virus the more likely we will see global economic slowdown and this turn from a correction into a recession. Some are even estimating an impromptu rate cut by the Fed to try and lessen damage to the markets. April gold has mostly chopped sideways this week and is currently trading at $1,625. A break of the $1,600 level would reverse the trend to the downside with a push above $1,665 needed to give the market momentum to retest recent highs of $1,691 and then the $1,700 level. May silver hasn’t faired as well this week, trading through support at $17.50 and down to a low this morning of $17.05. On a break of support at $17.00 we would expect to see silver trade down to $16.65. Resistance in May silver comes in at $17.50 and $18.00.
Gold Apr '20 Daily ChartSilver May '20 Daily Chart If you have any questions or would like to discuss the markets further, please feel free to contact me at 800-826-2270 or therrmann@rjofutures.com. Energy - Oil Prices Plunge on Virus Fears
Oil Prices Plunge on Virus Fears
By: Alex Turro, Senior Market StrategistPosted Feb 28, 2020 9:29AM CT
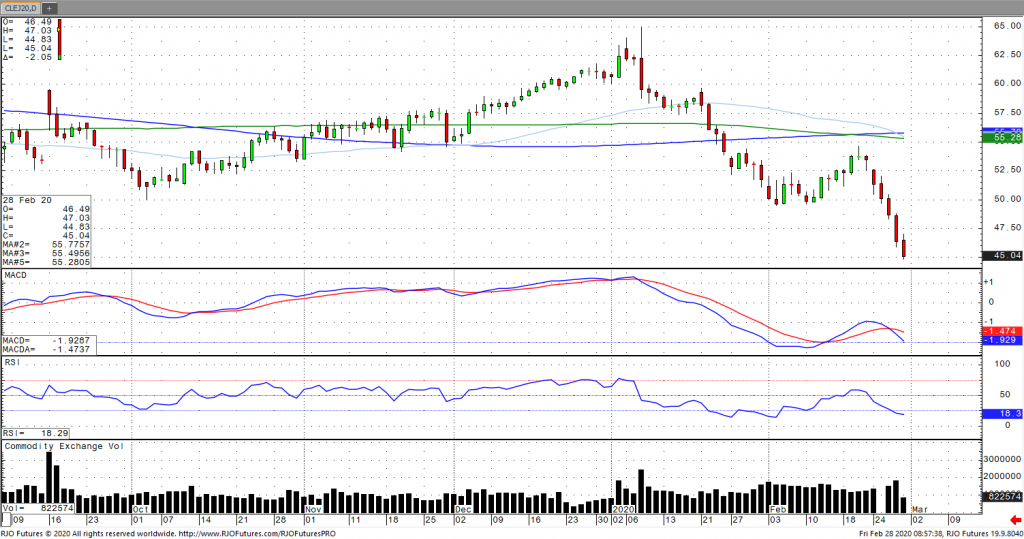
Oil prices have plunged to multiyear lows Friday and fell for the fifth consecutive session as an increasing number of new coronavirus cases outside of China have exacerbated concerns of a global economic slowdown and lower demand. WTI has declined over 10.4% through Thursday and is on pace for its lowest closing price since December 2018. With oil in a bear market, OPEC and Russia are set to meet in Vienna next week to assess further productions cuts following a meeting earlier this month where Russia previously opposed any action. The market remains bearish trend with today’s range seen between 44.76 – 51.46.
Crude Oil Apr '20 Daily Chart If you have any questions or would like to discuss the markets further, please feel free to contact me at 800-438-4805 or aturro@rjofutures.com. Softs - Cocoa, Coronavirus and Currencies
Cocoa, Coronavirus and Currencies
By: Peter MoosesPosted 02/27/2020
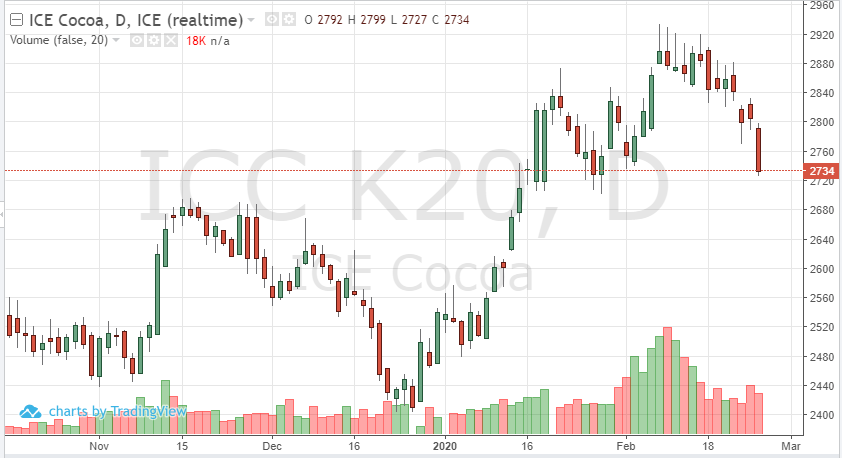
May cocoa futures continue to move lower as fear grows that the coronavirus outbreak could continue to get worse. Until a vaccine is in place, which could be six weeks away, the threat of a growing number of cases will continue. The virus could impact the demand of the soft in Europe and Asia. Grinding data will provide guidance as it is released.
In the short-term, the euro and pound have stayed strong, providing some support to prices. On Wednesday, the May contract found support at 2725. As news breaks, the technicals could be pushed to the side and have little impact on trading.
The
weather in West Africa will also be monitored, light rain is expected in the
near-term, but this may not affect prices if the accumulation remains minimal.
Traders will need to look at positions on a day-to-day basis since the future is unknown of how large the number of the coronavirus cases could get.
Softs - Coffee In Consolidation
Coffee In Consolidation
By: Adam TuiaanaPosted 02/26/2020
Extreme consolidation seems to be the story at this point in May coffee prices. For the last few trading sessions, May coffee (along with several other commodities) continues to fall short of garnering the much needed fresh “risk-on” traders need to sustain support prices. However, our friends at The Hightower Group have stated that “coffee continues to show more signs that a longer-term low may be in.”
In the wake of the coronavirus, commodities will
continue to flounder, and stocks will feel added pressure until the virus is
stabilized. This has had a major impact on dampening the ascension of markets
that would otherwise fundamentally (and seasonally) be trading higher. Before
May coffee can find solid support, traders are in dire need of good news regarding
China’s ability to stabilize the coronavirus so that more risk capital can make
its way to various commodity markets (including coffee). While U.S. stocks
continue to tumble, longs will need to lay low and wait.
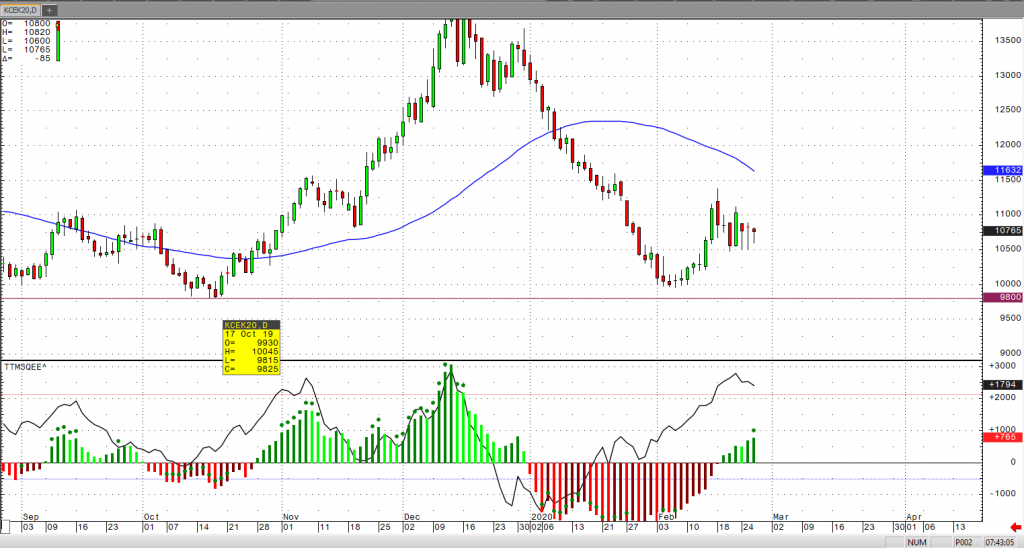
From a technical perspective, we have been able to hold support at the 9800 critical low from October of last year, with a subsequent strong bounce to the 11380 level. This price action should be viewed as a potential bottom in May coffee, but with the continued uncertainty related to the coronavirus, we should expect more sideways price action.
On
the heels of mid-Sep-to-early-Oct's steeper, accelerated, 3rd-wave-looking
recovery, the past week-and-a-half's boringly lateral chop is first considered
a corrective/consolidative event that warns of a continuation of the uptrend
that preceded it to new highs above 04-Oct's 891.0 high. This count
remains consistent with our broader base/correction/recovery count introduced
in 13-Sep's Technical Blog following that
day's bullish divergence in short-term momentum above 07-Sep's 809.5 minor
corrective high detailed in the hourly chart below.
The
important takeaway from this month's lateral, sleepy price action is the
definition of Wed's 851.5 low as
the end or lower boundary of a suspected 4th-Wave correction. A failure
below 851.5 will confirm a bearish divergence in daily momentum and defer or
threaten a bullish count enough to warrant non-bullish decisions like
long-covers. A failure below 851.5 will not
necessarily negate a broader bullish count, but it will threaten it enough to
warrant defensive measures as the next pertinent technical levels below 851.5 are
13-Sep's prospective minor 1st-Wave high at 813.8 and obviously 08-Sep's 766.0
low. And making non-bullish decisions "down there" is
sub-optimal to say the least. Per such, both short- and longer-term
commercial traders are advised to pare or neutralize bullish exposure on a
failure below 851.5, acknowledging and accepting whipsaw risk- back above 04-Oct's
891.0 high- in exchange for much deeper and sub-optimal nominal risk below
766.0.
On
a broader scale, the daily log scale chart above shows the developing potential
for a bearish divergence in daily momentum that will be considered confirmed
below 851.5. This chart also shows the past month's recovery thus far
stalling in the immediate neighborhood of the (888.0) Fibonacci
minimum 38.2% retrace of Apr-Sep's entire 1128 - 766 decline). COMBINED
with a failure below 851.5, traders
would then need to be concerned with at least a larger-degree correction pf the
past month's rally and possibly a resumption of Apr-Sep's major downtrend.
Until
and unless the market fails below 851.5 however, we would
remind longer-term players of the key elements on which our bullish count is
predicated:
a confirmed bullish divergence in WEEKLY momentum
(below)
amidst
an
historically low 11% reading in out RJO Bullish Sentiment Index and
a
textbook complete and major 5-wave Elliott sequence down from 29-Apr's
1128 high to 08-Sep's 766.0 low.
Thus
far, the market is only a month into correcting a 4-MONTH, 32% drawdown, so
further and possibly protracted gains remain well within the bounds of a major
(suspected 2nd-Wave) correction of Apr-Sep's decline within an even more
massive PEAK/reversal process from 17-May's 1219 high on an active continuation
basis below.
These
issues considered, a bullish policy and exposure remain advised with a failure
below 851.5 required to defer or threaten this call enough to warrant moving to
a neutral/sideline position. In lieu of such weakness, we anticipate a
continuation of the past month's rally to new highs and potentially significant
gains above 891.0.
Agricultural - Grain Futures Update w/Stephen Davis - 02/28/2020
Grain Futures Update w/Stephen Davis - 02/28/2020
By: Stephen DavisPosted 02/28/2020
Thursday the stock markets experienced their worst day since 2011 and the grain markets were no exception. With all markets down and seemingly to continue falling its hard to tell where they will go from here. Coronavirus has officially hit the futures markets.
Agricultural - No Sign of a Low in Corn, Fear Intesifies
No Sign of a Low in Corn, Fear Intesifies
By: Tony Cholly, Senior Market StrategistPosted Feb 28, 2020 9:35AM CT
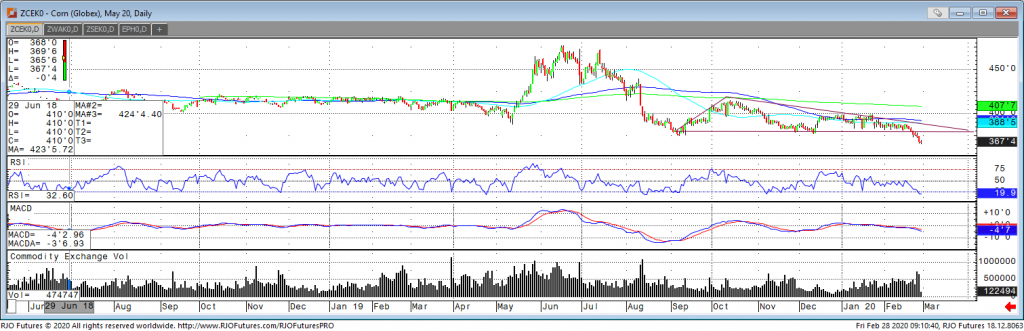
Corn prices continue to collapse and push lower on fears of higher US planted acreage, record lows in Brazilian currency and of course the expectations of even weaker demand from the energy sector. Contract lows were reached in yesterday’s trading session. Coronavirus concerns remain a source of pressure on the market, as people are growing concerned that China will not be able to meet its expected purchases of US ag products. Recent surveys are predicting that corn acreage will come in at 96.6 million acres this year, which is 7% more than last year. The Buenos Aires Grain Exchange increased their forecast for 2019/2020 argentine corn production from 49.0 to 50.0 million tonnes. The USDA projection was 50 million for the February update. Weekly export sales showed corn sales at 864,600 tonnes for the current marketing year. Resistance comes in at 371^6 and 376^6 with support at 364 and 361.
Corn May '20 Daily Chart If you have any questions or would like to discuss the markets further, please feel free to contact me at 800-826-2270 or tcholly@rjofutures.com. Currency - Dollar Down as Investors Await More QE
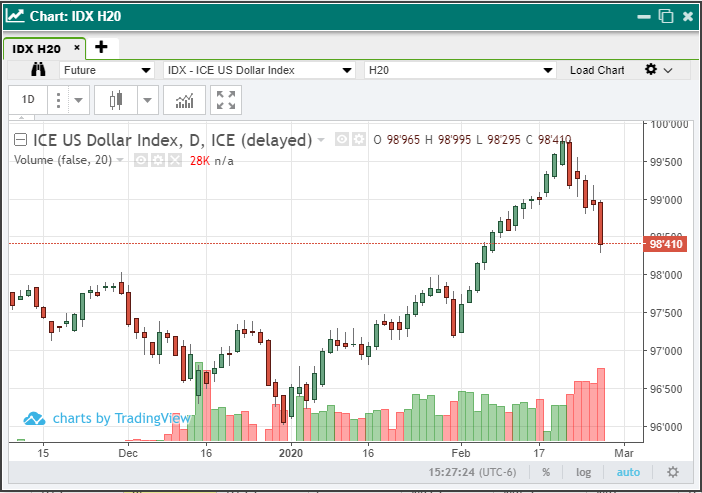
Dollar Down as Investors Await More QE
By: Ian BannonPosted 02/28/2020
U.S. Dollar futures dropped another 50 points during Thursday’s trade. This is the fifth consecutive session where the index has finished lower, which can be attributed to US yields making record lows this week and heightened hopes for more monetary easing from the Fed. The euro has begun a recovery move as the dollar sold off. After bouncing from the 1.08 level last week, euro futures are meeting resistance near the 1.10 level Thursday afternoon. The British pound remains rangebound. The pound trade has discounted positive economic data out of the UK, as the coronavirus situation clouds market headlines. Canadian dollars are weakening as this currency is typically a proxy for the energy markets. The Japanese yen is reversing last week’s beating as investors seek its safe-haven qualities. So, what comes next? The answer is most likely more QE. Odds of March rate cut at the FOMC meeting are now at 63%.
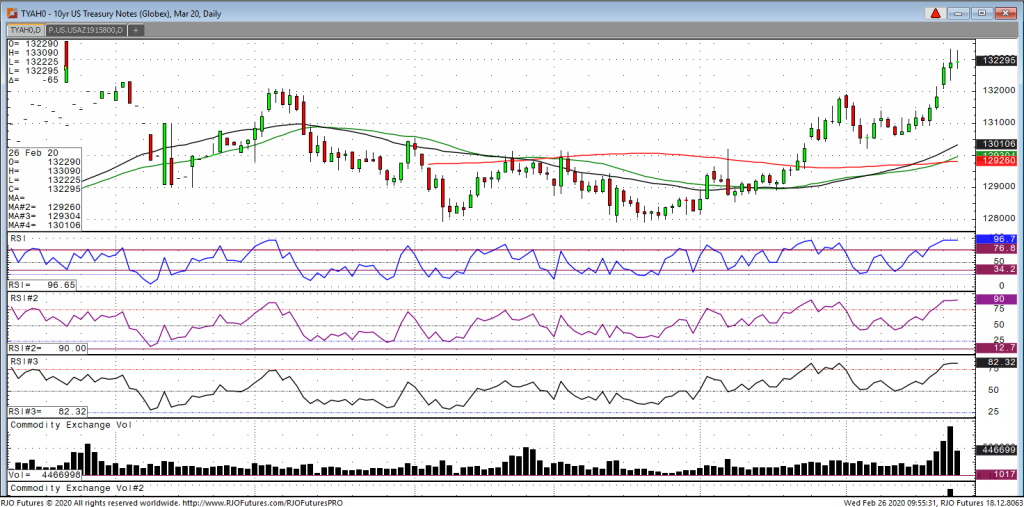
The 10-year note has exploded to the upside this week due to the spread of the coronavirus. The virus, which started in China, has since spread to every continent on the globe sans Antarctica. The result of this deadly disease has not only killed over 2800 people worldwide, but has also hurt many economies around the globe. Traders fear, that much like the disease, the slowing of economies will spread and eventually hit home in the U.S. The stock market, the Dow in particular, was down 2000 points in the last two days and that has fueled panic buying in the all the treasuries. As we look today, The S&P is currently up 46$ and is above the 100-day moving average. Due to all volatility, I cannot tell if the downdraft is complete in stocks, or we are seeing a short squeeze. I don’t believe the spreading of this deadly virus is done, but if many of the countries can contain it, the market will surely look at that as positive. If that happens, the treasuries will most likely come off their highs. Not much in the way of economic news today or the rest of the week so traders are advised to watch any headlines that come across the tape about the coronavirus.
10-Yr Note Mar '20 Daily Chart If you have any questions or would like to discuss the markets further, please feel free to contact me at 800-826-2270 or gperlin@rjofutures.com. Equity - Navigating the S&P "Falling Knife"
Navigating the S&P "Falling Knife"
By: RJO Market InsightsPosted 02/28/2020
Only a glance at the 240-min chart below is needed to see that the trend remains clearly down and that trying to buck this trend, or catch the proverbial "falling knife" is technically suicidal as there is no objective risk parameter to doing so. This short-term chart show the past few hours' continued slide leaving today's overnight high at 2981 in its wake as an admittedly very, very short-term corrective high that this market is minimally required to recover above to confirm a bullish divergence in short-term momentum. We would NOT be able to conclude the END of this month's mammoth meltdown from such a minute momentum failure. What we WOULD be able to do however is identify whatever low is left in the wake of that momentum failure as one of at least some reliability and importance from which non-bearish decisions like short-covers and cautious bullish punts could then be objectively based and managed. In lieu of such 2981+ strength, the trend remains down on all scales and should not surprise by its continuance or acceleration.
E-mini S&P 500 240 Min ChartEconomy - S-T Mo Failure Insufficient to End RBOB Correction, But Beware
S-T Mo Failure Insufficient to End RBOB Correction, But Beware
By: RJO Market InsightsPosted 11/08/2022
Posted on Nov 08, 2022, 07:51 by Dave Toth
In Fri's Technical Webcast we identified a
minor corrective low at 2.6328 from Thur as a mini risk parameter the market
needed to sustain gains above to maintain a more immediate bullish count.
The 240-min chart below shows the market's failure overnight below this level,
confirming a bearish divergence in very short-term momentum. This mo
failure defines Fri's 2.8172 high as
one of developing importance and a parameter from which very short-term traders
can objectively base non-bullish decisions like long-covers.
Given
the magnitude of the past three weeks' broader recovery however, this
short-term momentum failure is of an insufficient scale to conclude anything
more than another correction within this broader recovery from 26-Sep's 2.1877
low. Indeed, overnights failure below 2.6328 only allows us to conclude
the end of the portion of the month-and-a-half rally from 31-Oct's 2.4822 next
larger-degree corrective low. 2.4822 is the
risk parameter this market still needs to fail below to break the uptrend from
18-Oct's 2.3526 low while this 2.3526 low
remains intact as the risk parameter this market needs to fail below to break
the month-and-a-half uptrend. From an
intermediate-to-longer-term perspective, this week's setback falls well within
the bounds of another correction ahead of further gains. This is another
excellent example of the importance of technical and trading SCALE and
understanding and matching directional risk exposure to one's personal risk
profile.
The
reason overnight's admittedly minor mo failure might have longer-term
importance is the 2.8172-area from which it stemmed. In
Fri's Technical Blog we also noted the market's engagement of the
2.8076-to-2.8159-area marked by the 61.8% retrace of Jun0-Sewp's 3.2758 -2.1877
decline and the 1.000 progression of Sep-Oct's initial 2.1877 - 2.6185
(suspected a-Wave) rally from 18-Oct's 2.3526 (suspected b-Wave) low. We
remind longer-term players that because of the unique and compelling confluence
of:
early-Aug's bearish divergence in WEEKLY momentum
amidst
historically
extreme bullish sentiment/contrary opinion levels in our RJO Bullish
Sentiment Index
an
arguably complete and massive 5-wave Elliott sequence from Mar'20's 0.4605
low to Jun's 4.3260 high (as labeled in the weekly log active-continuation
chart below) and
the
5-wave impulsive sub-division of Jun-Sep's (suspected initial 1st-Wave) decline
The
recovery attempt from 26-Sep's 2.1877 low is arguably only a 3-wave (Wave-2)
corrective rebuttal to Jun-Sep's decline within a massive, multi-quarter
PEAK/reversal process. Now granted, due to the magnitude of 2020 -2022's
secular bull market, we discussed the prospect for this (2nd-Wave corrective)
recovery to be "extensive" in terms of both price and time. A
"more extensive" correction is typified by a retracement of 61.8% or
more and spanning weeks or even months following a 3-month decline. Per
such, the (suspected corrective) recovery from 26-Sep's 2.1877 low could easily
have further to go, with commensurately larger-degree weakness than that
exhibited this week (i.e., a failure below at least 2.4822) required
to consider the correction complete. Indeed, the daily log chart above
shows the market thus far respecting former 2.6185-area resistance from 10-Oct
as a new support candidate.
These
issues considered, very shorter-term traders have been advised to move to a neutral/sideline
position following overnight's momentum failure below 2.6328, with a recovery
above 2.8172 required to negate this call, reaffirm the recovery and re-expose
potentially significant gains thereafter. For intermediate- and
longer-term players, a bullish policy and exposure remain advised with a
failure below 2.4822 required to threaten this call enough to warrant
neutralizing exposure. We will be watchful for another bearish divergence
in momentum following a recovery attempt that falls short of Fri's 2.8172 high
that would be considered the next reinforcing factor to a count calling that
2.8172 high the prospective end to the month-and-a-half 2nd-Wave
correction. In lieu of such, a resumption of the current rally to
eventual new highs above 2.8172 should not surprise.