The difference between historical & implied volatility
How to spot regimes of high and low volatility
Which option strategies to apply and when
How to read price action to support your option trades
The Markets
Metals - Gold Bulls Are Very Disappointed, Should They Be?
Gold Bulls Are Very Disappointed, Should They Be?
By: Joshua GravesPosted 03/20/2020
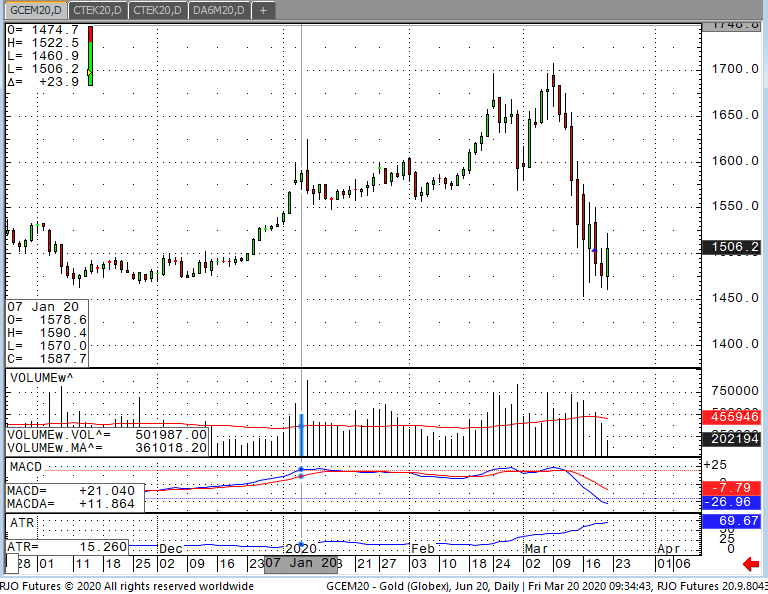
June Gold futures have been anything but a “safe haven” over the past month since the widespread outbreak of corona virus. I’ve heard every theory out there for why it’s not going up when there is an apocalypse going on in the equities. The most “rational” reason that I’ve heard and would to some extent agree with is the issue of clearing commodity and equity asset class exposure and meeting margin calls. Fleeing to cash in other words. I would expect that after the extreme volatility that equities and gold have had over the past few weeks is here to stay.
This presents the question to anyone reading this article of how to profit off these uncertain times in gold. Investors should consider the everyday swings that gold has had with some days being as much as $150 from top tick to bottom tick. On a 100oz futures contract this is quite a lot to say the least. Investors interested in the precious metal should also look at the smaller, 10, 33, and 50 oz futures contracts to manage the swings with smaller accounts. Gold to me has more of a perception of a haven rather than being one and this move proves it in my opinion. The DOW has had several 2000 point plus selloffs in a single day recently and gold dropped severely with it each time, and trended lower as we continued lower in the equities.
Gold June '20 Daily ChartMetals - Silver Ends a Historic Week
Silver Ends a Historic Week
By: Eli Tesfaye, Senior Market StrategistPosted Mar 20, 2020 10:41AM CT
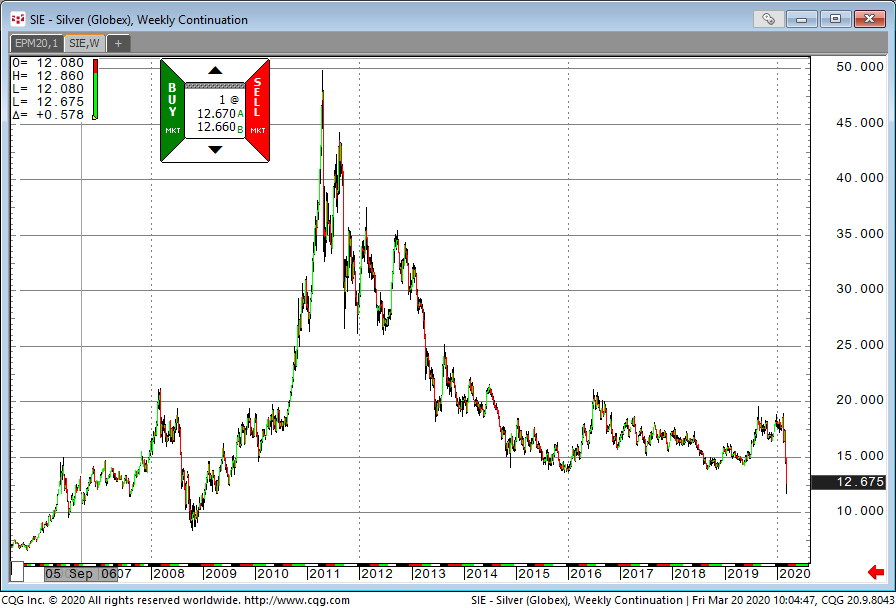
The gold/silver ratio hit all-time near-term high on March 18th at 124.18, but has since backed off a bit and is trading around 118.76. In otherwords, silver is getting a relief so to speak, relative to gold.
Silver made a historic 11-year contract low this week. So, in a nutshell, it has been a very strange week for silver. We haven’t see this type of price action since the week of Oct 2008 when it hit a low of $840. In my view, the price action suggesst that near term lows might not be in yet! Equities are being supported by the stimulus packages for coronavirus that the senate passed this week. A cure or some sort of vaccine could probably give markets additional boost. The chart damage on silver could take a little bit longer to improve.
From technical prosective, May silver broke out of the “inside day” chart. Support comes around 11.98 and the market is trying to break above 13.00. In my view, sideways to higher price action will proably be in order since silver is tracking the equity market. There is a general demand for commmodities acccross the board at this time.
Silver Weekly Chart If you have any questions or would like to discuss the markets further, please feel free to contact me at 800-367-7290 or etesfaye@rjofutures.com. Energy - Oil Rebounds From 18-Year Low
Oil Rebounds From 18-Year Low
By: Alex Turro, Senior Market StrategistPosted Mar 20, 2020 9:42AM CT
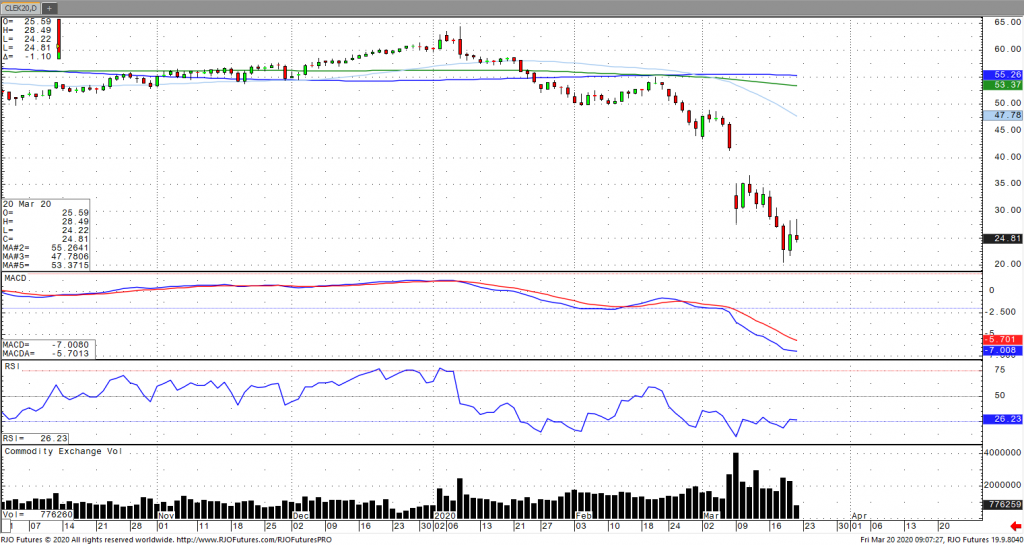
Oil prices are starting to come off their steep surge on Thursday following a 24.4% collapse on Wednesday as prices have been weighing supply and demand prospects. With demand forecasts slumping and tensions between Saudi Arabia and Russia escalating following the failed OPEC meeting in early March, prices have now slid nearly 60% this year. President Trump noted that the US could intervene in this ongoing price war, which contributed to yesterday’s gains. Meanwhile, OPEC production cuts are set to expire at the end of the month. Saudi’s Aramco has output at a record 12.3 million barrels over the coming months, however, both Saudi Arabia and Iraq cut rebates on freight costs, effectively lifting prices. Look to short bounces at/near top end of the range as the market remains bearish trend with today’s range seen between 21.29 – 30.34.
Crude Oil May '20 Daily Chart If you have any questions or would like to discuss the markets further, please feel free to contact me at 800-438-4805 or aturro@rjofutures.com. Agricultural - Bullish Canola Count Intact Above Minimum 851.5
Bullish Canola Count Intact Above Minimum 851.5
By: RJO Market InsightsPosted 10/14/2022
Posted on Oct 14, 2022, 07:42 by Dave Toth
On
the heels of mid-Sep-to-early-Oct's steeper, accelerated, 3rd-wave-looking
recovery, the past week-and-a-half's boringly lateral chop is first considered
a corrective/consolidative event that warns of a continuation of the uptrend
that preceded it to new highs above 04-Oct's 891.0 high. This count
remains consistent with our broader base/correction/recovery count introduced
in 13-Sep's Technical Blog following that
day's bullish divergence in short-term momentum above 07-Sep's 809.5 minor
corrective high detailed in the hourly chart below.
The
important takeaway from this month's lateral, sleepy price action is the
definition of Wed's 851.5 low as
the end or lower boundary of a suspected 4th-Wave correction. A failure
below 851.5 will confirm a bearish divergence in daily momentum and defer or
threaten a bullish count enough to warrant non-bullish decisions like
long-covers. A failure below 851.5 will not
necessarily negate a broader bullish count, but it will threaten it enough to
warrant defensive measures as the next pertinent technical levels below 851.5 are
13-Sep's prospective minor 1st-Wave high at 813.8 and obviously 08-Sep's 766.0
low. And making non-bullish decisions "down there" is
sub-optimal to say the least. Per such, both short- and longer-term
commercial traders are advised to pare or neutralize bullish exposure on a
failure below 851.5, acknowledging and accepting whipsaw risk- back above 04-Oct's
891.0 high- in exchange for much deeper and sub-optimal nominal risk below
766.0.
On
a broader scale, the daily log scale chart above shows the developing potential
for a bearish divergence in daily momentum that will be considered confirmed
below 851.5. This chart also shows the past month's recovery thus far
stalling in the immediate neighborhood of the (888.0) Fibonacci
minimum 38.2% retrace of Apr-Sep's entire 1128 - 766 decline). COMBINED
with a failure below 851.5, traders
would then need to be concerned with at least a larger-degree correction pf the
past month's rally and possibly a resumption of Apr-Sep's major downtrend.
Until
and unless the market fails below 851.5 however, we would
remind longer-term players of the key elements on which our bullish count is
predicated:
a confirmed bullish divergence in WEEKLY momentum
(below)
amidst
an
historically low 11% reading in out RJO Bullish Sentiment Index and
a
textbook complete and major 5-wave Elliott sequence down from 29-Apr's
1128 high to 08-Sep's 766.0 low.
Thus
far, the market is only a month into correcting a 4-MONTH, 32% drawdown, so
further and possibly protracted gains remain well within the bounds of a major
(suspected 2nd-Wave) correction of Apr-Sep's decline within an even more
massive PEAK/reversal process from 17-May's 1219 high on an active continuation
basis below.
These
issues considered, a bullish policy and exposure remain advised with a failure
below 851.5 required to defer or threaten this call enough to warrant moving to
a neutral/sideline position. In lieu of such weakness, we anticipate a
continuation of the past month's rally to new highs and potentially significant
gains above 891.0.
Agricultural - Grain Futures Update w/Stephen Davis - 03/20/2020
Grain Futures Update w/Stephen Davis - 03/20/2020
By: Stephen DavisPosted 03/20/2020
Stephen Davis makes his weekly commentary on the grain markets. There was a lot of volatility this week, and the direction of the grain markets is rather uncertainAgricultural - Live Cattle Market Hard to Nail Down
Live Cattle Market Hard to Nail Down
By: Peter McGinnPosted 03/20/2020
Along with the rest of the market,
meat markets have been exceptionally volatile this week. April cattle closed
300 points up off the limit yesterday as the market is responding to a surge
higher in beef prices over the past couple days. An interesting aspect of this
is that there is a surge in packer margins which is trying to fill the retail
pipeline which, for at least the short-term, is a bullish force. Beef supply is
high right now and add that to the fact that cattle weights are up in a time
when usually they are smaller, suggesting that this could be a sign that cattle
is already backing up in the country. We may see some temporary pops here in
the short-term, but I do not see any reason to stay long this market.
Average dressed steer weights for
the week ending March 7th came in at 903 pounds, up from 897 the previous week
and 871 a year ago. The 5-year average weekly weight for that week is 879.4.
This is a bearish development. The USDA boxed beef cutout was up $3.27 at
mid-session yesterday and closed $2.63 higher at $249.87. This was up from
$206.01 the previous week and $228.67 a year ago. This is the highest the
cutout has been since June 2017. U.S. beef export sales for the week ending
March 12 came in at 21,188 tonnes, up from 17,668 the previous week and the
highest since January 23. Cumulative sales for 2020 have reached 337,282
tonnes, up 17% from last year's pace and the highest on record going back to at
least 2002. The largest buyers this week were South Korea at 7,343 tonnes, followed
by Japan at 4,007, Canada at 2,675 and Taiwan at 2,348. China bought 8 tonnes
after buying 694 tonnes the previous week. The countries with the largest
commitments for 2020 are Japan at 100,146 tonnes (roughly 30% of all U.S.
sales), South Korea at 81,159, and Hong Kong at 47,901.
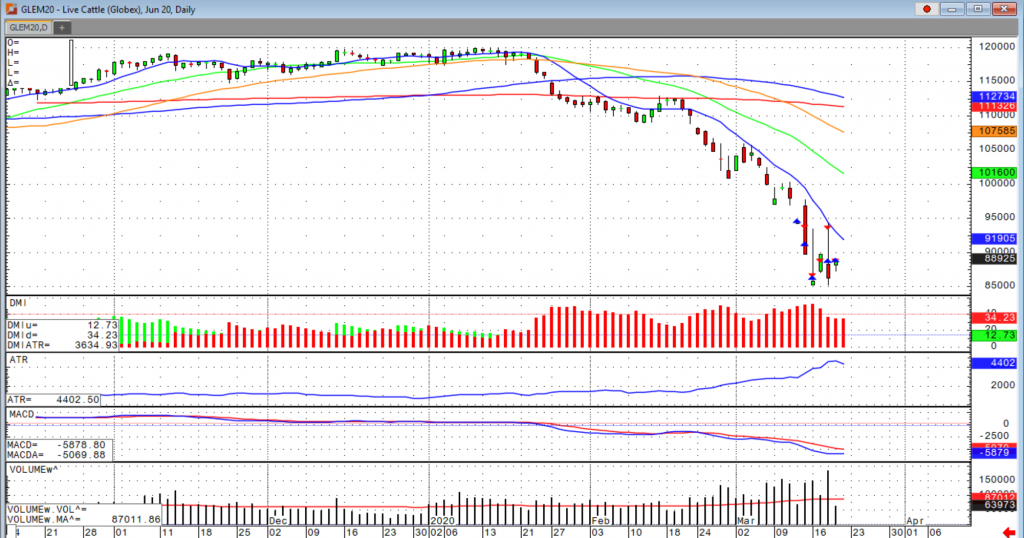
The USDA estimated cattle slaughter came in at 115,000 head yesterday. This brings the total for the week so far to 474,000 head, down from 485,000 last week and down from 480,000 a year ago. For the cattle on feed report, traders see placements for the month of February at just 92.4% of last year with a range of 89.0-97.1. Marketings for February are expected at 105.6% of last year. This would leave On Feed supply for March 1 at 100.3% of last year (range 99.7-101).
Live Cattle Jun '20 Daily ChartEconomy - S-T Mo Failure Insufficient to End RBOB Correction, But Beware
S-T Mo Failure Insufficient to End RBOB Correction, But Beware
By: RJO Market InsightsPosted 11/08/2022
Posted on Nov 08, 2022, 07:51 by Dave Toth
In Fri's Technical Webcast we identified a
minor corrective low at 2.6328 from Thur as a mini risk parameter the market
needed to sustain gains above to maintain a more immediate bullish count.
The 240-min chart below shows the market's failure overnight below this level,
confirming a bearish divergence in very short-term momentum. This mo
failure defines Fri's 2.8172 high as
one of developing importance and a parameter from which very short-term traders
can objectively base non-bullish decisions like long-covers.
Given
the magnitude of the past three weeks' broader recovery however, this
short-term momentum failure is of an insufficient scale to conclude anything
more than another correction within this broader recovery from 26-Sep's 2.1877
low. Indeed, overnights failure below 2.6328 only allows us to conclude
the end of the portion of the month-and-a-half rally from 31-Oct's 2.4822 next
larger-degree corrective low. 2.4822 is the
risk parameter this market still needs to fail below to break the uptrend from
18-Oct's 2.3526 low while this 2.3526 low
remains intact as the risk parameter this market needs to fail below to break
the month-and-a-half uptrend. From an
intermediate-to-longer-term perspective, this week's setback falls well within
the bounds of another correction ahead of further gains. This is another
excellent example of the importance of technical and trading SCALE and
understanding and matching directional risk exposure to one's personal risk
profile.
The
reason overnight's admittedly minor mo failure might have longer-term
importance is the 2.8172-area from which it stemmed. In
Fri's Technical Blog we also noted the market's engagement of the
2.8076-to-2.8159-area marked by the 61.8% retrace of Jun0-Sewp's 3.2758 -2.1877
decline and the 1.000 progression of Sep-Oct's initial 2.1877 - 2.6185
(suspected a-Wave) rally from 18-Oct's 2.3526 (suspected b-Wave) low. We
remind longer-term players that because of the unique and compelling confluence
of:
early-Aug's bearish divergence in WEEKLY momentum
amidst
historically
extreme bullish sentiment/contrary opinion levels in our RJO Bullish
Sentiment Index
an
arguably complete and massive 5-wave Elliott sequence from Mar'20's 0.4605
low to Jun's 4.3260 high (as labeled in the weekly log active-continuation
chart below) and
the
5-wave impulsive sub-division of Jun-Sep's (suspected initial 1st-Wave) decline
The
recovery attempt from 26-Sep's 2.1877 low is arguably only a 3-wave (Wave-2)
corrective rebuttal to Jun-Sep's decline within a massive, multi-quarter
PEAK/reversal process. Now granted, due to the magnitude of 2020 -2022's
secular bull market, we discussed the prospect for this (2nd-Wave corrective)
recovery to be "extensive" in terms of both price and time. A
"more extensive" correction is typified by a retracement of 61.8% or
more and spanning weeks or even months following a 3-month decline. Per
such, the (suspected corrective) recovery from 26-Sep's 2.1877 low could easily
have further to go, with commensurately larger-degree weakness than that
exhibited this week (i.e., a failure below at least 2.4822) required
to consider the correction complete. Indeed, the daily log chart above
shows the market thus far respecting former 2.6185-area resistance from 10-Oct
as a new support candidate.
These
issues considered, very shorter-term traders have been advised to move to a neutral/sideline
position following overnight's momentum failure below 2.6328, with a recovery
above 2.8172 required to negate this call, reaffirm the recovery and re-expose
potentially significant gains thereafter. For intermediate- and
longer-term players, a bullish policy and exposure remain advised with a
failure below 2.4822 required to threaten this call enough to warrant
neutralizing exposure. We will be watchful for another bearish divergence
in momentum following a recovery attempt that falls short of Fri's 2.8172 high
that would be considered the next reinforcing factor to a count calling that
2.8172 high the prospective end to the month-and-a-half 2nd-Wave
correction. In lieu of such, a resumption of the current rally to
eventual new highs above 2.8172 should not surprise.
Economy - Jobless Claims Skyrocket to 4-Year High
Jobless Claims Skyrocket to 4-Year High
By: John Caruso, Senior Market StrategistPosted Mar 20, 2020 9:28AM CT
Shots fired yesterday in the jobless market. U.S. jobless claims rose 70K to a 4yr high of 281K. This data could grow 10/20 fold in oncoming weeks and that’s not an exaggeration. Be engaged with our ranges, because bounces in stocks/commodities that are listed as “bearish trend” are likely to fail and be shorting opportunities. However, we do think energy is buyable in this environment from the low end of the range (yes we know its bearish trend), BUT we definitely see swing trading opportunities in crude from the these multi DECADE levels.
Stocks- Look for possible sell opportunities off bounces, preferably at the top of the range. VIX has come off the highs to 68.00 and yields are backing off again this morning. This could give stocks a few days of “bounce” , but they will likely be opportunities to catch the next leg lower.
Oil- we said it up top, good swing trade opportunities from multi-decade lows. Manage the range and keep an ear the ground for rumblings out of OPEC
Metals- I do think there could potentially be another wave of selling that hits the metals – but we think it’ll likely be the LAST. Tremendous upside in metals, but may shake out one more time. Dollar devaluation is likely at some point as markets quell the fear and attempt to recover – this is your gold/silver catalyst to watch for. 1400-1558 Gold and 11.53-14.07 in Silver
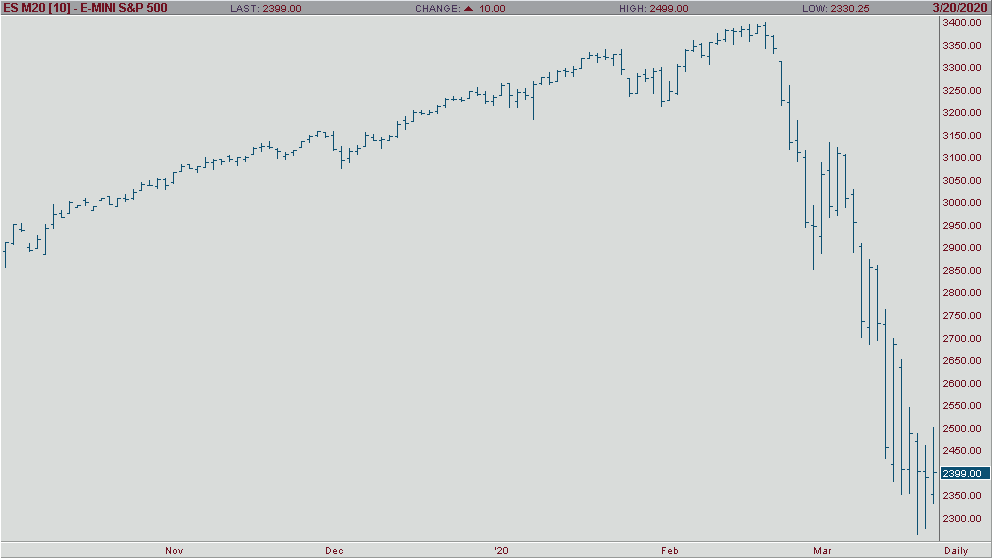
E-mini S&P 500 Jun '20 Daily Chart If you have any questions or would like to discuss the markets further, please feel free to contact me at 800-669-5354 or jcaruso@rjofutures.com.