Metals - Will Gold Continue to Act as a Safe-Haven Trade?
Will Gold Continue to Act as a Safe-Haven Trade?
By: Nicholas DeGeorgePosted 03/27/2020
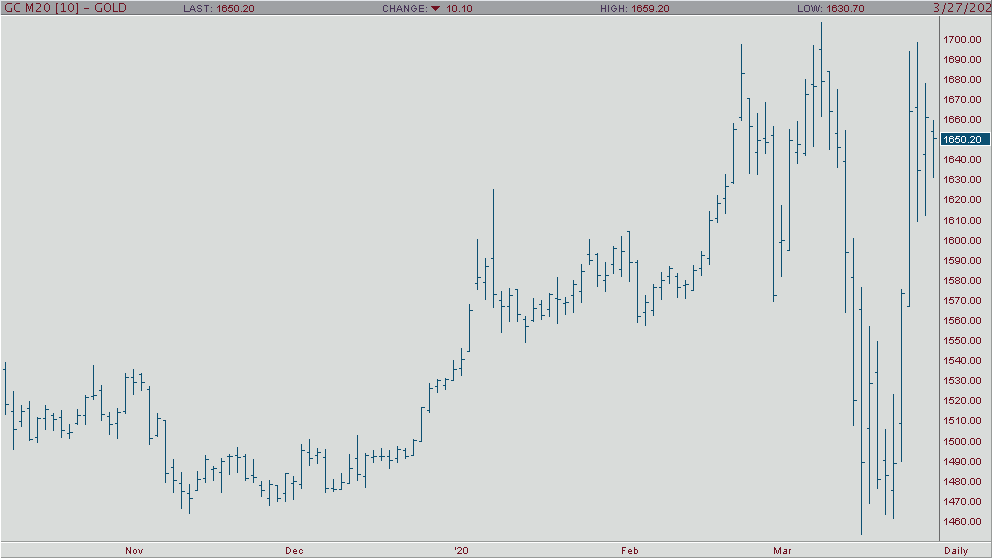
In the early morning trade, gold has pulled back even more from its weekly highs of $1,698.0 and is currently trading at $1,635.0 a troy ounce. June gold has been in the negative for the whole overnight trading session as investors will have to decide with global cases rising overnight along with the U.S. passing China (if you believe them) and Italy in total cases of the virus if it’s going to continue to be a safe-haven trade/investment, which is being fueled by anxiety. After being in the red all week, the U.S. dollar is finally in the green, which might cause gold to trade around these levels, but with the $2.2 trillion-dollar relief bill expected to pass the House today we might see a reversal of these two markets. When the bill passes, you would think eventually gold would continue this rally on fears of inflation down the road and it would be valuable to note that even with the shiny one pulling back from its highs that gold is still on track for its biggest weekly gains since the subprime crisis. Furthermore, you would expect the greenback to sell-off due to the largest stimulus package in U.S. history.
I usually say let’s look at the daily gold chart, but this is NOT a technically driven market currently. However, let ‘keep it simple and note that this week’s low is $1,608, which could act as support, and if it breaks the $1,700 an ounce levels, hold onto your longs and enjoy the ride!
Gold Jun '20 Daily ChartEnergy - Oil Demand Continues to Capitulate
Oil Demand Continues to Capitulate
By: Alex Turro, Senior Market StrategistPosted Mar 27, 2020 10:12AM CT
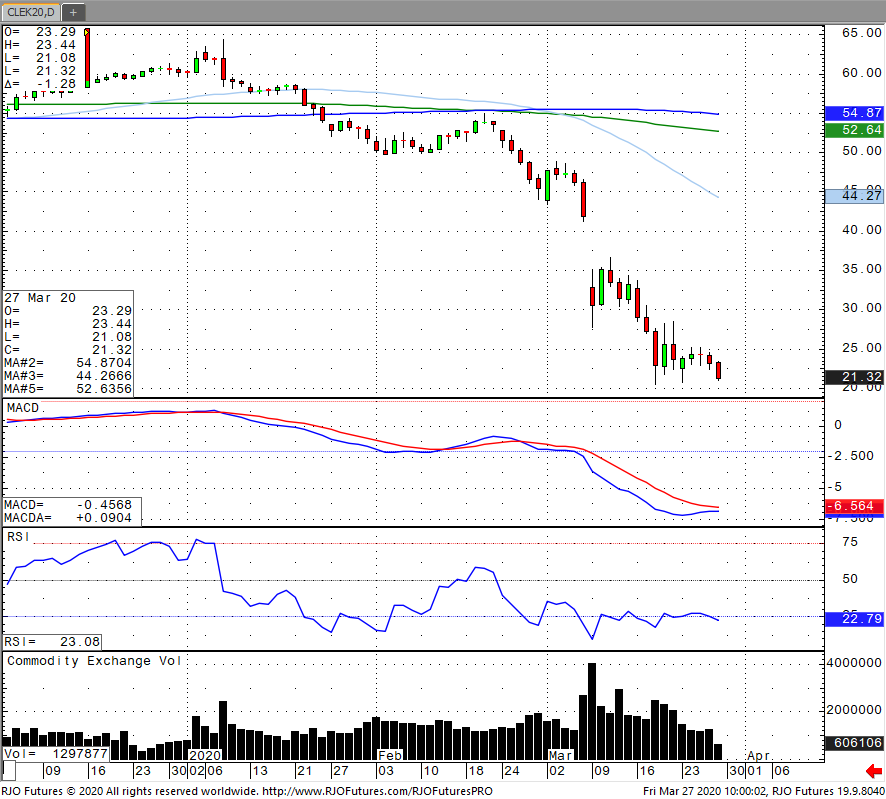
Oil fell below $22 in the early session as global demand concerns continue to proliferate due to the corona pandemic, pressuring producers and refiners and comes as the market weighs the potential benefits of stimulus efforts. Global oil demand could fall upwards of 20 million bpd in April further deepening from an expected plunge of 10.5 million bpd in March, which would far overwhelm any supply response. Earlier in the week, the US Energy Department had to rescind offers to buy from shale producers, which would have targeted small to mid-size producers. Storages are starting to fill with inland tanks for heating oil in Germany are full with Pakistan banning oil imports on Thursday. The market remains bearish trend with today’s range seen between 19.59 – 25.39.
Crude Oil Jun '20 Daily Chart If you have any questions or would like to discuss the markets further, please feel free to contact me at 800-438-4805 or aturro@rjofutures.com. Softs - Cocoa Futures Follow Global Equity Markets
Cocoa Futures Follow Global Equity Markets
By: Peter MoosesPosted 03/26/2020
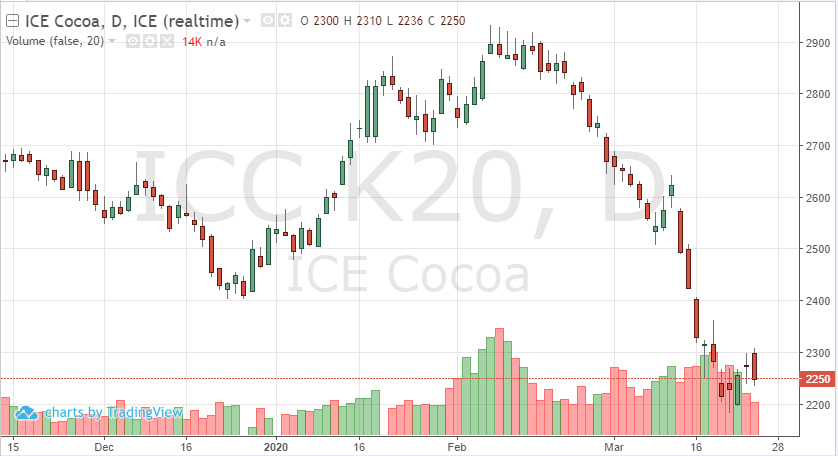
Cocoa futures have been weakened by demand and the global equity markets. As the U.S. and European markets moved higher for back to back sessions for the first time since February, cocoa tried to bounce off a potential bottom in the May contract. Global restrictions and stoppage of work in key regions for cocoa have added to the pressure the market has been feeling. An uncertainty of when certain restrictions will be lifted should cause volatility in the coming weeks. The safety and health of the world is the main concern of everyone and recovery in the markets will occur when limits are lifted at the proper time. For cocoa specifically, any disruption to cocoa operations and exports will affect prices in the short-term. As with all commodities, the supply chain is key right now.
From a technical standpoint, 2300 is resistance, while 2250 is short-term support. Prices that we saw at the end of February should be back once the coronavirus is under control and numbers plateau but in the meantime, the soft markets are weak and vulnerable.
Cocoa May '20 Daily ChartSofts - Impressive Rally in May Coffee
Impressive Rally in May Coffee
By: Adam TuiaanaPosted 03/25/2020
Coffee prices have firmed up on a massive rally,
primarily based on tighter supplies in Brazil, and issues related to a lack of
shipping containers. Our friends at The
Hightower Group have reported of that the “situation
may not be resolved soon as several major producers are seeing current supply
bottlenecks.”
We continue to see unprecedented levels of volatility
as the world struggles to cope with weighing the very realistic free fall of
each economy versus that of risking the health of our citizens. Commodities
will continue to find unstable ground as the underlying fundamentals bear
little (if any) impact on the overall price action we continue to witness these
days.
From a technical perspective, the 130 level in May coffee prices should provide strong resistance, and I would expect to see some long liquidation in the short term. This rally and strong price action should be viewed as a potential reversal to the upside in May coffee, but with the continued uncertainty related to the Coronavirus, we should expect a short-term selloff.
On
the heels of mid-Sep-to-early-Oct's steeper, accelerated, 3rd-wave-looking
recovery, the past week-and-a-half's boringly lateral chop is first considered
a corrective/consolidative event that warns of a continuation of the uptrend
that preceded it to new highs above 04-Oct's 891.0 high. This count
remains consistent with our broader base/correction/recovery count introduced
in 13-Sep's Technical Blog following that
day's bullish divergence in short-term momentum above 07-Sep's 809.5 minor
corrective high detailed in the hourly chart below.
The
important takeaway from this month's lateral, sleepy price action is the
definition of Wed's 851.5 low as
the end or lower boundary of a suspected 4th-Wave correction. A failure
below 851.5 will confirm a bearish divergence in daily momentum and defer or
threaten a bullish count enough to warrant non-bullish decisions like
long-covers. A failure below 851.5 will not
necessarily negate a broader bullish count, but it will threaten it enough to
warrant defensive measures as the next pertinent technical levels below 851.5 are
13-Sep's prospective minor 1st-Wave high at 813.8 and obviously 08-Sep's 766.0
low. And making non-bullish decisions "down there" is
sub-optimal to say the least. Per such, both short- and longer-term
commercial traders are advised to pare or neutralize bullish exposure on a
failure below 851.5, acknowledging and accepting whipsaw risk- back above 04-Oct's
891.0 high- in exchange for much deeper and sub-optimal nominal risk below
766.0.
On
a broader scale, the daily log scale chart above shows the developing potential
for a bearish divergence in daily momentum that will be considered confirmed
below 851.5. This chart also shows the past month's recovery thus far
stalling in the immediate neighborhood of the (888.0) Fibonacci
minimum 38.2% retrace of Apr-Sep's entire 1128 - 766 decline). COMBINED
with a failure below 851.5, traders
would then need to be concerned with at least a larger-degree correction pf the
past month's rally and possibly a resumption of Apr-Sep's major downtrend.
Until
and unless the market fails below 851.5 however, we would
remind longer-term players of the key elements on which our bullish count is
predicated:
a confirmed bullish divergence in WEEKLY momentum
(below)
amidst
an
historically low 11% reading in out RJO Bullish Sentiment Index and
a
textbook complete and major 5-wave Elliott sequence down from 29-Apr's
1128 high to 08-Sep's 766.0 low.
Thus
far, the market is only a month into correcting a 4-MONTH, 32% drawdown, so
further and possibly protracted gains remain well within the bounds of a major
(suspected 2nd-Wave) correction of Apr-Sep's decline within an even more
massive PEAK/reversal process from 17-May's 1219 high on an active continuation
basis below.
These
issues considered, a bullish policy and exposure remain advised with a failure
below 851.5 required to defer or threaten this call enough to warrant moving to
a neutral/sideline position. In lieu of such weakness, we anticipate a
continuation of the past month's rally to new highs and potentially significant
gains above 891.0.
Agricultural - Grain Futures Update w/Stephen Davis - 03/27/2020
Grain Futures Update w/Stephen Davis - 03/27/2020
By: Stephen DavisPosted 03/27/2020
Stephen Davis discusses the latest movements in the grain markets. According to reports, russia may cancel their wheat exports, which could prop up the market. Unfortuantely now, the only certainty is uncertainty
Agricultural - Soybean Demand Remains Strong
Soybean Demand Remains Strong
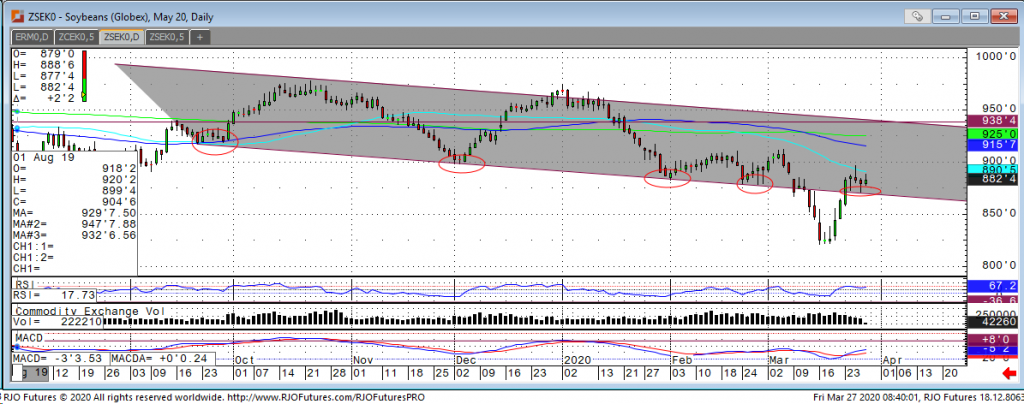
By: Tony Cholly, Senior Market StrategistPosted Mar 27, 2020 8:53AM CT
The short-term trend is up, from a technical point of view and the world seems to be getting more comfortable with the idea of owning more stocks of grain then normal. Also, Chinese demand seems to be picking up as the global economy may not be as bad as originally feared. Any logistical problems out of South America will be considered bullish, as well as any weather premium starting to get priced in to the market for planting season. Domestic U.S. soybean meal demand remains strong, with the number of chicks placed for the week reaching a new record last week which will keep short term live stock feed demand on the stronger side. The technical action for the meal market has been very impressive of late, with a 5-day surge that took prices to highest levels since October. Support for the Soybeans comes in at 873 and 866 with resistance at 886 and 892.
Soybeans May '20 Daily Chart If you have any questions or would like to discuss the markets further, please feel free to contact me at 800-826-2270 or tcholly@rjofutures.com. Currency - Wild Ride for Currencies
Wild Ride for Currencies
By: Ian BannonPosted 03/27/2020
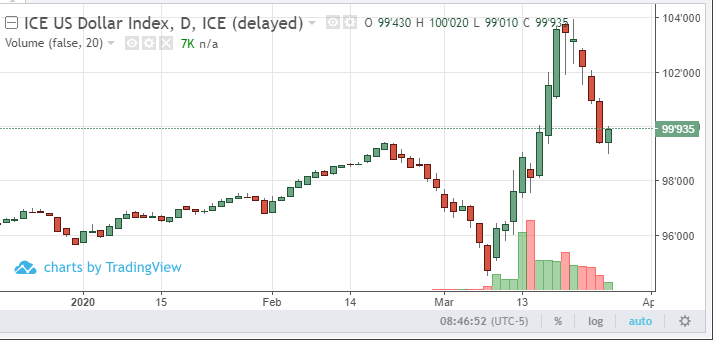
U.S. dollar futures reached a multi-year high at 103.96 early this week before a linear landslide down to the 99 level on Friday, then bouncing 88 points off the low. The greenback is on pace for its worst weekly decline since 2009. More practically, unprecedented global circumstances have led to extreme levels that have now given way to more reasonable numbers. Foreign currency futures have not been immune to severe volatility as well. To effectively trade these markets, an investor must keep tabs on central bank policy. The worldwide rate-cutting and quantitative easing theme is now in full-force. Loosening monetary policy works to weaken the domestic currency, so the currency that will become relatively stronger will likely be that of the country that does the least amount of economic stimulus. Given the “unlimited QE” coming from the Fed, the dollar is likely to succeed in the game of currency debasement. In other words, a weaker dollar is on the longer-term radar, even if the USD wants to retest its recent high due to safe-haven inflows if panic-selling grips the markets again.
USD Jun '20 Daily ChartEquity - Stock Rally Fizzles as Week Draws to a Close
Stock Rally Fizzles as Week Draws to a Close
By: Bill Dixon, Senior Market StrategistPosted Mar 27, 2020 8:18AM CT
It appears the V-shaped recovery we were witnessing over the
last few days is taking a bit of a break. Coronavirus news continues to roll in.
There’s been some positive news, some negative news, and a whole lot of
hysterics. Of note, it was reported earlier that British PM Boris Johnson has
tested positive. He says that his case is mild, and that he’ll continue to
fulfill his duties via video conferencing while in quarantine. There’s enough
news out there to feed whatever narrative you prefer. However, it’s times like
these where I think it’s important to take it all in and realize that the truth
likely lies somewhere in the middle. There are a decent number of unknowns out
there, there will be one off cases, but we seem to have a pretty good grasp as
to who is most at risk. Be safe out there.
The other big story continues to be our government’s
inability to come together and get a bill passed. We’ve been hearing things like
it’s on the two-yard line and that passage is imminent for days now. One would
think that given the circumstances we would be able to get to the heart of the
matter and argue politics later. That’s evidently too much to ask for as we’re
still arguing over pork spending, completely unrelated political agendas being
slipped into the bill, etc.
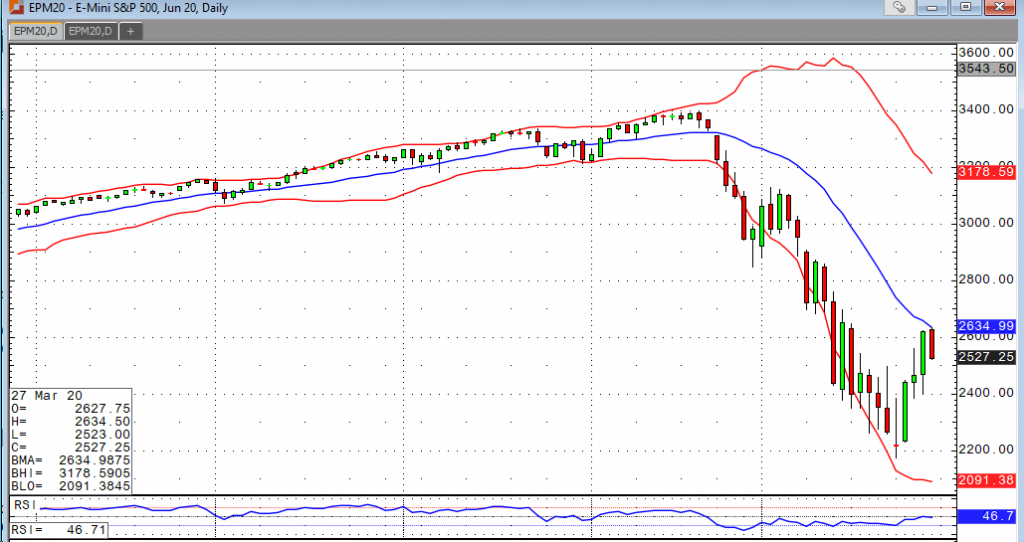
The stock indices are taking it on the chin this morning, with the Dow futures down about 700 or about 3% heading into the open. I expect some choppy to lower trade as we see some profit taking heading into the weekend along with continued uncertainty about the bill. The rally has been wonderful to quell some of the panic, but I do believe the discouragement phase is likely to come. Whether or not that results in a new low remains to be seen, but I expect it will result in a tremendous buying opportunity at some point.
E-mini S&P 500 Jun '20 Daily Chart
If you have any questions or would like to discuss the markets further, please feel free to contact me at 800-669-5354 or bdixon@rjofutures.com. Economy - S-T Mo Failure Insufficient to End RBOB Correction, But Beware
S-T Mo Failure Insufficient to End RBOB Correction, But Beware
By: RJO Market InsightsPosted 11/08/2022
Posted on Nov 08, 2022, 07:51 by Dave Toth
In Fri's Technical Webcast we identified a
minor corrective low at 2.6328 from Thur as a mini risk parameter the market
needed to sustain gains above to maintain a more immediate bullish count.
The 240-min chart below shows the market's failure overnight below this level,
confirming a bearish divergence in very short-term momentum. This mo
failure defines Fri's 2.8172 high as
one of developing importance and a parameter from which very short-term traders
can objectively base non-bullish decisions like long-covers.
Given
the magnitude of the past three weeks' broader recovery however, this
short-term momentum failure is of an insufficient scale to conclude anything
more than another correction within this broader recovery from 26-Sep's 2.1877
low. Indeed, overnights failure below 2.6328 only allows us to conclude
the end of the portion of the month-and-a-half rally from 31-Oct's 2.4822 next
larger-degree corrective low. 2.4822 is the
risk parameter this market still needs to fail below to break the uptrend from
18-Oct's 2.3526 low while this 2.3526 low
remains intact as the risk parameter this market needs to fail below to break
the month-and-a-half uptrend. From an
intermediate-to-longer-term perspective, this week's setback falls well within
the bounds of another correction ahead of further gains. This is another
excellent example of the importance of technical and trading SCALE and
understanding and matching directional risk exposure to one's personal risk
profile.
The
reason overnight's admittedly minor mo failure might have longer-term
importance is the 2.8172-area from which it stemmed. In
Fri's Technical Blog we also noted the market's engagement of the
2.8076-to-2.8159-area marked by the 61.8% retrace of Jun0-Sewp's 3.2758 -2.1877
decline and the 1.000 progression of Sep-Oct's initial 2.1877 - 2.6185
(suspected a-Wave) rally from 18-Oct's 2.3526 (suspected b-Wave) low. We
remind longer-term players that because of the unique and compelling confluence
of:
early-Aug's bearish divergence in WEEKLY momentum
amidst
historically
extreme bullish sentiment/contrary opinion levels in our RJO Bullish
Sentiment Index
an
arguably complete and massive 5-wave Elliott sequence from Mar'20's 0.4605
low to Jun's 4.3260 high (as labeled in the weekly log active-continuation
chart below) and
the
5-wave impulsive sub-division of Jun-Sep's (suspected initial 1st-Wave) decline
The
recovery attempt from 26-Sep's 2.1877 low is arguably only a 3-wave (Wave-2)
corrective rebuttal to Jun-Sep's decline within a massive, multi-quarter
PEAK/reversal process. Now granted, due to the magnitude of 2020 -2022's
secular bull market, we discussed the prospect for this (2nd-Wave corrective)
recovery to be "extensive" in terms of both price and time. A
"more extensive" correction is typified by a retracement of 61.8% or
more and spanning weeks or even months following a 3-month decline. Per
such, the (suspected corrective) recovery from 26-Sep's 2.1877 low could easily
have further to go, with commensurately larger-degree weakness than that
exhibited this week (i.e., a failure below at least 2.4822) required
to consider the correction complete. Indeed, the daily log chart above
shows the market thus far respecting former 2.6185-area resistance from 10-Oct
as a new support candidate.
These
issues considered, very shorter-term traders have been advised to move to a neutral/sideline
position following overnight's momentum failure below 2.6328, with a recovery
above 2.8172 required to negate this call, reaffirm the recovery and re-expose
potentially significant gains thereafter. For intermediate- and
longer-term players, a bullish policy and exposure remain advised with a
failure below 2.4822 required to threaten this call enough to warrant
neutralizing exposure. We will be watchful for another bearish divergence
in momentum following a recovery attempt that falls short of Fri's 2.8172 high
that would be considered the next reinforcing factor to a count calling that
2.8172 high the prospective end to the month-and-a-half 2nd-Wave
correction. In lieu of such, a resumption of the current rally to
eventual new highs above 2.8172 should not surprise.