Experience a trading platform like no other with integrated tools to seamlessly trade and monitor the markets. With a free simulated trading account and personal broker experience, we’ll teach you about futures trading and help you develop a trading strategy.
The Markets
Metals - June Gold Needs to Break $1700
June Gold Needs to Break $1700
By: Joshua GravesPosted 04/03/2020
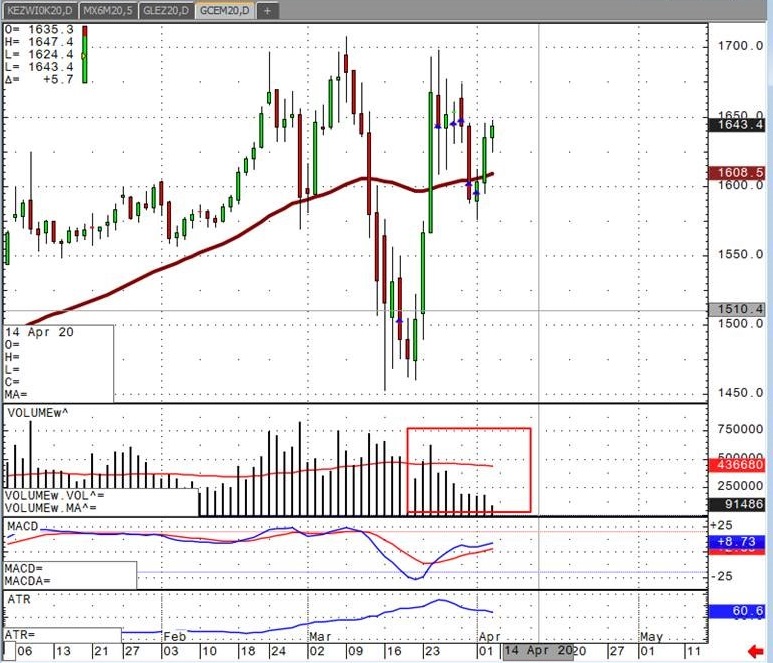
June gold has had just about every reason in the world to bust above $1700 and stay there for good. If we look at the fundamentals of why we might be seeing a rally, take your pick of the most recent horrendous economic data. We should have seen a flight to the supposed “safe haven.” Massive job losses, massive unemployment claims, all levels we have never seen before. It’s a broken market in my opinion. There are clearly other factors driving the gold sell-off. I’ve looked at the reasons to be bullish and the reasons to be bearish, and yet gold is for the most part sideways, but volatile. I think traders at this point need to stop asking the question I get asked the most, “why is gold going down when stocks are crashing?” My answer is simple, because markets can remain irrational longer than you and I can remain solvent. People just want out, clearing the books and going to cash it makes sense.
Traders need to take the fundamental playbook and throw it out the window in this volatile environment where headlines and rumors drive massive intraday swings for no good reason. The most important thing I see in gold is the lack of volume over the past week. Average volume traded in June gold futures is 436,000 contracts. We have traded less than half of that every day. This tells me that any move needs to be taken with a grain of salt. Don’t bet the farm on a big move up or down without big volume trending higher behind it. A classic head and shoulders pattern is clearly shown on a daily chart, and right now gold needs to take out the highs over $1700 for me to get bullish firmly. If you would like strategies made for gold trading with limited risk, contact me directly.
Gold Jun '20 Daily ChartMetals - Silver Caught in Limbo
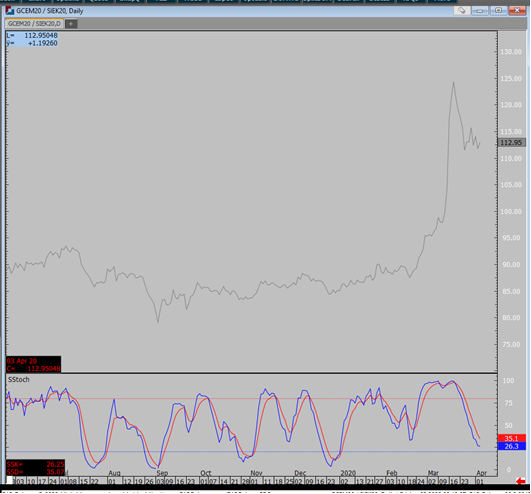
Silver rejected downside pressure and is trying to hold above $14.00 in the May contract. After the gold/silver ratio hit a staggering high in March, silver has started April well, relative to gold. Like most markets, silver is caught in the middle of demand/recession cycle. I don’t anticipate a huge run up in price but I do think that some technical levels could trigger an extended short term rally. For the futures, at least for the May contract, a high $14.98 needed to see low $17.00 Silver. On the other hand, a shift in global recession sentiment could trigger another wave of selling that could pressure silver below $12.00. In my view, the sooner we can get a resolution or phase type of return to work for most sectors, the sooner you see price of Silver stabilizing. It has been very interesting how each country is dealing with coronavirus, I’m sensing that more and more countries are taking drastic efforts for better outcome. Stay healthy stay safe.
Silver will be in sideways price action for the most part, if you like to learn to trade around it, reach out to me.
Silver May '20 Daily Chart If you have any questions or would like to discuss the markets further, please feel free to contact me at 800-367-7290 or etesfaye@rjofutures.com. Energy - Oil Reduction Not Enough to Offset Demand Loss
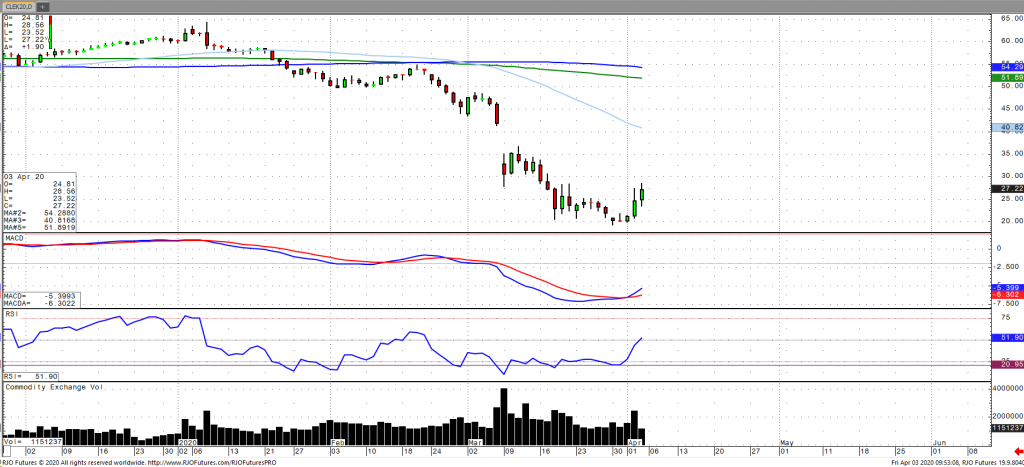
Oil prices have continued to surge as the market weighs a significant shift in supply fundamentals as producers discuss a global output reduction of 10 million barrels a day. A video conference is expected on Monday that will be open to all producers, notwithstanding OPEC and its allies. Despite this attempt in stabilization, the demand destruction from the fallout of the coronavirus casts a shadow on the oil sector. Russian producers have said to be on board, however, without concerted output reduction from the U.S. as well, efforts may not be enough as initial estimates are a reduction in daily demand of 35 million barrels. Global demand storage remains elevated with U.S. pipeline operators asking drillers to curtail production as stores get close to capacity. Ultimately, despite cuts as a near term catalyst oil may need eventual production shutdowns to establish a longer-term floor. Oil volatility (OVX) remains highly elevated at 160 with the market remaining bearish trend with today’s range seen between 18.68 – 27.34.
Crude Oil May '20 Daily Chart If you have any questions or would like to discuss the markets further, please feel free to contact me at 800-438-4805 or aturro@rjofutures.com. Softs - Is Coffee Losing Steam?
Is Coffee Losing Steam?
By: Eric ScolesPosted 04/01/2020
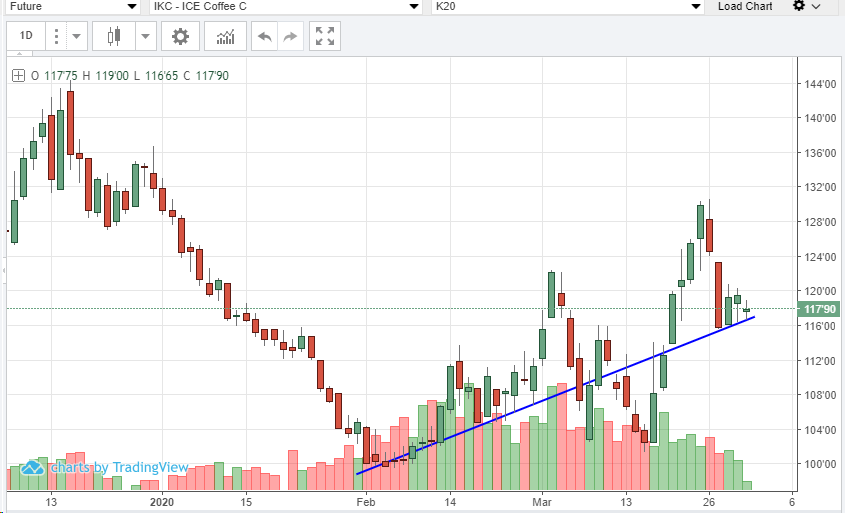
May ’20 coffee futures start the day positive but still in consolidation this week with what appears to be decreasing volume. In the near-term coffee should remain fairly-well supported and even a bit bullish with tightening stocks as logistics and labor issues limit the flow of high quality coffee. There is further support in that end users are likely purchasing more than enough to make sure they can meet demand and keep the shelves stocked. But does this market have enough energy to continue-on to higher prices? I would need to see May coffee prices rally and hold above 124’50 before I call it bullish over all. In the long term it’s expected that major producers will create an abundance of supply for the 20/21 year assuming production and transportation remains reasonably functional with the viral outbreak impacting all facets of the global economy.
On
the heels of mid-Sep-to-early-Oct's steeper, accelerated, 3rd-wave-looking
recovery, the past week-and-a-half's boringly lateral chop is first considered
a corrective/consolidative event that warns of a continuation of the uptrend
that preceded it to new highs above 04-Oct's 891.0 high. This count
remains consistent with our broader base/correction/recovery count introduced
in 13-Sep's Technical Blog following that
day's bullish divergence in short-term momentum above 07-Sep's 809.5 minor
corrective high detailed in the hourly chart below.
The
important takeaway from this month's lateral, sleepy price action is the
definition of Wed's 851.5 low as
the end or lower boundary of a suspected 4th-Wave correction. A failure
below 851.5 will confirm a bearish divergence in daily momentum and defer or
threaten a bullish count enough to warrant non-bullish decisions like
long-covers. A failure below 851.5 will not
necessarily negate a broader bullish count, but it will threaten it enough to
warrant defensive measures as the next pertinent technical levels below 851.5 are
13-Sep's prospective minor 1st-Wave high at 813.8 and obviously 08-Sep's 766.0
low. And making non-bullish decisions "down there" is
sub-optimal to say the least. Per such, both short- and longer-term
commercial traders are advised to pare or neutralize bullish exposure on a
failure below 851.5, acknowledging and accepting whipsaw risk- back above 04-Oct's
891.0 high- in exchange for much deeper and sub-optimal nominal risk below
766.0.
On
a broader scale, the daily log scale chart above shows the developing potential
for a bearish divergence in daily momentum that will be considered confirmed
below 851.5. This chart also shows the past month's recovery thus far
stalling in the immediate neighborhood of the (888.0) Fibonacci
minimum 38.2% retrace of Apr-Sep's entire 1128 - 766 decline). COMBINED
with a failure below 851.5, traders
would then need to be concerned with at least a larger-degree correction pf the
past month's rally and possibly a resumption of Apr-Sep's major downtrend.
Until
and unless the market fails below 851.5 however, we would
remind longer-term players of the key elements on which our bullish count is
predicated:
a confirmed bullish divergence in WEEKLY momentum
(below)
amidst
an
historically low 11% reading in out RJO Bullish Sentiment Index and
a
textbook complete and major 5-wave Elliott sequence down from 29-Apr's
1128 high to 08-Sep's 766.0 low.
Thus
far, the market is only a month into correcting a 4-MONTH, 32% drawdown, so
further and possibly protracted gains remain well within the bounds of a major
(suspected 2nd-Wave) correction of Apr-Sep's decline within an even more
massive PEAK/reversal process from 17-May's 1219 high on an active continuation
basis below.
These
issues considered, a bullish policy and exposure remain advised with a failure
below 851.5 required to defer or threaten this call enough to warrant moving to
a neutral/sideline position. In lieu of such weakness, we anticipate a
continuation of the past month's rally to new highs and potentially significant
gains above 891.0.
Agricultural - Grain Futures Update w/Stephen Davis - 04/03/2020
Grain Futures Update w/Stephen Davis - 04/03/2020
By: Stephen DavisPosted 04/03/2020
Stephen Davis discusses the latest trends in the grain markets, including how Thursday's move in crude oil could potentially prop up the corn market.Agricultural - More Volatility in the Live Cattle Market
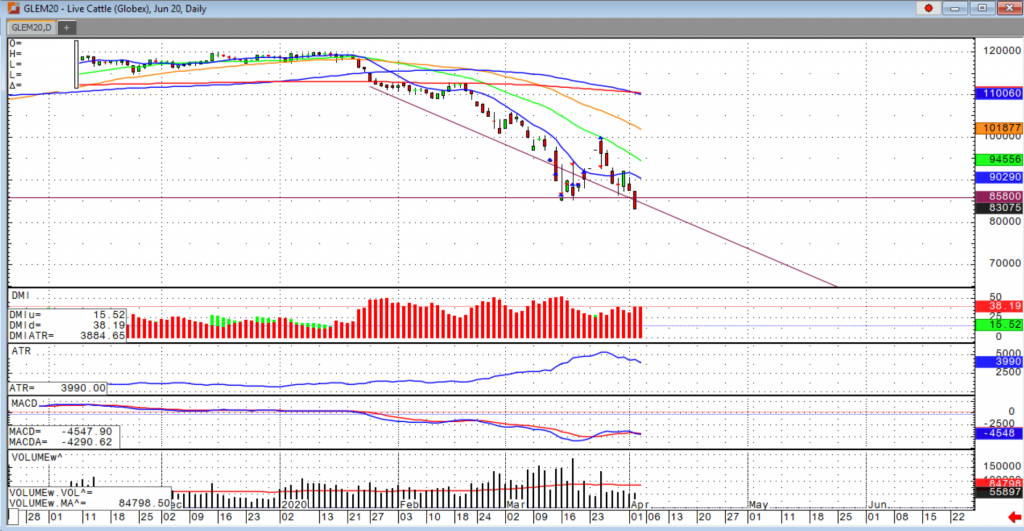
More Volatility in the Live Cattle Market
By: Peter McGinnPosted 04/03/2020
Meat markets had a wild ride in the futures market, and we could see a steep break in prices which would hurt packer margins and further slow the pace of slaughter. Weights are rising sharply along with a concern in a slowdown in production is adding more selling pressure to the market. A few developing stories coming from the packing industry are; there is growing concern and possible talks of strike from the meat packing union about working in the current conditions do to the COVID-19 pandemic, and a report that came out just yesterday (feedstuffs.com) about how Chuck Grassley (R-Iowa) wrote a congressional letter to AG Barr and Agricultural Secretary Sonny Purdue about how there is cause for concern about market manipulation of beef prices. Since Feb. 4, 2020, live cattle prices are down 16%. This is happening even while American consumers bought 77% more meat during the week of March 15 compared to the same week of 2019, Grassley said in his letter. Further, the four largest meat packing companies control approximately 80% of beef processing in the U.S.
However, if one or both of these two scenarios play out, I
don’t see this ending well for cattle producers. If the union ends up going on
strike, we could see an even bigger build up in supply not only for the near
term but also for months to come going out until the 4th quarter.
The concern for COVID-19 has even spread to South America as some Brazilian
mayors have shut down aspects of their agricultural production.
According to msnmoney.com:
“In Brazil, a union nearly
succeeded in shutting down two JBS SA chicken facilities by convincing a judge
that the health risks were too great. In the U.S., chicken giant Perdue Farms
is trying to appease workers after two dozen employees at a 600-person plant in
Kathleen, Georgia, staged a walkout. The first meat processing employee to test
positive for coronavirus in the U.S. also materialized Monday, at a Sanderson
Farms Inc. plant.”
I don’t expect the volatility to slow down anytime soon, as
it is the same with the hog market. The big discount from the futures to the
cash market is typically a supportive force but with these sharp moves recently
and the fears of a massive April supply is giving us this short-term selling
pressure. I would stay short if you are able to, but buying some upside
protection with calls is probably the most risk-adverse trade right now for
these markets.
The USDA boxed beef cutout was down $7.30 at mid-session
yesterday and closed $7.98 lower at $235.17. The cutout has fallen $15 in five
sessions after climbing $43 in the nine previous sessions. Like other markets,
the beef cutout is experiencing extreme volatility. Yesterday, cash live cattle
traded $8-$9 lower from the end of last week in moderate volume. In Kansas,
2,155 head traded at $112-$113 with an average price of $112.15, down from
$119.53 a week ago.
In Nebraska, 91 head traded at $111.25 versus an average price of $119.49 a week ago. In Texas/Oklahoma, 975 head traded at $112-$113 and an average price of $112.43, versus $119.27 a week ago. June cattle opened sharply lower on the session and closed down the 450-point limit yesterday. The USDA estimated cattle slaughter came in at 116,000 head yesterday. This brings the total for the week so far to 352,000 head, down from 361,000 last week at this time and down from 362,000 a year ago.
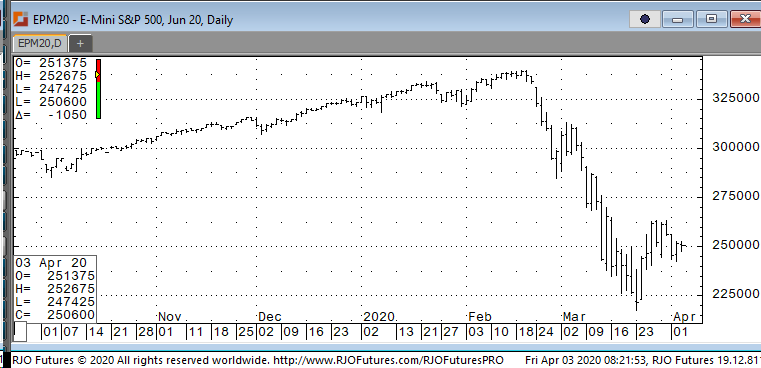
Live Cattle Jun '20 Daily ChartEquity - Oil and Jobs Don't Mix
Stock futures are
down this morning with a huge decline in jobs for the month of March, but that
number was muted by the historical rally in the crude market. According to the
U.S. government, March unemployment was 4.4% with payrolls falling over 700,000
making it the worst report since 2009. These numbers are not telling you the whole
story of the devastation from the coronavirus as jobless claims increased by
6.6 million last week, which is a record according to the Labor Department.
Keeping the stock
market from further collapsing was crude oil’s rally on Thursday. West Texas intermediate
increased by 24% making it the best day in history. Despite the record gain,
crude remains over 50% lower on the year. The rise in crude was attributed to
President Trump’s claim that oil production would be facing major cuts and
Saudi Arabia called for an emergency meeting of OPEC and other producers.
Support today is 246000 and again below at 239000 while support is showing 256000 and 259000.
E-mini S&P 500 Jun '20 Daily Chart If you have any questions or would like to discuss the markets further, please feel free to contact me at 888-861-1656 or jyasak@rjofutures.com. Economy - S-T Mo Failure Insufficient to End RBOB Correction, But Beware
S-T Mo Failure Insufficient to End RBOB Correction, But Beware
By: RJO Market InsightsPosted 11/08/2022
Posted on Nov 08, 2022, 07:51 by Dave Toth
In Fri's Technical Webcast we identified a
minor corrective low at 2.6328 from Thur as a mini risk parameter the market
needed to sustain gains above to maintain a more immediate bullish count.
The 240-min chart below shows the market's failure overnight below this level,
confirming a bearish divergence in very short-term momentum. This mo
failure defines Fri's 2.8172 high as
one of developing importance and a parameter from which very short-term traders
can objectively base non-bullish decisions like long-covers.
Given
the magnitude of the past three weeks' broader recovery however, this
short-term momentum failure is of an insufficient scale to conclude anything
more than another correction within this broader recovery from 26-Sep's 2.1877
low. Indeed, overnights failure below 2.6328 only allows us to conclude
the end of the portion of the month-and-a-half rally from 31-Oct's 2.4822 next
larger-degree corrective low. 2.4822 is the
risk parameter this market still needs to fail below to break the uptrend from
18-Oct's 2.3526 low while this 2.3526 low
remains intact as the risk parameter this market needs to fail below to break
the month-and-a-half uptrend. From an
intermediate-to-longer-term perspective, this week's setback falls well within
the bounds of another correction ahead of further gains. This is another
excellent example of the importance of technical and trading SCALE and
understanding and matching directional risk exposure to one's personal risk
profile.
The
reason overnight's admittedly minor mo failure might have longer-term
importance is the 2.8172-area from which it stemmed. In
Fri's Technical Blog we also noted the market's engagement of the
2.8076-to-2.8159-area marked by the 61.8% retrace of Jun0-Sewp's 3.2758 -2.1877
decline and the 1.000 progression of Sep-Oct's initial 2.1877 - 2.6185
(suspected a-Wave) rally from 18-Oct's 2.3526 (suspected b-Wave) low. We
remind longer-term players that because of the unique and compelling confluence
of:
early-Aug's bearish divergence in WEEKLY momentum
amidst
historically
extreme bullish sentiment/contrary opinion levels in our RJO Bullish
Sentiment Index
an
arguably complete and massive 5-wave Elliott sequence from Mar'20's 0.4605
low to Jun's 4.3260 high (as labeled in the weekly log active-continuation
chart below) and
the
5-wave impulsive sub-division of Jun-Sep's (suspected initial 1st-Wave) decline
The
recovery attempt from 26-Sep's 2.1877 low is arguably only a 3-wave (Wave-2)
corrective rebuttal to Jun-Sep's decline within a massive, multi-quarter
PEAK/reversal process. Now granted, due to the magnitude of 2020 -2022's
secular bull market, we discussed the prospect for this (2nd-Wave corrective)
recovery to be "extensive" in terms of both price and time. A
"more extensive" correction is typified by a retracement of 61.8% or
more and spanning weeks or even months following a 3-month decline. Per
such, the (suspected corrective) recovery from 26-Sep's 2.1877 low could easily
have further to go, with commensurately larger-degree weakness than that
exhibited this week (i.e., a failure below at least 2.4822) required
to consider the correction complete. Indeed, the daily log chart above
shows the market thus far respecting former 2.6185-area resistance from 10-Oct
as a new support candidate.
These
issues considered, very shorter-term traders have been advised to move to a neutral/sideline
position following overnight's momentum failure below 2.6328, with a recovery
above 2.8172 required to negate this call, reaffirm the recovery and re-expose
potentially significant gains thereafter. For intermediate- and
longer-term players, a bullish policy and exposure remain advised with a
failure below 2.4822 required to threaten this call enough to warrant
neutralizing exposure. We will be watchful for another bearish divergence
in momentum following a recovery attempt that falls short of Fri's 2.8172 high
that would be considered the next reinforcing factor to a count calling that
2.8172 high the prospective end to the month-and-a-half 2nd-Wave
correction. In lieu of such, a resumption of the current rally to
eventual new highs above 2.8172 should not surprise.
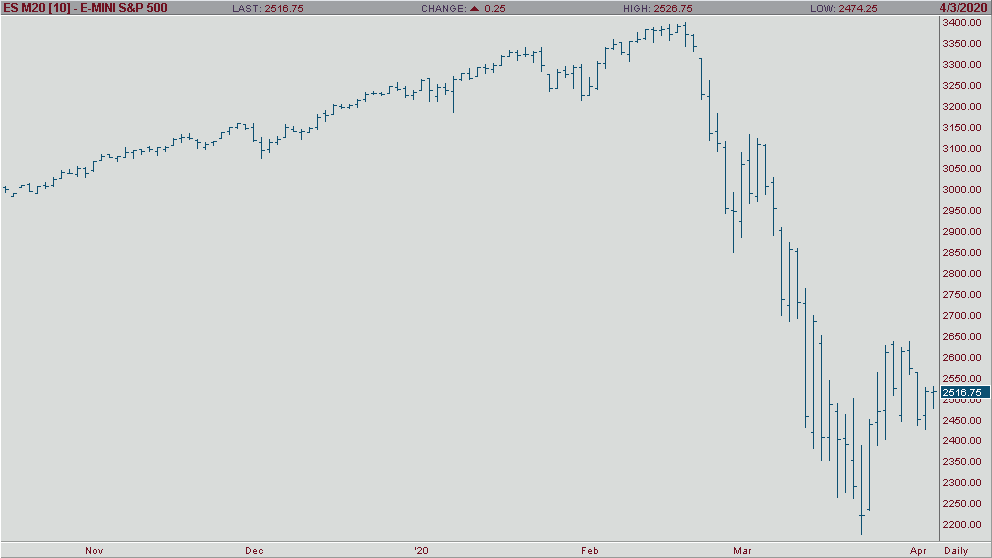
Pres Trump is calling for a 10M-15M Barrel cut – why not make it 25M!! LOL. You knew this was coming, he said it was coming last week actually in his daily press briefings. This will also be the case in stocks as well – President Trump will take to twitter and go ALL CAPS and get a nice pump out of the market. Regardless, we’ll keep managing the range of the market and stick to our process. Speaking of which, this is a nice bounce in crude to the top of our range, I’ll likely take a short position today. Super wide range of 18.70-27.40 (probably higher now as I write this) and a nasty 162 on the oil volatility (OVX). A 35% rally makes this a big fat juicy sell.
Stocks and Volatility – falling vol in the equity space, I highly doubt that this is the “transition” back into stocks. Implied vol in the SP500 is back to a big fat lazy number of -44% vs 30 realized vol. Downside in the SP500 approximately 11% lower to 2230 this morning.
Unemployment- we don’t really need the data to know
what’s happening in the world. -701K Unemployment with a 4.4% rate (this
will likely be north of 10% soon – ugh!) – just not good, sad actually.
We’ve got work to do, so I’ll keep it tight this morning. All the Best.
E-mini S&P 500 Jun '20 Daily Chart If you have any questions or would like to discuss the markets further, please feel free to contact me at 800-669-5354 or jcaruso@rjofutures.com.