Basic technical analysis and trading strategy applicable to these markets
The Markets
Metals - Bulls In Charge of Gold
Bulls In Charge of Gold
By: Nicholas DeGeorgePosted 04/24/2020
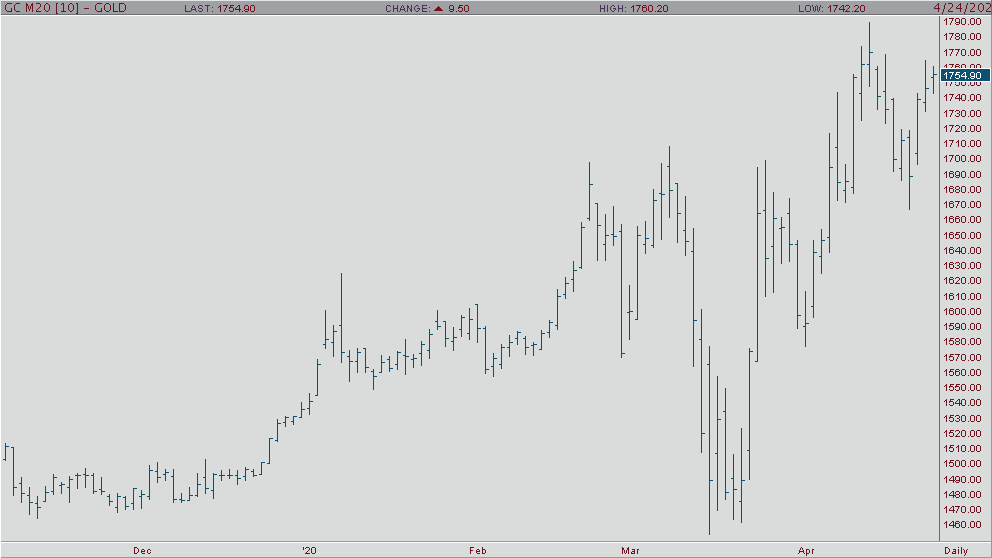
In the early morning trade, June gold is trading in the green slightly and currently trading at $1,752 a troy ounce. Gold is going to have to face a little adversity over the next couple of trading days with the U.S. dollar making fresh new weekly highs overnight and with the world’s largest import country of gold on nation-wide lockdown with their second largest buying day of the year coming up this Sunday and will surely impact physical demand. However, the House just passed the $484B stimulus package for small businesses and if they start talking about another stimulus, which they very well could after the next non-farm monthly payroll number is released, then this should cause the shiny one to forge new highs and possibly even makes it way to the $2,000 an ounce handle.
If we take a look at the daily June gold chart, you’ll clearly see the gold bulls came in and bought gold off the $1,660s support level on is now back above $1,700 trading in a bullish trend clearly giving them back the advantage.
Gold Jun '20 Daily ChartMetals - Silver May Face Pressure
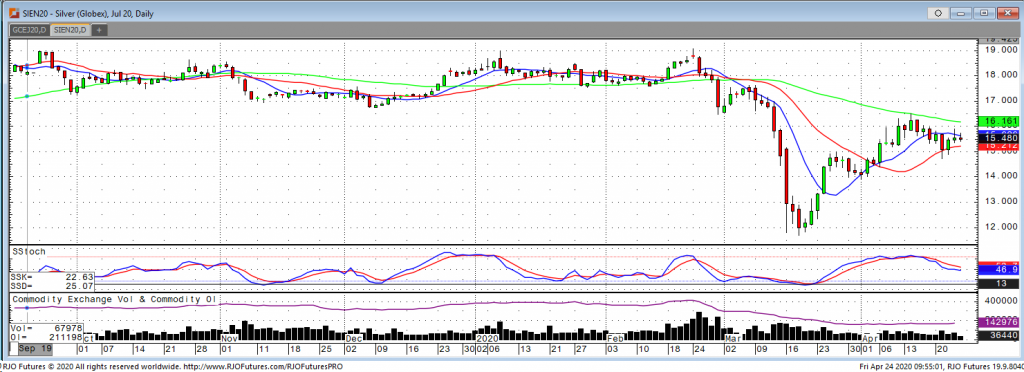
The silver market saw what had looked like to be a conclusive breakout to the upside last week. It should be noted that this moved was attributed to a decline in the dollar and the negative impacts of global supply. Silver prices may come into pressure as we begin to see more global stimulus headlines with more countries signaling packages for borrowing and debt. The challenge that the bull camp will undergo is going to continue to be a risk of strength in equities and a stronger dollar, which should be noted may be happening very soon. Although the market may be overbought in the short term technically; net spec and etf’s holdings are still net positive.
Chart studies as pointed out have been pointing to an overbought region, but as long as buyers continue to step in on pullbacks this should speed up a move higher when resistance levels are taken out. Moving averages point to a short-term pull back before potentially another leg higher. July silver points of interest include $15.02. If this holds resistance can be tested at $15.79 and $16.12.
Silver Jul '20 Daily Chart If you have any questions or would like to discuss the markets further, please feel free to contact me at 800-826-2270 or therrmann@rjofutures.com. Energy - Historic Fallout in Crude Oil
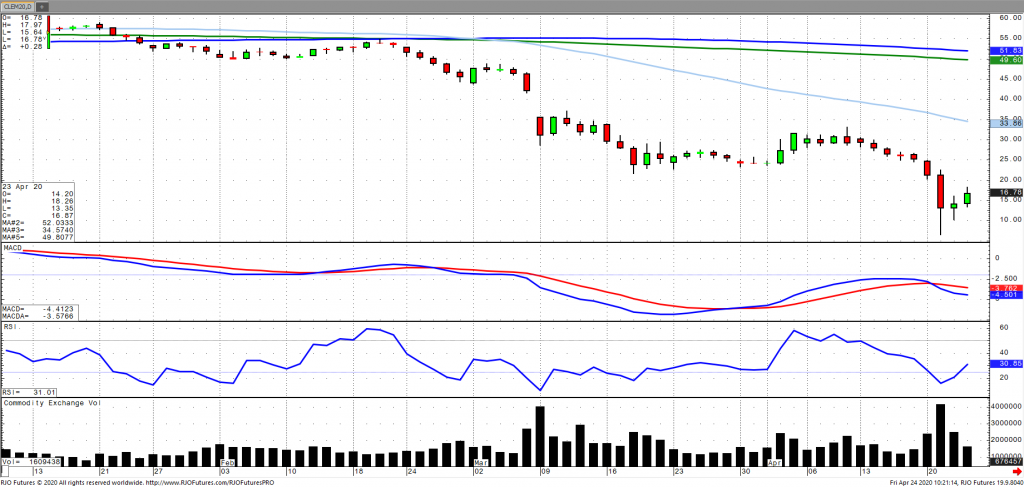
May WTI crude fell into negative territory for the first time earlier this week registering its largest one day fall due to refiners cutting runs and cushing storage approaching full capacity. This led to carryover into the June contract which will likely be impacted by storage concerns but also any impending demand signals. White House Economic Adviser Larry Kudlow stated on Monday that May will be a difficult month for the U.S. economy with oil so closely correlated to jobs and GDP growth. Recent reports that Asia’s crude oil storage increased 18 million barrels over the last week bringing capacity to the highest levels since 2016. Regarding supply side developments, India and China have both reported a decline in crude production for the month of March. Notwithstanding the demand fallout are reports that the White House has instructed the destruction of any Iranian vessels that threaten the U.S. The market remains bearish trend with today’s range seen between 19.67 – 10.29.
Crude Oil Jun '20 Daily Chart If you have any questions or would like to discuss the markets further, please feel free to contact me at 800-438-4805 or aturro@rjofutures.com. Softs - Cocoa Grindings and Coronavirus
Cocoa Grindings and Coronavirus
By: Peter MoosesPosted 04/24/2020
Cocoa
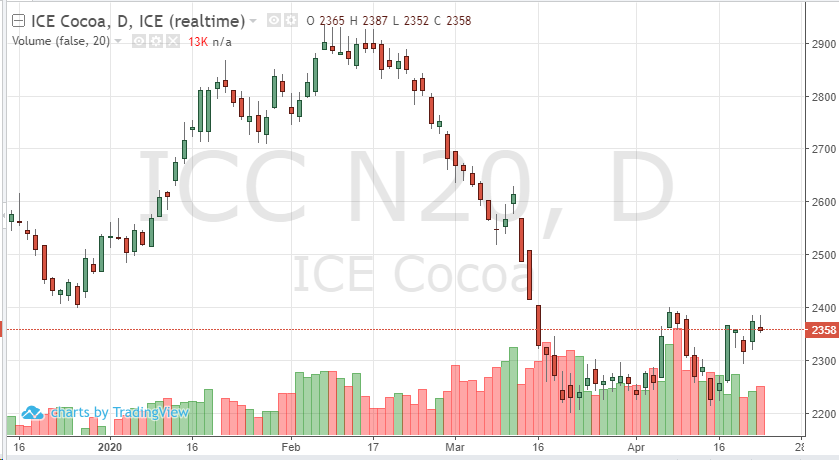
futures have some fundamental news this week that normally would be strong
enough to move the contract. European grinding data came in higher than
estimates, causing Wednesday’s trade to see the July contract in the green.
Traders were thinking the range would 2-4% lower but the European data came in
up .9%. Asia data also came in above estimates, bullish for futures, but the
market didn’t react that surprised. N. American data came in inline; all three
of these should have had prices closer to 2400, instead the global uncertainty
still has control of all markets.
Demand
will remain weak in cocoa as most of the world remains in some form of a
“lockdown” or restricted from the “norm.”
As the world continues to learn how to live in these times, commodities are trading off one main economic force, supply and demand. This seesaw is not giving the markets much to work with. Supply chains are obstructed, bullish prices, demand is lower, bearish prices – this equals rangebound trading sessions in cocoa most days.
The new “work-from-home” population has gone through the process of “pantry-stockpiling” of coffee, while coffee shops and restaurants remain closed, allowing only for drive-thru purchases. All the while, a strong U.S. dollar and continued “risk-off” mentality adds pressure to most all commodity prices. In addition to the lack of bull participation on the July coffee contract, the outlook of Brazil’s extremely large crop on the horizon, new bullish news will be needed to support coffee prices. Our friends at the Hightower Group reported that “the outlook for a record-size crop out of Brazil this year continues to be a bearish force.” I could not agree more. As demand for coffee is kept in check as we wait it out for more testing, treatments and ultimately a vaccine for Covid-19, the bulls will likely keep their distance from coffee.
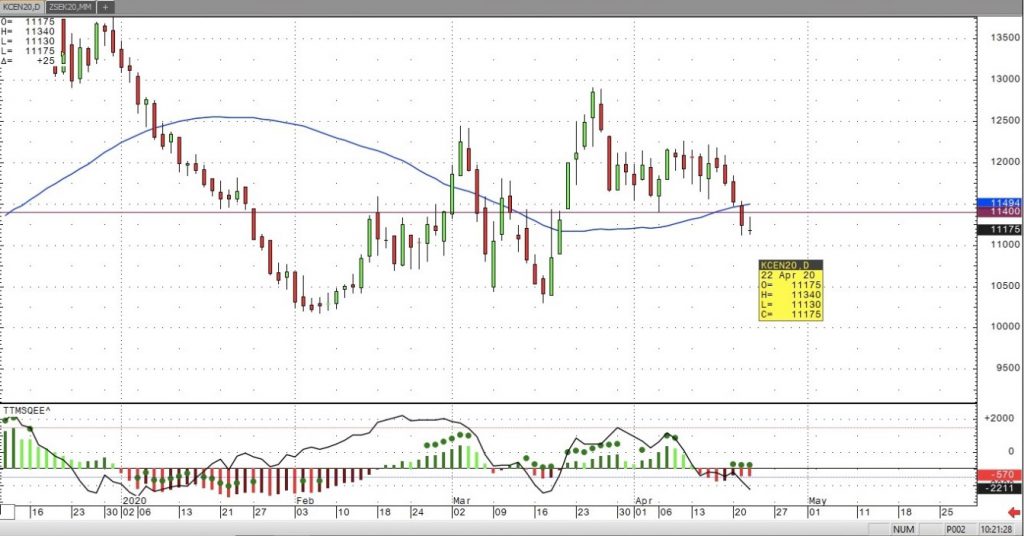
On
the heels of mid-Sep-to-early-Oct's steeper, accelerated, 3rd-wave-looking
recovery, the past week-and-a-half's boringly lateral chop is first considered
a corrective/consolidative event that warns of a continuation of the uptrend
that preceded it to new highs above 04-Oct's 891.0 high. This count
remains consistent with our broader base/correction/recovery count introduced
in 13-Sep's Technical Blog following that
day's bullish divergence in short-term momentum above 07-Sep's 809.5 minor
corrective high detailed in the hourly chart below.
The
important takeaway from this month's lateral, sleepy price action is the
definition of Wed's 851.5 low as
the end or lower boundary of a suspected 4th-Wave correction. A failure
below 851.5 will confirm a bearish divergence in daily momentum and defer or
threaten a bullish count enough to warrant non-bullish decisions like
long-covers. A failure below 851.5 will not
necessarily negate a broader bullish count, but it will threaten it enough to
warrant defensive measures as the next pertinent technical levels below 851.5 are
13-Sep's prospective minor 1st-Wave high at 813.8 and obviously 08-Sep's 766.0
low. And making non-bullish decisions "down there" is
sub-optimal to say the least. Per such, both short- and longer-term
commercial traders are advised to pare or neutralize bullish exposure on a
failure below 851.5, acknowledging and accepting whipsaw risk- back above 04-Oct's
891.0 high- in exchange for much deeper and sub-optimal nominal risk below
766.0.
On
a broader scale, the daily log scale chart above shows the developing potential
for a bearish divergence in daily momentum that will be considered confirmed
below 851.5. This chart also shows the past month's recovery thus far
stalling in the immediate neighborhood of the (888.0) Fibonacci
minimum 38.2% retrace of Apr-Sep's entire 1128 - 766 decline). COMBINED
with a failure below 851.5, traders
would then need to be concerned with at least a larger-degree correction pf the
past month's rally and possibly a resumption of Apr-Sep's major downtrend.
Until
and unless the market fails below 851.5 however, we would
remind longer-term players of the key elements on which our bullish count is
predicated:
a confirmed bullish divergence in WEEKLY momentum
(below)
amidst
an
historically low 11% reading in out RJO Bullish Sentiment Index and
a
textbook complete and major 5-wave Elliott sequence down from 29-Apr's
1128 high to 08-Sep's 766.0 low.
Thus
far, the market is only a month into correcting a 4-MONTH, 32% drawdown, so
further and possibly protracted gains remain well within the bounds of a major
(suspected 2nd-Wave) correction of Apr-Sep's decline within an even more
massive PEAK/reversal process from 17-May's 1219 high on an active continuation
basis below.
These
issues considered, a bullish policy and exposure remain advised with a failure
below 851.5 required to defer or threaten this call enough to warrant moving to
a neutral/sideline position. In lieu of such weakness, we anticipate a
continuation of the past month's rally to new highs and potentially significant
gains above 891.0.
Agricultural - Grain Futures Update w/Stephen Davis - 04/24/2020
Grain Futures Update w/Stephen Davis - 04/24/2020
By: Stephen DavisPosted 04/24/2020
Stephen Davis discusses this weeks changed in the grain markets. Crude oil is weighing down all commodities, and wheat seems to be the only grain performing well.Currency - Uncertainty Supports the USD in the Short-Term
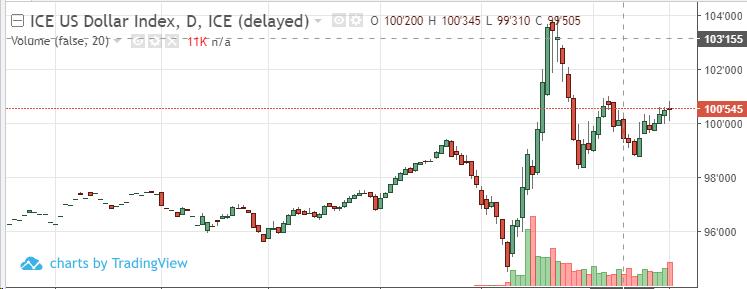
Uncertainty Supports the USD in the Short-Term
By: Ian BannonPosted 04/24/2020
Currency futures are mixed during Thursday’s trade as the U.S. dollar index is essentially flat on the day after trading in a 73-point intraday range. Short-term traders should look for a stronger dollar as uncertainty remains high. European fiat futures are likely to continue trending lower. In particular, the technical setup on the euro chart points to a retest of the low at 1.0671. The Australian dollar is also entrenched in a bear trend, trading at the top of its range on Thursday afternoon. Furthermore, the Australian economy is on track to enter its first recession in decades. Commodity currencies, like the Canadian and Australian dollar, typically trend higher went sentiment prefers the “risk on” trade. Therefore, in the likely event that “risk off” sentiment returns to markets, these currencies should be the worst performers. In the longer-term, this trend reverses. The Fed’s “do whatever it takes” attitude will inevitably break the USD and cause reversals in foreign fiat futures. When coronavirus uncertainty subsides, inflation is likely to return to the U.S. economy, and emerging market currencies should outperform those of developed economies.
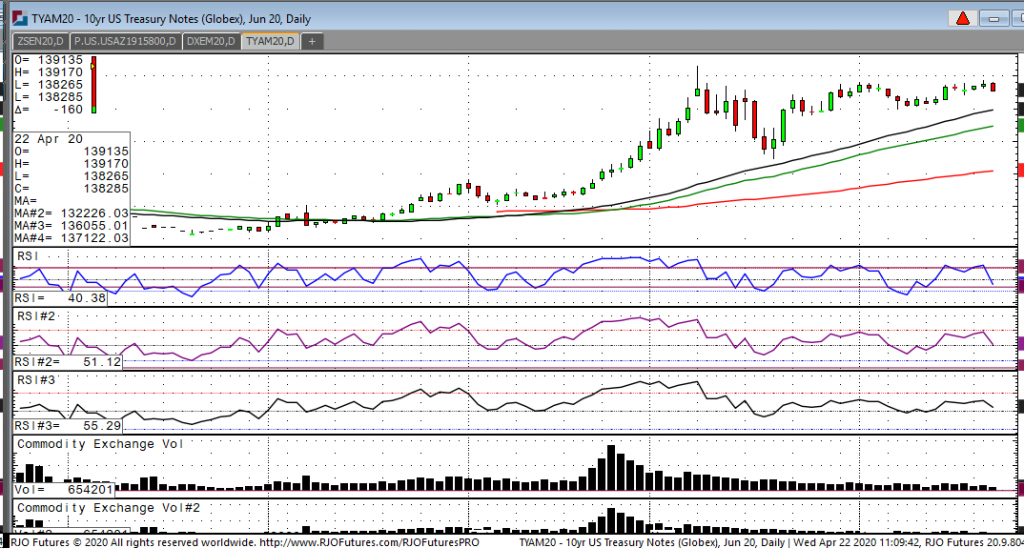
As we look at the June 10-year note we have a high of 139-17 and a low of 128-31 and are currently trading at 139-11. The notes are under some pressure today due to stock near their high, with Dow futures up 440 and the S&P up 55. We are also seeing crude oil climb nearly $3 in the June contract. Positive vibes from stocks and energies are taking a bite out of prices in the note complex. Going forward, I think we may be seeing a top in notes due to all the stimulus provided by the central banks to aid failing economies. The consequences of this stimulus is that inflation will come much sooner than anticipated making treasuries less desirable. Going forward, traders should be keyed on even more stimulus, a lower dollar and lower prices for T-notes.
10-Year Note Jun '20 Daily Chart If you have any questions or would like to discuss the markets further, please feel free to contact me at 800-826-2270 or gperlin@rjofutures.com. Economy - S-T Mo Failure Insufficient to End RBOB Correction, But Beware
S-T Mo Failure Insufficient to End RBOB Correction, But Beware
By: RJO Market InsightsPosted 11/08/2022
Posted on Nov 08, 2022, 07:51 by Dave Toth
In Fri's Technical Webcast we identified a
minor corrective low at 2.6328 from Thur as a mini risk parameter the market
needed to sustain gains above to maintain a more immediate bullish count.
The 240-min chart below shows the market's failure overnight below this level,
confirming a bearish divergence in very short-term momentum. This mo
failure defines Fri's 2.8172 high as
one of developing importance and a parameter from which very short-term traders
can objectively base non-bullish decisions like long-covers.
Given
the magnitude of the past three weeks' broader recovery however, this
short-term momentum failure is of an insufficient scale to conclude anything
more than another correction within this broader recovery from 26-Sep's 2.1877
low. Indeed, overnights failure below 2.6328 only allows us to conclude
the end of the portion of the month-and-a-half rally from 31-Oct's 2.4822 next
larger-degree corrective low. 2.4822 is the
risk parameter this market still needs to fail below to break the uptrend from
18-Oct's 2.3526 low while this 2.3526 low
remains intact as the risk parameter this market needs to fail below to break
the month-and-a-half uptrend. From an
intermediate-to-longer-term perspective, this week's setback falls well within
the bounds of another correction ahead of further gains. This is another
excellent example of the importance of technical and trading SCALE and
understanding and matching directional risk exposure to one's personal risk
profile.
The
reason overnight's admittedly minor mo failure might have longer-term
importance is the 2.8172-area from which it stemmed. In
Fri's Technical Blog we also noted the market's engagement of the
2.8076-to-2.8159-area marked by the 61.8% retrace of Jun0-Sewp's 3.2758 -2.1877
decline and the 1.000 progression of Sep-Oct's initial 2.1877 - 2.6185
(suspected a-Wave) rally from 18-Oct's 2.3526 (suspected b-Wave) low. We
remind longer-term players that because of the unique and compelling confluence
of:
early-Aug's bearish divergence in WEEKLY momentum
amidst
historically
extreme bullish sentiment/contrary opinion levels in our RJO Bullish
Sentiment Index
an
arguably complete and massive 5-wave Elliott sequence from Mar'20's 0.4605
low to Jun's 4.3260 high (as labeled in the weekly log active-continuation
chart below) and
the
5-wave impulsive sub-division of Jun-Sep's (suspected initial 1st-Wave) decline
The
recovery attempt from 26-Sep's 2.1877 low is arguably only a 3-wave (Wave-2)
corrective rebuttal to Jun-Sep's decline within a massive, multi-quarter
PEAK/reversal process. Now granted, due to the magnitude of 2020 -2022's
secular bull market, we discussed the prospect for this (2nd-Wave corrective)
recovery to be "extensive" in terms of both price and time. A
"more extensive" correction is typified by a retracement of 61.8% or
more and spanning weeks or even months following a 3-month decline. Per
such, the (suspected corrective) recovery from 26-Sep's 2.1877 low could easily
have further to go, with commensurately larger-degree weakness than that
exhibited this week (i.e., a failure below at least 2.4822) required
to consider the correction complete. Indeed, the daily log chart above
shows the market thus far respecting former 2.6185-area resistance from 10-Oct
as a new support candidate.
These
issues considered, very shorter-term traders have been advised to move to a neutral/sideline
position following overnight's momentum failure below 2.6328, with a recovery
above 2.8172 required to negate this call, reaffirm the recovery and re-expose
potentially significant gains thereafter. For intermediate- and
longer-term players, a bullish policy and exposure remain advised with a
failure below 2.4822 required to threaten this call enough to warrant
neutralizing exposure. We will be watchful for another bearish divergence
in momentum following a recovery attempt that falls short of Fri's 2.8172 high
that would be considered the next reinforcing factor to a count calling that
2.8172 high the prospective end to the month-and-a-half 2nd-Wave
correction. In lieu of such, a resumption of the current rally to
eventual new highs above 2.8172 should not surprise.