Experience a trading platform like no other with integrated tools to seamlessly trade and monitor the markets. With a free simulated trading account and personal broker experience, we’ll teach you about futures trading and help you develop a trading strategy.
The Markets
Metals - Gold is About to Explode Higher
Gold is About to Explode Higher
By: Joshua GravesPosted 07/10/2020
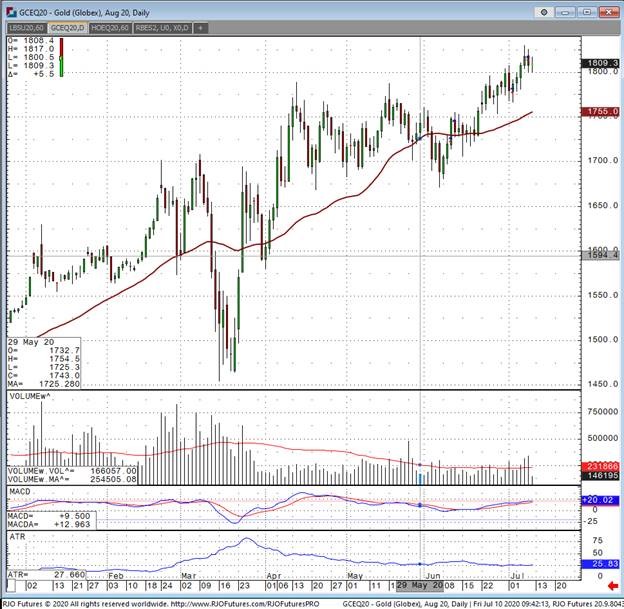
August gold futures have crossed an important milestone in
the contract and crossed it with strength. $1800 was a very important level to
get a close above and do it with volume behind it. I think that given the
economic pain likely ahead (safe haven play?) you could see gold continue to
find its footing and see a push toward that all to familiar level of $2000.
While this will likely take months to accomplish if gold moves up in a stable
pattern, the idea of $1600 gold before $2000 gold I’m not believing anymore. I
was skeptical about long gold as we couldn’t ever seem to get above $1790 for
more than a day or two. The blast through $1800 all the way to $1830 says quite
a bit.
The record push into gold ETF holdings, the unlimited Fed stimulus, and a general safe haven investment push have all led the precious metal higher and the rally is likely to continue. I think traders and investors should be eyeing gold very closely as at 8-year highs, any pullback of significance should be bought into even if it means buying in on a big down day (often hard to do among new traders). Traders can take advantage of the new likely range bound trade as we grind sideways to higher using different types of strategies, including options, which we sometimes incorporate in our strategy development. I am recommending a general long position in gold, and the purest way of doing so is going directly to the precious metal itself in the futures market and not an ETF. If you would like more information on various strategies we are trading please contact me directly.
Gold Aug '20 Daily ChartMetals - Silver Has a Potential Run to the Upside
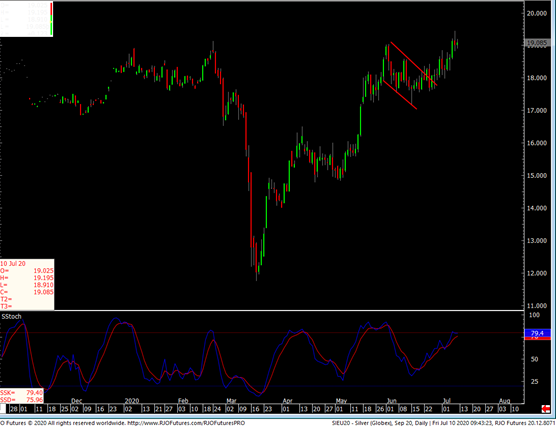
September silver is trading at $19.09 and up about 10-cents on the day. The surge in equity prices globally lead by China is definitely seeing as a supportive factor for strong silver performance. As you can clearly see here, front month silver is looking to take out $20.00. On the last issue, I wrote about the silver chart work setting up a potential flag on the chart and it has worked through that and is now heading to 20-dollars plus. As I have stated before, the Fed and world monitory authorities flooded the streets with cash as they are working hard to pull the world economy from the brink of total disaster. As we all know, this zero interest environment is here to stay for the foreseeable future. I continue to think that silver has a big run to the upside left to do. For the most part, everything on the negative side is already known, what is not clear yet is the pace of economic recovery. For now, silver will grind sideways to higher. ANY price break will be seen as an opportunity to buy rather than sell. Global markets continue to price-in new infection concerns. I think it is too early to talk "depression" but that remains to be seen. Markets will remain choppy as we navigate through this
If you have any questions or would like to discuss the markets further, please feel free to contact me at 800-367-7290 or etesfaye@rjofutures.com. Energy - Oil Assess Coronavirus and Supply Fears
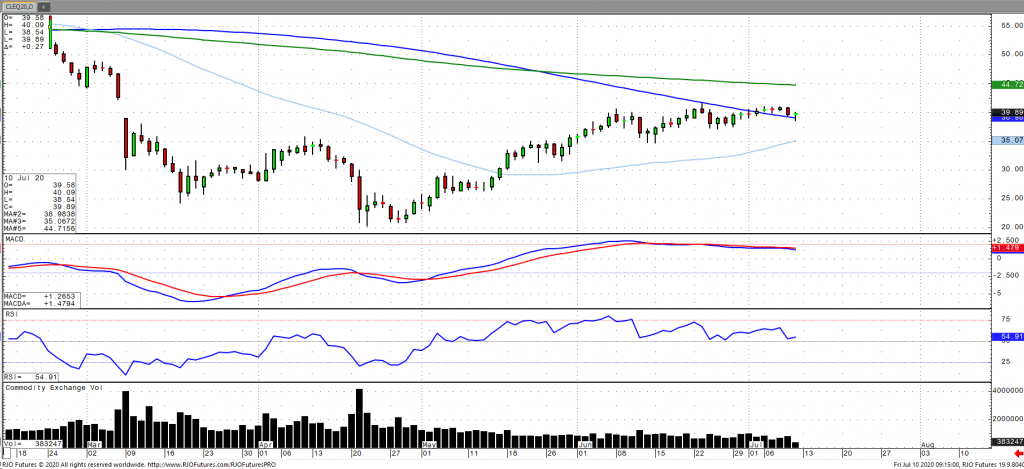
Oil prices have traded within a narrow range within the last couple weeks but appear susceptible to corrective action as record breaking new corona cases have renewed concerns about the pace of the economic recovery as well as the subsequent impact on fuel demand. Despite the International Energy Agency (IEA) increasing its 2020 forecast for oil demand, it was noted that the uncertainty surrounding COVID-19 still poses a heightened risk to outlook. U.S. crude oil inventories rose by nearly 6 million barrels with the annual surplus around 80 million barrels. Prices have been pressured by reports that Libyan oil production will be coming back online after six-month blockade by eastern forces. In addition, tensions between the U.S. and China have heightened as China said that will be responding to U.S. sanctions on Chinese officials over allegations of abuses against the Uigher Muslim minority. The market remains bullish trend amidst this reflation ramp up with today’s range seen between 38.02 – 41.57.
Crude Oil Aug '20 Daily Chart If you have any questions or would like to discuss the markets further, please feel free to contact me at 800-438-4805 or aturro@rjofutures.com. Agricultural - Bullish Canola Count Intact Above Minimum 851.5
Bullish Canola Count Intact Above Minimum 851.5
By: RJO Market InsightsPosted 10/14/2022
Posted on Oct 14, 2022, 07:42 by Dave Toth
On
the heels of mid-Sep-to-early-Oct's steeper, accelerated, 3rd-wave-looking
recovery, the past week-and-a-half's boringly lateral chop is first considered
a corrective/consolidative event that warns of a continuation of the uptrend
that preceded it to new highs above 04-Oct's 891.0 high. This count
remains consistent with our broader base/correction/recovery count introduced
in 13-Sep's Technical Blog following that
day's bullish divergence in short-term momentum above 07-Sep's 809.5 minor
corrective high detailed in the hourly chart below.
The
important takeaway from this month's lateral, sleepy price action is the
definition of Wed's 851.5 low as
the end or lower boundary of a suspected 4th-Wave correction. A failure
below 851.5 will confirm a bearish divergence in daily momentum and defer or
threaten a bullish count enough to warrant non-bullish decisions like
long-covers. A failure below 851.5 will not
necessarily negate a broader bullish count, but it will threaten it enough to
warrant defensive measures as the next pertinent technical levels below 851.5 are
13-Sep's prospective minor 1st-Wave high at 813.8 and obviously 08-Sep's 766.0
low. And making non-bullish decisions "down there" is
sub-optimal to say the least. Per such, both short- and longer-term
commercial traders are advised to pare or neutralize bullish exposure on a
failure below 851.5, acknowledging and accepting whipsaw risk- back above 04-Oct's
891.0 high- in exchange for much deeper and sub-optimal nominal risk below
766.0.
On
a broader scale, the daily log scale chart above shows the developing potential
for a bearish divergence in daily momentum that will be considered confirmed
below 851.5. This chart also shows the past month's recovery thus far
stalling in the immediate neighborhood of the (888.0) Fibonacci
minimum 38.2% retrace of Apr-Sep's entire 1128 - 766 decline). COMBINED
with a failure below 851.5, traders
would then need to be concerned with at least a larger-degree correction pf the
past month's rally and possibly a resumption of Apr-Sep's major downtrend.
Until
and unless the market fails below 851.5 however, we would
remind longer-term players of the key elements on which our bullish count is
predicated:
a confirmed bullish divergence in WEEKLY momentum
(below)
amidst
an
historically low 11% reading in out RJO Bullish Sentiment Index and
a
textbook complete and major 5-wave Elliott sequence down from 29-Apr's
1128 high to 08-Sep's 766.0 low.
Thus
far, the market is only a month into correcting a 4-MONTH, 32% drawdown, so
further and possibly protracted gains remain well within the bounds of a major
(suspected 2nd-Wave) correction of Apr-Sep's decline within an even more
massive PEAK/reversal process from 17-May's 1219 high on an active continuation
basis below.
These
issues considered, a bullish policy and exposure remain advised with a failure
below 851.5 required to defer or threaten this call enough to warrant moving to
a neutral/sideline position. In lieu of such weakness, we anticipate a
continuation of the past month's rally to new highs and potentially significant
gains above 891.0.
Agricultural - Grain Futures Update w/Stephen Davis - 07/10/2020
Grain Futures Update w/Stephen Davis - 07/10/2020
By: Stephen DavisPosted 07/10/2020
Stephen Davis discusses the latest happenings in the grain markets. With a crop report due out later today we expect to see some movement in the marketAgricultural - Live Cattle Production Above Expectations
Live Cattle Production Above Expectations
By: Peter McGinnPosted 07/10/2020
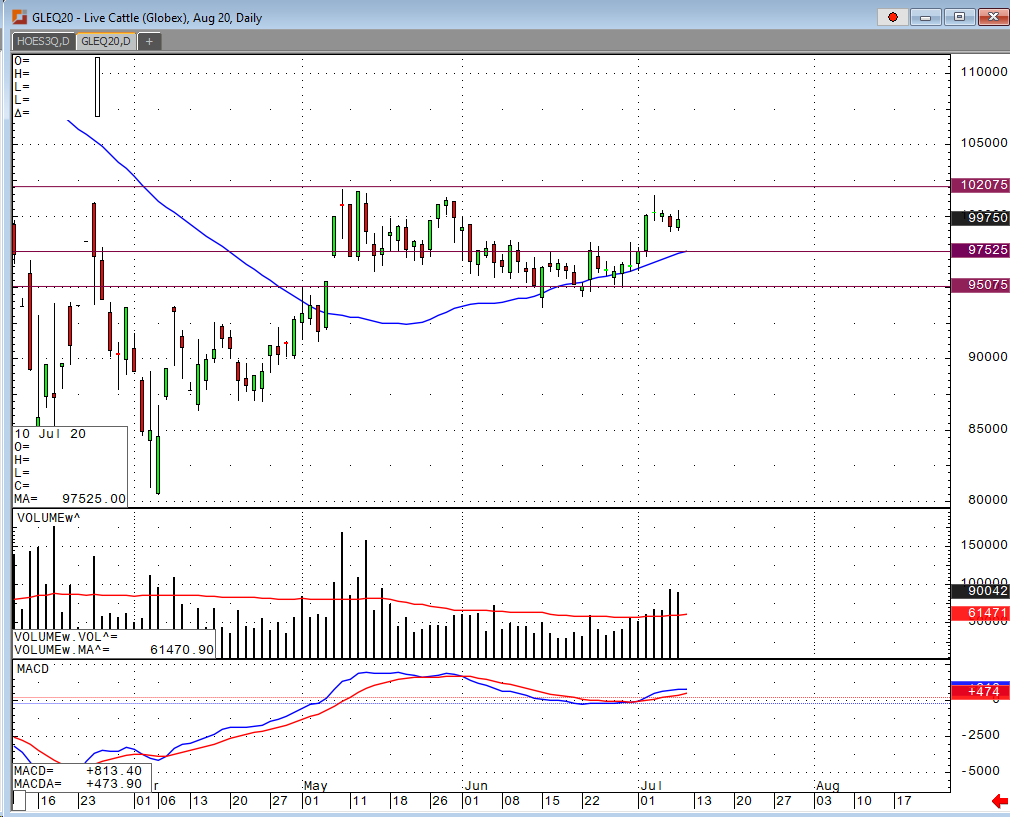
Yesterday, August cattle gave back all of its early gains to finish just slightly higher on the day. As of right now, there is a weak beef market and it is showing in the cash market with prices in the mid to high 90s, but traders seem to feel that he cash market is in a short-term bottom regardless of the weak demand. Cash live cattle traded moderately higher in Kansas on Thursday and mostly steady to weaker elsewhere. In Kansas 1158 head traded at $94-$98 and an average price of $95.94, up from $94.60 the previous day. In Nebraska 961 head traded at an average price of $96.40 vs $96.26 the previous day, and in Texas/Oklahoma 170 head traded $94 vs an average price of $94.91 the previous day. As I have been saying the past couple months, we should be keeping an eye on the slaughter numbers during this reopening period, slaughter numbers have been well above expectation during the duration and therefore production has been well above expectations. The USDA estimated cattle slaughter came in at 120,000 head yesterday. This brings the total for the week so far to 474,000 head, down from 484,000 last week and down from 476,000 a year ago. 97.5 looks to be a good target on the downside where support would come into play but with the current conditions and possible reclosing of restaurants over the next month, we could see the prices trend lower.
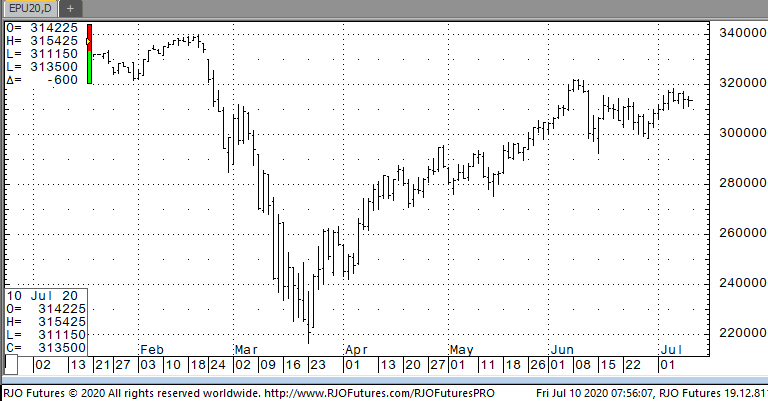
Live Cattle Aug '20 Daily ChartEquity - Stocks Down This Morning
Stock futures were pointed lower this morning as several states in the U.S. posted new highs in Covid-19 related outbreaks and deaths. Worldwide, Hong Kong will be reclosing schools and Mexico has also seen new record of recorded cases. Keeping the market from dropping further was some positive news from the pharmaceutical sector regarding positive data on their coronavirus treatments. Gilead Sciences said its coronavirus treatment candidate, remdesivir, “was associated with an improvement in clinical recovery and a 62 percent reduction in the risk of mortality compared with standard of care.” This news sent Gilead share up 2%.
Support today is checking in at 301000 and 296500 while resistance is showing 307500 and again at 309500.
E-mini S&P 500 Sep '20 Daily Chart If you have any questions or would like to discuss the markets further, please feel free to contact me at 888-861-1656 or jyasak@rjofutures.com. Economy - S-T Mo Failure Insufficient to End RBOB Correction, But Beware
S-T Mo Failure Insufficient to End RBOB Correction, But Beware
By: RJO Market InsightsPosted 11/08/2022
Posted on Nov 08, 2022, 07:51 by Dave Toth
In Fri's Technical Webcast we identified a
minor corrective low at 2.6328 from Thur as a mini risk parameter the market
needed to sustain gains above to maintain a more immediate bullish count.
The 240-min chart below shows the market's failure overnight below this level,
confirming a bearish divergence in very short-term momentum. This mo
failure defines Fri's 2.8172 high as
one of developing importance and a parameter from which very short-term traders
can objectively base non-bullish decisions like long-covers.
Given
the magnitude of the past three weeks' broader recovery however, this
short-term momentum failure is of an insufficient scale to conclude anything
more than another correction within this broader recovery from 26-Sep's 2.1877
low. Indeed, overnights failure below 2.6328 only allows us to conclude
the end of the portion of the month-and-a-half rally from 31-Oct's 2.4822 next
larger-degree corrective low. 2.4822 is the
risk parameter this market still needs to fail below to break the uptrend from
18-Oct's 2.3526 low while this 2.3526 low
remains intact as the risk parameter this market needs to fail below to break
the month-and-a-half uptrend. From an
intermediate-to-longer-term perspective, this week's setback falls well within
the bounds of another correction ahead of further gains. This is another
excellent example of the importance of technical and trading SCALE and
understanding and matching directional risk exposure to one's personal risk
profile.
The
reason overnight's admittedly minor mo failure might have longer-term
importance is the 2.8172-area from which it stemmed. In
Fri's Technical Blog we also noted the market's engagement of the
2.8076-to-2.8159-area marked by the 61.8% retrace of Jun0-Sewp's 3.2758 -2.1877
decline and the 1.000 progression of Sep-Oct's initial 2.1877 - 2.6185
(suspected a-Wave) rally from 18-Oct's 2.3526 (suspected b-Wave) low. We
remind longer-term players that because of the unique and compelling confluence
of:
early-Aug's bearish divergence in WEEKLY momentum
amidst
historically
extreme bullish sentiment/contrary opinion levels in our RJO Bullish
Sentiment Index
an
arguably complete and massive 5-wave Elliott sequence from Mar'20's 0.4605
low to Jun's 4.3260 high (as labeled in the weekly log active-continuation
chart below) and
the
5-wave impulsive sub-division of Jun-Sep's (suspected initial 1st-Wave) decline
The
recovery attempt from 26-Sep's 2.1877 low is arguably only a 3-wave (Wave-2)
corrective rebuttal to Jun-Sep's decline within a massive, multi-quarter
PEAK/reversal process. Now granted, due to the magnitude of 2020 -2022's
secular bull market, we discussed the prospect for this (2nd-Wave corrective)
recovery to be "extensive" in terms of both price and time. A
"more extensive" correction is typified by a retracement of 61.8% or
more and spanning weeks or even months following a 3-month decline. Per
such, the (suspected corrective) recovery from 26-Sep's 2.1877 low could easily
have further to go, with commensurately larger-degree weakness than that
exhibited this week (i.e., a failure below at least 2.4822) required
to consider the correction complete. Indeed, the daily log chart above
shows the market thus far respecting former 2.6185-area resistance from 10-Oct
as a new support candidate.
These
issues considered, very shorter-term traders have been advised to move to a neutral/sideline
position following overnight's momentum failure below 2.6328, with a recovery
above 2.8172 required to negate this call, reaffirm the recovery and re-expose
potentially significant gains thereafter. For intermediate- and
longer-term players, a bullish policy and exposure remain advised with a
failure below 2.4822 required to threaten this call enough to warrant
neutralizing exposure. We will be watchful for another bearish divergence
in momentum following a recovery attempt that falls short of Fri's 2.8172 high
that would be considered the next reinforcing factor to a count calling that
2.8172 high the prospective end to the month-and-a-half 2nd-Wave
correction. In lieu of such, a resumption of the current rally to
eventual new highs above 2.8172 should not surprise.
Economy - Economy: Look For Opportunities on the Edges
Asian equities chilled overnight with the Shanghai
-1.90% but +14% m/m – Chinese Banks reportedly eased back on asset purchases.
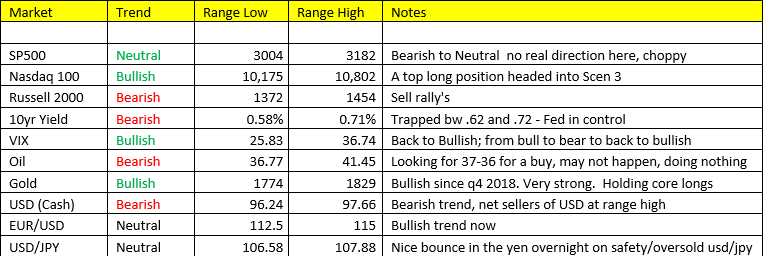
U.S. Equites followed China lower overnight, the SP500 -0.62% , Dow J -0.78%, Russell 2000 -0.90%, and the NASDAQ -0.49%. The NASDAQ begs the question whether or not it’s even an index anymore, when really only 5 stocks out of 3300 in the Composite drive the index? It’s an honest question. Either way we remain bullish of tech in Q3 2020 and bearish of US Small Caps.
Europe- Stronger industrial production out of France and Italy leant a hand to Euro stocks overnight. Europe “green” across the board. Ger, UK, France, Italy, Swiss indices leading the way ranging from +0.50 – 0.70% for the lot.
Oil/Energy- finally broke lower overnight, -1.54% following a negative session yesterday as well. +7M bbl build in weekly inventories but most notably the acceleration in US Covid-19 cases continue to spike and cast shadows over demand and economic recovery. As a matter of fact, the Int’l Energy Agency issued a warning pertaining to demand outlook due to Covid-19. However, we’re still buyers of Crude Oil at the low end of the range through Q3 2020 OR until further notice. We’re also going to be taking a hard look at Nat Gas on the current pull-back following the more than 40% rise off of its contract lows. Nat Gas looking as if its attempting to bottom, but remains bearish trend.
Metals- Continue to do their thing…Copper is
immediate overbought but remains bullish trend.
***UPDATE- as I type this, Gilead touts results of
Remdesivir vaccine trial. Stocks and crude oil are bouncing….
Not much else we’re seeing – still looking for our
opportunities on the edges – we’ll be in touch hopefully soon.
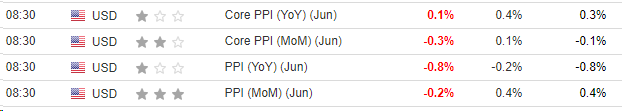
Econ Calendar for today….June producer inflation data expected to decline, but hold flat y/y.
Ranges If you have any questions or would like to discuss the markets further, please feel free to contact me at 800-669-5354 or jcaruso@rjofutures.com.