Experience a trading platform like no other with integrated tools to seamlessly trade and monitor the markets. With a free simulated trading account and personal broker experience, we’ll teach you about futures trading and help you develop a trading strategy.
The Markets
Metals - Look to Buy Gold on a Pullback
Look to Buy Gold on a Pullback
By: Joshua GravesPosted 07/24/2020
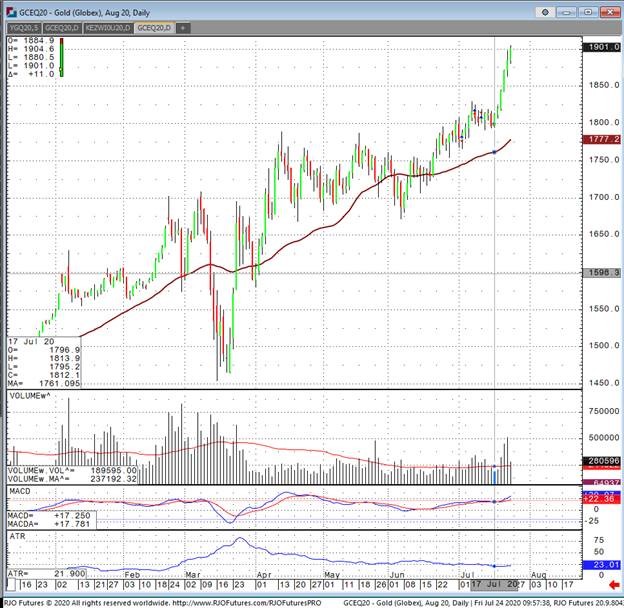
Gold’s allure has once again attracted thousands of
investors who don’t want to miss out on a 10 year high run in the gold market.
This has mainly been driven by interest rates at zero, federal stimulus money
injections, and positive industrial demand growth prospects in the future. The
fundamental story of why gold should continue to run is clearly there and I
don’t think anyone is seriously doubting that. There are some concerns that I
see with the speed of the rally and if you need proof of that check out silver
this week up 15%. Commodity markets like gold are notorious for doing this, and
investors should be weighing the risks of being long gold up here, with the
chances of a pullback to buy into.
I believe gold should be bought into on a pullback somewhere in the 1800’s. On the August contract that would be around 1850 to 1860 to me and on December gold around 1875. The technical aspect here is important because although we have run up so fast, the volume behind it has been stellar as well which is a positive for gold bulls. I think it’s a bit overbought in this territory, but that doesn’t change the fact it will likely do one of two things. The first is a continued surge toward 2000 with minor dips here and there, or a more significant correction that gets bought into heavily on the way down eventually coming back toward today’s price of around 1900 on August. Proceed with caution on the long side and for traders who are new to the precious metal, options might be the better route to take or a smaller size gold futures contract.
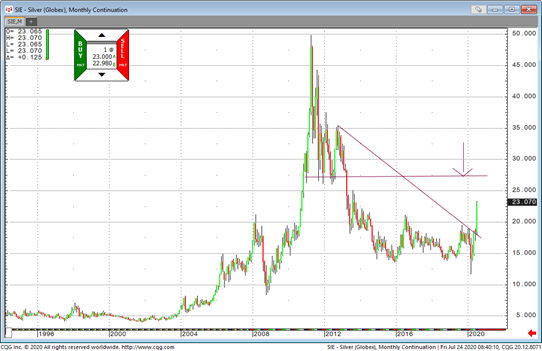
Front month silver is trading $23.05 up about 7-cents on the day. As you see the monthly chart below, silver is likely heading to Aug 2013 high of 25.12. In my view, the range of resistance is between 25.00 to 27.00. This month, silver took out 7-years high and likely poised for more gain. The path of least resistance remains high. Silver continues to benefit over gold on this rally. The gold/silver ratio is now near 82.00 as it was in 2018. I mentioned this last week, a break below 95 in the dollar index as seen this morning would only give silver push to head into the $25 to $27 range. The only thing that could slow down silver trajectory would be a dramatic breakthrough in Covid-19 vaccine or significant reduction in new cases.
There are other factors that are working it the background but the trend is your friend. A trader once said, “ trade what you see, not what you think”. What you see is a breakout and un uptrend. Any break to the downside, will likely be seen as an opportunity for late comers to jump on the bulls wagon. If you need additional help, please let me know. We can also approach this market using options as well the 1000oz contract.
Silver Monthly Chart If you have any questions or would like to discuss the markets further, please feel free to contact me at 800-367-7290 or etesfaye@rjofutures.com. Energy - Oil Edges Higher on Weaker Dollar, Softer Demand Weighs
Oil Edges Higher on Weaker Dollar, Softer Demand Weighs
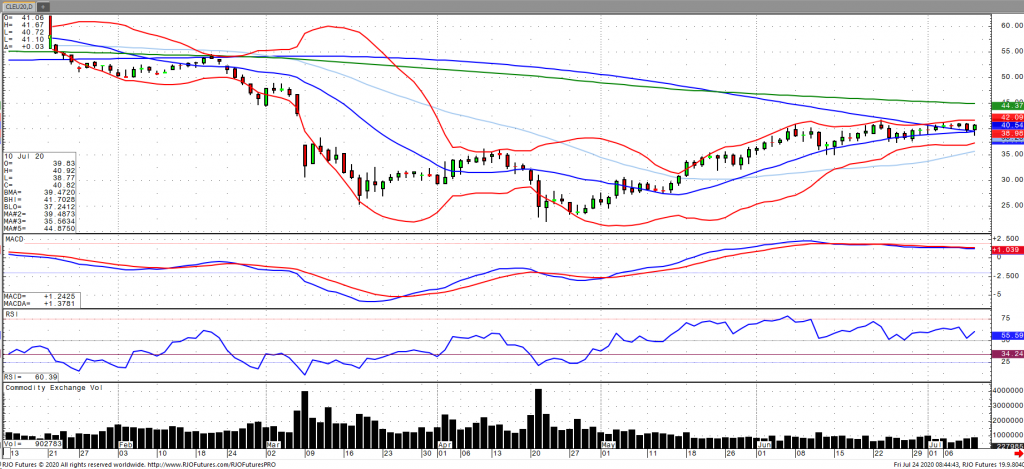
Oil prices are edging higher this morning following a two percent dip yesterday amidst yet another increase in corona cases as well heightened US- China tensions, despite more sustained weakness in the US Dollar as the Dollar Index moves to its lowest level since 2018. A rise US inventories have also weighed on prices as US production has increased to a new six week high amid lower fuel demand, according to the EIA. Oil demand outlook appears to be faltering in the short term as geopolitical tensions have increased trade risks and new cases have outweighed any reopening momentum. The market remains bullish trend with today’s range seen between 39.61 – 42.28.
Crude Oil sep '20 Daily Chart If you have any questions or would like to discuss the markets further, please feel free to contact me at 800-438-4805 or aturro@rjofutures.com. Softs - Grinding Data and Supply News Lead to Volatile Week in Cocoa
Grinding Data and Supply News Lead to Volatile Week in Cocoa
By: Peter MoosesPosted 07/23/2020
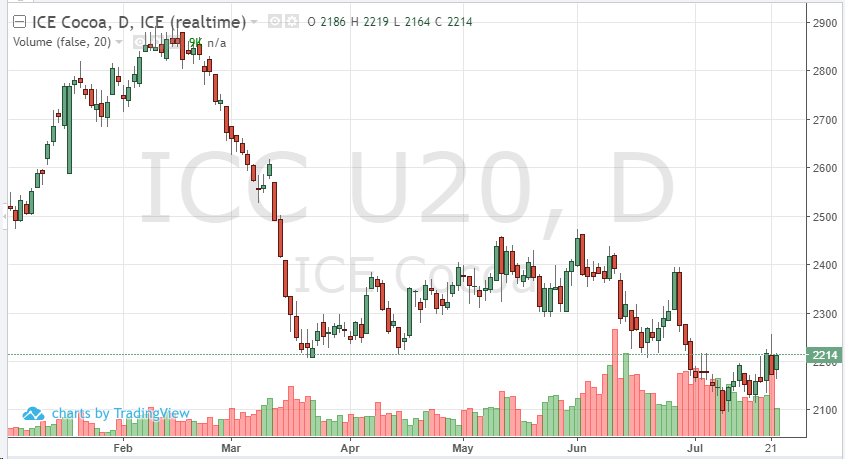
The chart is showing traders that we may have seen the bottom in the September cocoa contract. The past few sessions have canceled each other out, one day up, one day down and so on. Grindings data has caused some of this volatility. Lack of demand and some bullish supply info has also created this recent pattern. As we have leaned on demand news for guidance, West Africa may have enough of a threat to production that prices may be able to find some support. Also, if the global equity markets continue to stay somewhat positive, we may be headed back above 2250. For now, traders should keep an eye on the euro and pound for some additional directional help. The technicals also seem to be back in the picture for cocoa now since the demand concerns seem to be taking the sideline, so monitor the 2250 target and see where the market goes from there.
On
the heels of mid-Sep-to-early-Oct's steeper, accelerated, 3rd-wave-looking
recovery, the past week-and-a-half's boringly lateral chop is first considered
a corrective/consolidative event that warns of a continuation of the uptrend
that preceded it to new highs above 04-Oct's 891.0 high. This count
remains consistent with our broader base/correction/recovery count introduced
in 13-Sep's Technical Blog following that
day's bullish divergence in short-term momentum above 07-Sep's 809.5 minor
corrective high detailed in the hourly chart below.
The
important takeaway from this month's lateral, sleepy price action is the
definition of Wed's 851.5 low as
the end or lower boundary of a suspected 4th-Wave correction. A failure
below 851.5 will confirm a bearish divergence in daily momentum and defer or
threaten a bullish count enough to warrant non-bullish decisions like
long-covers. A failure below 851.5 will not
necessarily negate a broader bullish count, but it will threaten it enough to
warrant defensive measures as the next pertinent technical levels below 851.5 are
13-Sep's prospective minor 1st-Wave high at 813.8 and obviously 08-Sep's 766.0
low. And making non-bullish decisions "down there" is
sub-optimal to say the least. Per such, both short- and longer-term
commercial traders are advised to pare or neutralize bullish exposure on a
failure below 851.5, acknowledging and accepting whipsaw risk- back above 04-Oct's
891.0 high- in exchange for much deeper and sub-optimal nominal risk below
766.0.
On
a broader scale, the daily log scale chart above shows the developing potential
for a bearish divergence in daily momentum that will be considered confirmed
below 851.5. This chart also shows the past month's recovery thus far
stalling in the immediate neighborhood of the (888.0) Fibonacci
minimum 38.2% retrace of Apr-Sep's entire 1128 - 766 decline). COMBINED
with a failure below 851.5, traders
would then need to be concerned with at least a larger-degree correction pf the
past month's rally and possibly a resumption of Apr-Sep's major downtrend.
Until
and unless the market fails below 851.5 however, we would
remind longer-term players of the key elements on which our bullish count is
predicated:
a confirmed bullish divergence in WEEKLY momentum
(below)
amidst
an
historically low 11% reading in out RJO Bullish Sentiment Index and
a
textbook complete and major 5-wave Elliott sequence down from 29-Apr's
1128 high to 08-Sep's 766.0 low.
Thus
far, the market is only a month into correcting a 4-MONTH, 32% drawdown, so
further and possibly protracted gains remain well within the bounds of a major
(suspected 2nd-Wave) correction of Apr-Sep's decline within an even more
massive PEAK/reversal process from 17-May's 1219 high on an active continuation
basis below.
These
issues considered, a bullish policy and exposure remain advised with a failure
below 851.5 required to defer or threaten this call enough to warrant moving to
a neutral/sideline position. In lieu of such weakness, we anticipate a
continuation of the past month's rally to new highs and potentially significant
gains above 891.0.
Agricultural - Friday Ag Roundup w/Tony Cholly - 07/24/2020
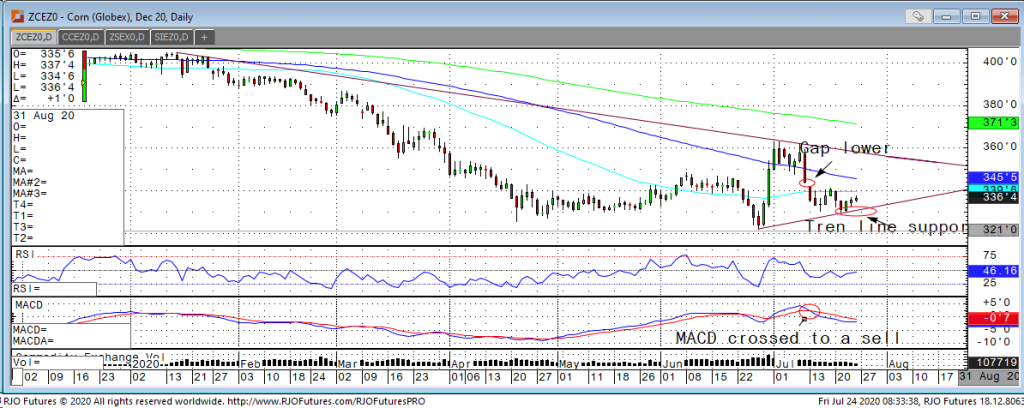
Corn: Like last week, corn began the week moving lower on Monday and Tuesday, running into support @ $3.30 (lows on the week) along the upward trend line. Along with hitting support, the demand out of China has remained steady this week, causing corn to bounce back on Wed/Thurs and began pushing back towards the highs of the week $3.40 that was put in on Monday before it sold off. Watch for continued choppy trade if weather stays good and we don’t see any extended dry/hot stretches in the forecast. COT has a large net short position for funds, so that is one thing to keep an eye on. Bullish news can spark a decent short covering rally if the gap is filled and continues higher through resistance.
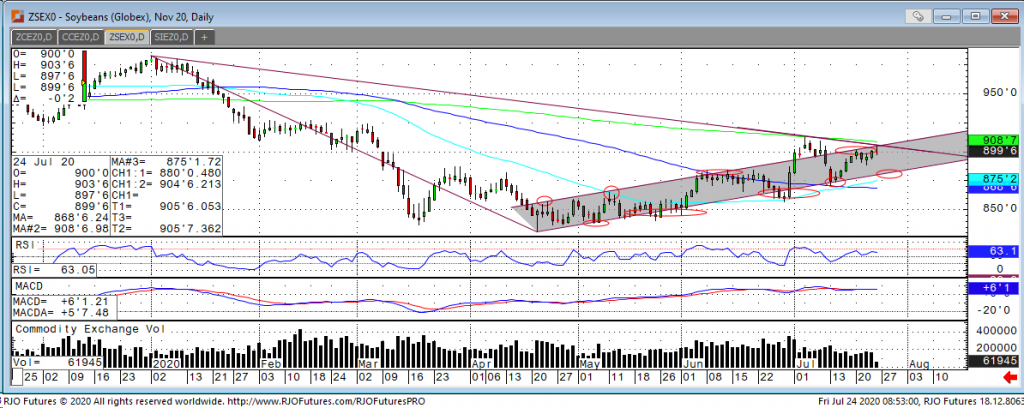
Soybeans: Soybeans, unlike Corn, began the week initially moving higher and running into resistance at the top end of the trend channel. ($9.02) Resistance held and we saw soybeans sell off on Tuesday on news of better weather mixed with a better crop progress report. China demand remained extremely strong with China purchasing beans for 8 straight trading sessions. Soybeans are hanging around the top end of the channel still and seem to have backed off this morning after touching resistance. Watch for beans to break this trend if China demand continues, but if we see bearish weather and less demand, I fully expect a move back to the lower end of the trend, which is circled on the chart below.
- World Corn Outlook – Stock Change vs. Usage Ratio - U.S. Soybean Export Sales and USDA Forecast - U.S. Planted Wheat & World Wheat Production - And Much More!
If you have any questions or would like to discuss the markets further, please feel free to contact me at 800-826-2270 or tcholly@rjofutures.com. Agricultural - Grain Futures Update w/Stephen Davis - 07/24/2020
Grain Futures Update w/Stephen Davis - 07/24/2020
By: Stephen DavisPosted 07/24/2020
Stephen Davis discusses this weeks changes in the grain markets and what he foresees in the future.Equity - Stock Futures Down With Increase in Tension Between U.S. and China
Stock Futures Down With Increase in Tension Between U.S. and China
The U.S. stock market is down this
morning on increased tensions between China and the U.S. The two countries traded blows this week with
the closing of the Chinese Consulate in Houston which led to the retaliatory
closure of the U.S. consulate in Chengdu. These closures led to a major sell
off in China based stocks that has had a ripple effect world-wide. Jobless claims have also helped the slide as
there was an increase in the weekly number for the first time since March. 1.42 million claims were reported compared to
1.3 million the week prior. This has
created increased fears into a sliding virus-stricken economy. “Like we have seen in several other economic
indicators, the initial claims data signal that the economy has lost some
momentum lately following the solid improvement that occurred throughout much
of April and May when restrictions on activity were being relaxed across much
of the nation” JP Morgan economist Daniel Silver.
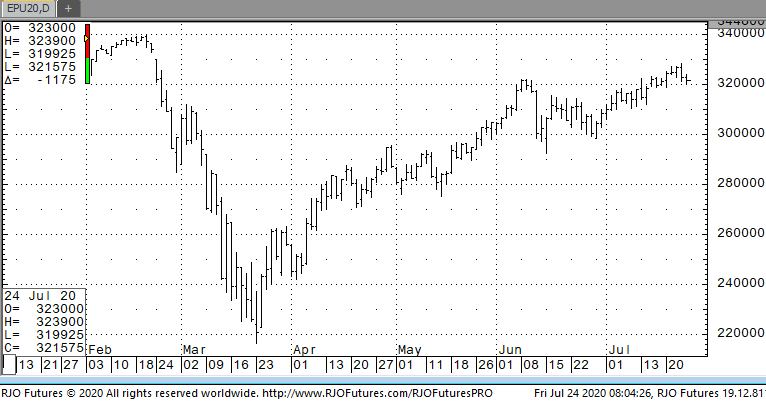
Support today is 319000 and 317000 while resistance is showing 326000 and 330500.
E-mini S&P 500 Sep '20 Daily Chart If you have any questions or would like to discuss the markets further, please feel free to contact me at 888-861-1656 or jyasak@rjofutures.com. Economy - S-T Mo Failure Insufficient to End RBOB Correction, But Beware
S-T Mo Failure Insufficient to End RBOB Correction, But Beware
By: RJO Market InsightsPosted 11/08/2022
Posted on Nov 08, 2022, 07:51 by Dave Toth
In Fri's Technical Webcast we identified a
minor corrective low at 2.6328 from Thur as a mini risk parameter the market
needed to sustain gains above to maintain a more immediate bullish count.
The 240-min chart below shows the market's failure overnight below this level,
confirming a bearish divergence in very short-term momentum. This mo
failure defines Fri's 2.8172 high as
one of developing importance and a parameter from which very short-term traders
can objectively base non-bullish decisions like long-covers.
Given
the magnitude of the past three weeks' broader recovery however, this
short-term momentum failure is of an insufficient scale to conclude anything
more than another correction within this broader recovery from 26-Sep's 2.1877
low. Indeed, overnights failure below 2.6328 only allows us to conclude
the end of the portion of the month-and-a-half rally from 31-Oct's 2.4822 next
larger-degree corrective low. 2.4822 is the
risk parameter this market still needs to fail below to break the uptrend from
18-Oct's 2.3526 low while this 2.3526 low
remains intact as the risk parameter this market needs to fail below to break
the month-and-a-half uptrend. From an
intermediate-to-longer-term perspective, this week's setback falls well within
the bounds of another correction ahead of further gains. This is another
excellent example of the importance of technical and trading SCALE and
understanding and matching directional risk exposure to one's personal risk
profile.
The
reason overnight's admittedly minor mo failure might have longer-term
importance is the 2.8172-area from which it stemmed. In
Fri's Technical Blog we also noted the market's engagement of the
2.8076-to-2.8159-area marked by the 61.8% retrace of Jun0-Sewp's 3.2758 -2.1877
decline and the 1.000 progression of Sep-Oct's initial 2.1877 - 2.6185
(suspected a-Wave) rally from 18-Oct's 2.3526 (suspected b-Wave) low. We
remind longer-term players that because of the unique and compelling confluence
of:
early-Aug's bearish divergence in WEEKLY momentum
amidst
historically
extreme bullish sentiment/contrary opinion levels in our RJO Bullish
Sentiment Index
an
arguably complete and massive 5-wave Elliott sequence from Mar'20's 0.4605
low to Jun's 4.3260 high (as labeled in the weekly log active-continuation
chart below) and
the
5-wave impulsive sub-division of Jun-Sep's (suspected initial 1st-Wave) decline
The
recovery attempt from 26-Sep's 2.1877 low is arguably only a 3-wave (Wave-2)
corrective rebuttal to Jun-Sep's decline within a massive, multi-quarter
PEAK/reversal process. Now granted, due to the magnitude of 2020 -2022's
secular bull market, we discussed the prospect for this (2nd-Wave corrective)
recovery to be "extensive" in terms of both price and time. A
"more extensive" correction is typified by a retracement of 61.8% or
more and spanning weeks or even months following a 3-month decline. Per
such, the (suspected corrective) recovery from 26-Sep's 2.1877 low could easily
have further to go, with commensurately larger-degree weakness than that
exhibited this week (i.e., a failure below at least 2.4822) required
to consider the correction complete. Indeed, the daily log chart above
shows the market thus far respecting former 2.6185-area resistance from 10-Oct
as a new support candidate.
These
issues considered, very shorter-term traders have been advised to move to a neutral/sideline
position following overnight's momentum failure below 2.6328, with a recovery
above 2.8172 required to negate this call, reaffirm the recovery and re-expose
potentially significant gains thereafter. For intermediate- and
longer-term players, a bullish policy and exposure remain advised with a
failure below 2.4822 required to threaten this call enough to warrant
neutralizing exposure. We will be watchful for another bearish divergence
in momentum following a recovery attempt that falls short of Fri's 2.8172 high
that would be considered the next reinforcing factor to a count calling that
2.8172 high the prospective end to the month-and-a-half 2nd-Wave
correction. In lieu of such, a resumption of the current rally to
eventual new highs above 2.8172 should not surprise.
By: John Caruso, Senior Market StrategistPosted Jul 22, 2020 7:57AM CTGlobal Equities: A relatively mixed bag around the world this morning, US trading slightly lower (off the overnight lows), Europe down all across the region with Spain leading -1.30%, and Asian equities higher across the region. Key earnings are due out in the US today, including the much lauded TSLA – which in our opinion has moved more on hope and FOMO rather than economic sanity, but who can even tell the difference anymore. Microsoft also reports after the bell.
Metals: Gold and Silver continued their climb overnight, Silver +6.50% last night at one point and once again outpacing Gold. Metals, specifically Gold are telling you that rates are going to be low, the Dollar is going to be weak, and expectations for inflation will be high well out into the future. Got that? Down rates, Down Dollar, up Gold. Metals are immediate-term overbought, as they were yesterday and the day before, look at booking some gains so you can replant your positions from the low end of our range, which is now north of 1800oz for Gold.
Oil- Trading down this morning on the larger than expected build in API inventories yesterday (+7M bbls w/w), which begs the question of the strength of demand. EIA report is due out today at 9:30 CST. There’s a topic on the table in the next stimulus bill presented by Mitch McConnel that would protect companies from employee lawsuits after returning to work. I happen to think this issue is very important for energy demand, as it would encourage companies to bring employee’s back therefore bolstering demand for fuel and travel back to work. I’ll tell you, from what I’ve seen the Chicago Loop is a ghost town during what used to be peak rush hour. Air travel fuel demand remains down 30% from last year.
US/China relations seem to be going “splendidly” this morning. The US has accused Chinese hackers of attempting to steal C19 vaccine intellectual property, and subsequently ordered the Chinese to close down their consulate in Houston Tx. Reports of a fire at the consulate this morning stem from rumors of the Chinese burning documents inside.
Stimulus- hearing that congress currently at an impasse on the next round of stimulus. Many of the benefits from the previous rounds of stimulus are set to expire at month end. Developing….
Long on patience, process, and Stagflation, short on FOMO. Good luck.
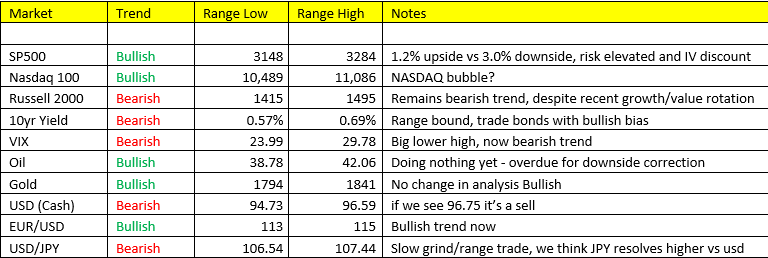
Actionable Levels
Feel free to reach out to John Caruso atjcaruso@rjofutures.comor 1-800-669-5354 if you’d like to get a 2 month free trial of our proprietary trade recommendations by email. Also, be sure you sign up for our exclusive RJO Futures PRO simulated demo account here.
RJO Futures PRO Simulated Account includes:
-$100K simulated trading capital
-Live Streaming Quotes and Charts to help you test out your trading abilities in real-time.
-Access to our Professional Trading Desk for advice and free daily research.
If you have any questions or would like to discuss the markets further, please feel free to contact me at 800-669-5354 or jcaruso@rjofutures.com.