Experience a trading platform like no other with integrated tools to seamlessly trade and monitor the markets. With a free simulated trading account and personal broker experience, we’ll teach you about futures trading and help you develop a trading strategy.
The Markets
Metals - Gold Continues to Shine, is $2500 Next?
Gold Continues to Shine, is $2500 Next?
By: Joshua GravesPosted 08/07/2020
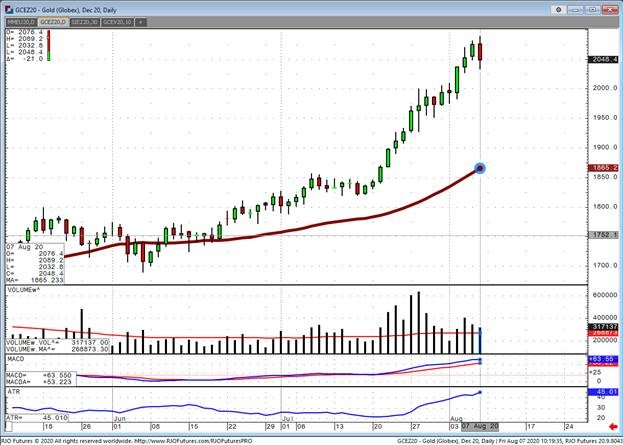
December gold futures have been on the biggest run in over a decade as the market continues to seek alternative asset classes while the US dollar continues its slide. Gold should continue to see buying interest heavily on any dip (such as this morning’s $40 selloff) and is widely seen as a store of value. The government isn’t “even thinking about thinking about” raising rates as Jerome Powell put it, which leads investors to flee the greenback in search of better performers and yield. Gold is getting plenty of tailwind with the dollar in a tailspin and just recently touching a 2-year low. The biggest and most obvious driver of this rally is the unpreceded surge of “free” money from the treasury. Another stimulus is seen in the near future and this should once again continue to smack down the dollar and boost the shiny metal into new high territory once again. Traders should position themselves for heavy volatility as the average true range (or ATR) indicator is now at $45 from $25 just one month ago. This means that gold’s average move top to bottom on any given day is $45, or $4500 per futures contract. It should come to no surprise as traders gain confidence in a bull run and FOMO kicks into overdrive that volatility is here to stay. Fear and greed are the only thing that move markets and a 10 year high in the shiny metal, an endless printing press from the Fed, slumping US dollar index, and general search of performance should all keep gold well above $2000 for the foreseeable future.
Gold Dec '20 Daily ChartMetals - Silver Headed to $30?
Silver Headed to $30?
By: Eli Tesfaye, Senior Market StrategistPosted Aug 7, 2020 10:43AM CT
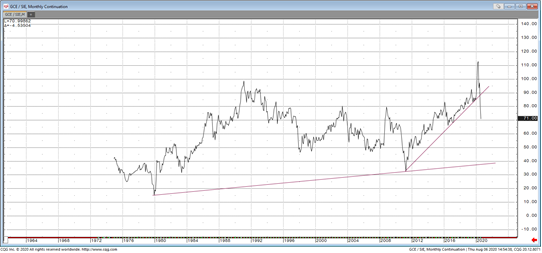
It looks like front month silver is heading to $30.00. Not sure what to expect after that but the trend is your friend. Attached is a chart of gold/silver ration you don’t see every day. I want to bring to your attention that gold really outperformed silver from 2011 until march of this year. Then you see a sharp drop of the ratio high of over 112 on monthly bases to what is today, a little over 72. As you see on the monthly chart of the spread, the trend line comes a tad above 40. Obviously this will take some time to happen as the trend extends all the way to 1970’s. .
As I said before, the path of least resistance remains up. Silver will continue to benefit over gold on this rally. The only thing that could slow down silver is increase in exchange margin, and significant reduction in new Covid cases. A trader once said, “ trade what you see, not what you think”. Any pull back, like today with silver down 27 cents at 28.00, will likely be seen as an opportunity for late comers to jump on the bulls wagon. We can also approach this market using options as well the 1000oz contract.
Gold/Silver Ratio Chart If you have any questions or would like to discuss the markets further, please feel free to contact me at 800-367-7290 or etesfaye@rjofutures.com. Energy - Oil Under Pressure, Set for Weekly Gain
Oil Under Pressure, Set for Weekly Gain
By: Alex Turro, Senior Market StrategistPosted Aug 7, 2020 9:19AM CT
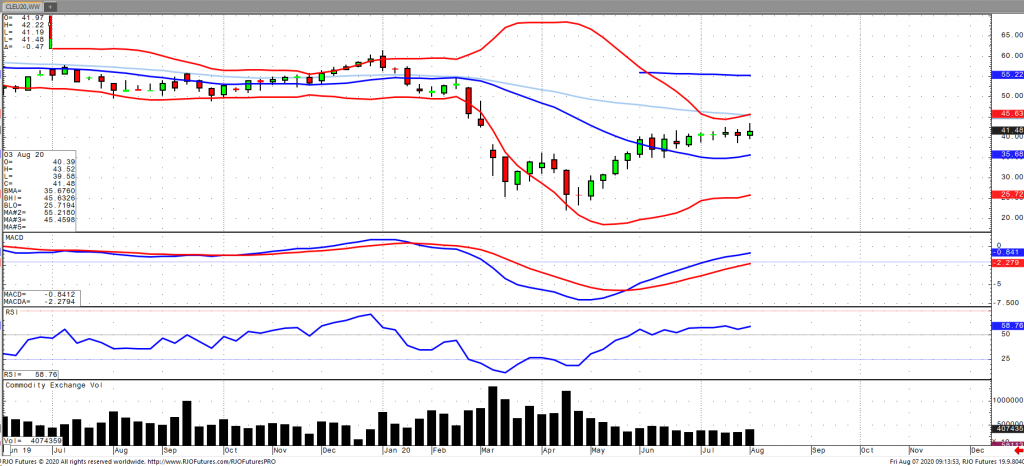
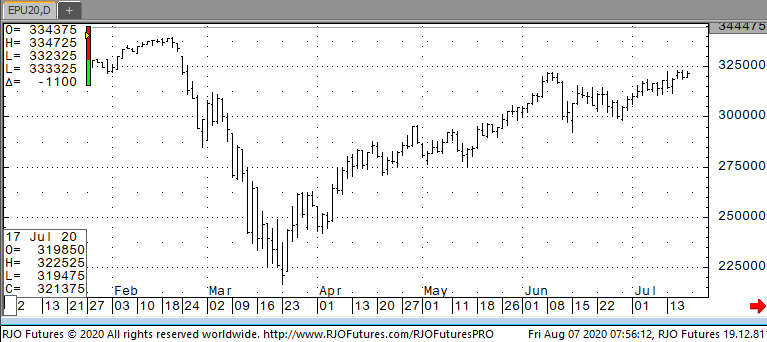
Oil prices are slipping this morning as non-farm payrolls reported an increase of 1.763 million in July with the unemployment rate falling to 10.2%. This comes amidst a resurgence in corona cases threatening demand recovery as well as an expected increase in production from Saudi Arabia and Russia weighing on prices. Notwithstanding, support has been garnered by strong Chinese oil imports and lower weekly floating storage numbers. The market is looking ahead to a potential new stimulus deal, which in turn, would be supportive of fuel demand. The US Dollar has continued to lend support as it continues to be devalued. The market is appearing to hold on to a weekly gain of over 3% with back to back weekly declines in stockpiles. Oil remains bullish trend with today’s range seen between 39.75 – 42.65.
Crude Oil Sep '20 Daily Chart If you have any questions or would like to discuss the markets further, please feel free to contact me at 800-438-4805 or aturro@rjofutures.com. Softs - Cocoa, Covid, and Candy Sales
Cocoa, Covid, and Candy Sales
By: Peter MoosesPosted 08/07/2020
As
the summer starts to come to an end, we look ahead to fall activities and
holidays. Will the demand for cocoa be down due to Covid and classroom
closures? What will Halloween look like in the U.S.? All these unknowns have
investors guessing on what earning will be for the major chocolate/food
companies. If data comes in better than expected look for the cocoa recovery to
continue.
Demand
has been the weak link for cocoa prices, but now it may be turning around
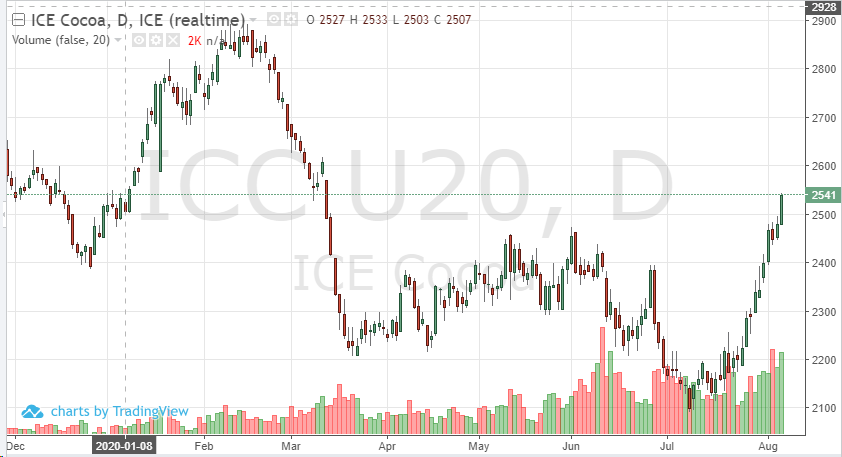
slowly. Production news has been coming in bullish, technically cocoa continues
to close above the 200-day moving average and the currencies are supporting
this recent move as well.
Weather premium may also come into play supporting these new prices in the futures as key growing regions have reported lower rainfall totals. Traders should monitor the charts and resistance at 2585 in the short-term.
On
the heels of mid-Sep-to-early-Oct's steeper, accelerated, 3rd-wave-looking
recovery, the past week-and-a-half's boringly lateral chop is first considered
a corrective/consolidative event that warns of a continuation of the uptrend
that preceded it to new highs above 04-Oct's 891.0 high. This count
remains consistent with our broader base/correction/recovery count introduced
in 13-Sep's Technical Blog following that
day's bullish divergence in short-term momentum above 07-Sep's 809.5 minor
corrective high detailed in the hourly chart below.
The
important takeaway from this month's lateral, sleepy price action is the
definition of Wed's 851.5 low as
the end or lower boundary of a suspected 4th-Wave correction. A failure
below 851.5 will confirm a bearish divergence in daily momentum and defer or
threaten a bullish count enough to warrant non-bullish decisions like
long-covers. A failure below 851.5 will not
necessarily negate a broader bullish count, but it will threaten it enough to
warrant defensive measures as the next pertinent technical levels below 851.5 are
13-Sep's prospective minor 1st-Wave high at 813.8 and obviously 08-Sep's 766.0
low. And making non-bullish decisions "down there" is
sub-optimal to say the least. Per such, both short- and longer-term
commercial traders are advised to pare or neutralize bullish exposure on a
failure below 851.5, acknowledging and accepting whipsaw risk- back above 04-Oct's
891.0 high- in exchange for much deeper and sub-optimal nominal risk below
766.0.
On
a broader scale, the daily log scale chart above shows the developing potential
for a bearish divergence in daily momentum that will be considered confirmed
below 851.5. This chart also shows the past month's recovery thus far
stalling in the immediate neighborhood of the (888.0) Fibonacci
minimum 38.2% retrace of Apr-Sep's entire 1128 - 766 decline). COMBINED
with a failure below 851.5, traders
would then need to be concerned with at least a larger-degree correction pf the
past month's rally and possibly a resumption of Apr-Sep's major downtrend.
Until
and unless the market fails below 851.5 however, we would
remind longer-term players of the key elements on which our bullish count is
predicated:
a confirmed bullish divergence in WEEKLY momentum
(below)
amidst
an
historically low 11% reading in out RJO Bullish Sentiment Index and
a
textbook complete and major 5-wave Elliott sequence down from 29-Apr's
1128 high to 08-Sep's 766.0 low.
Thus
far, the market is only a month into correcting a 4-MONTH, 32% drawdown, so
further and possibly protracted gains remain well within the bounds of a major
(suspected 2nd-Wave) correction of Apr-Sep's decline within an even more
massive PEAK/reversal process from 17-May's 1219 high on an active continuation
basis below.
These
issues considered, a bullish policy and exposure remain advised with a failure
below 851.5 required to defer or threaten this call enough to warrant moving to
a neutral/sideline position. In lieu of such weakness, we anticipate a
continuation of the past month's rally to new highs and potentially significant
gains above 891.0.
Agricultural - Grain Futures Update w/Stephen Davis - 08/07/2020
Grain Futures Update w/Stephen Davis - 08/07/2020
By: Stephen DavisPosted 08/07/2020
Stephen Davis discusses the latest news in the grain markets, including a possible trade war part 2 with China.Agricultural - Expect Live Cattle to Sell Off
Expect Live Cattle to Sell Off
By: Peter McGinnPosted 08/07/2020
Overall October live cattle still remains in an uptrend but with yesterday’s price action that is triggering some bearish technical signals. I suspect that cash and futures beef prices begin to firm around these levels unless we see the slaughter numbers start to increase and come in above last years numbers. The USDA slaughter estimates came in at 118k head yesterday, bringing the total for the week to 464k which was down about 10k from last week. Boxed beef cutout values were up about $1.09 after the close finishing at $204.66. This was up from $201.80 from last week, the highest levels we have seen since the first week of July.
On the cash end of the market, there has been some heavy trading in terms of volume for KS, NE, and OK with prices 2.5-3 cents higher. People in the market have a strong belief that the cash market is going to rally with the Oct futures above 107 and cash at 100. US beef exports sales for the week ending July 30th totaled 13,366 tonnes. Feeder cattle contracts are trading one shaky ground, higher one minute, lower next and are sitting dangerously close to the resistance levels that were broke through last Friday. As trade continues to panic, the understanding that the feeder cattle charts are topping out is becoming more prominent. August feeders were down $0.92 at $143.87, September feeders were down $0.05 at $146.42 and October feeders were up $0.07 at $147.37. In all, I believe live cattle futures will start to sell off a little bit until we see the slaughter numbers start to increase. A target to step in and buy would be 105.
Live Cattle Oct '20 Daily ChartEquity - Stronger Than Expected Jobs Report
Stronger Than Expected Jobs Report
By: Jeff Yasak, Senior Market StrategistPosted Aug 7, 2020 8:54AM CT
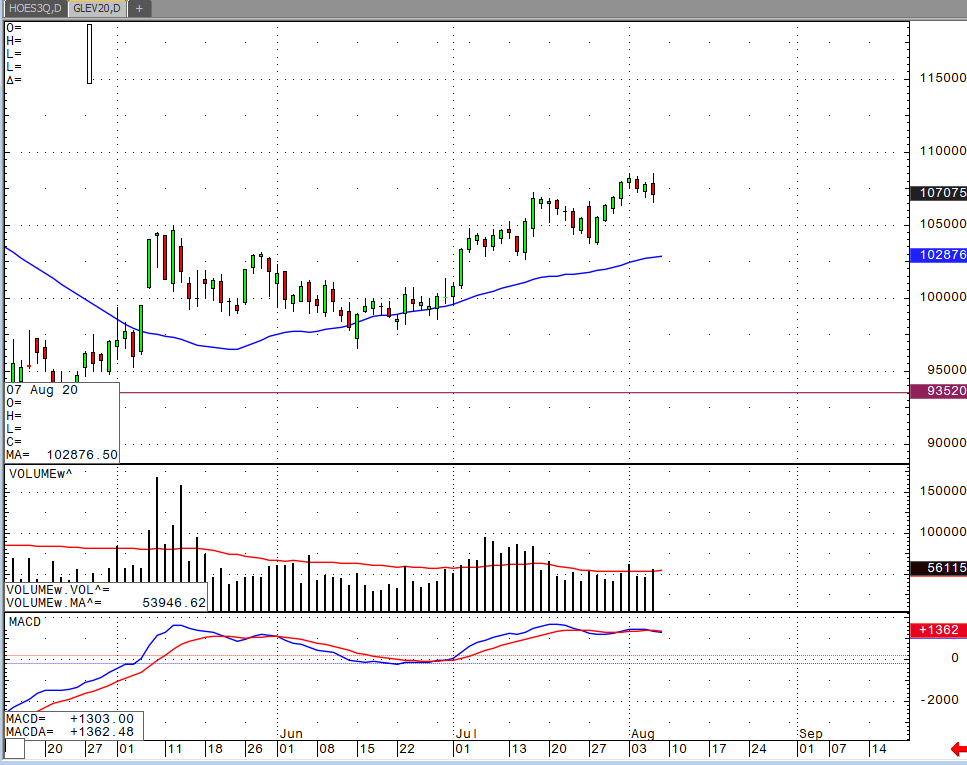
U.S. stock futures rallied off their lows Friday morning after the release of a stronger than expecting job report. The U.S. added 1.763 million jobs in July while economists were predicting a number in the 1.4 million area. The unemployment rate was also better than expected coming in at 10.2%. Revisions for the months of May and June were also higher on todays release. This positive news came when investors were eagerly waiting for lawmakers to come to an agreement on a new U.S. relief package. The negotiations were near a collapse Thursday as White House officials and Democratic leaders were no where close to making a deal and these positive numbers could ease pressures of a quick deal. “If this had been a bad number, it would have forced the negotiators to get a deal done.” Said Matt Maley, chief market strategist at Miller Tabak & Co. “So in a perverse way, the better-than-expected data raises the odds that nothing will get done soon on the fiscal front.”
Support today is checking in at 332000 and 330000 while support is showing 336600 and 337500.
E-mini S&P 500 Sep '20 Daily Chart If you have any questions or would like to discuss the markets further, please feel free to contact me at 888-861-1656 or jyasak@rjofutures.com. Economy - S-T Mo Failure Insufficient to End RBOB Correction, But Beware
S-T Mo Failure Insufficient to End RBOB Correction, But Beware
By: RJO Market InsightsPosted 11/08/2022
Posted on Nov 08, 2022, 07:51 by Dave Toth
In Fri's Technical Webcast we identified a
minor corrective low at 2.6328 from Thur as a mini risk parameter the market
needed to sustain gains above to maintain a more immediate bullish count.
The 240-min chart below shows the market's failure overnight below this level,
confirming a bearish divergence in very short-term momentum. This mo
failure defines Fri's 2.8172 high as
one of developing importance and a parameter from which very short-term traders
can objectively base non-bullish decisions like long-covers.
Given
the magnitude of the past three weeks' broader recovery however, this
short-term momentum failure is of an insufficient scale to conclude anything
more than another correction within this broader recovery from 26-Sep's 2.1877
low. Indeed, overnights failure below 2.6328 only allows us to conclude
the end of the portion of the month-and-a-half rally from 31-Oct's 2.4822 next
larger-degree corrective low. 2.4822 is the
risk parameter this market still needs to fail below to break the uptrend from
18-Oct's 2.3526 low while this 2.3526 low
remains intact as the risk parameter this market needs to fail below to break
the month-and-a-half uptrend. From an
intermediate-to-longer-term perspective, this week's setback falls well within
the bounds of another correction ahead of further gains. This is another
excellent example of the importance of technical and trading SCALE and
understanding and matching directional risk exposure to one's personal risk
profile.
The
reason overnight's admittedly minor mo failure might have longer-term
importance is the 2.8172-area from which it stemmed. In
Fri's Technical Blog we also noted the market's engagement of the
2.8076-to-2.8159-area marked by the 61.8% retrace of Jun0-Sewp's 3.2758 -2.1877
decline and the 1.000 progression of Sep-Oct's initial 2.1877 - 2.6185
(suspected a-Wave) rally from 18-Oct's 2.3526 (suspected b-Wave) low. We
remind longer-term players that because of the unique and compelling confluence
of:
early-Aug's bearish divergence in WEEKLY momentum
amidst
historically
extreme bullish sentiment/contrary opinion levels in our RJO Bullish
Sentiment Index
an
arguably complete and massive 5-wave Elliott sequence from Mar'20's 0.4605
low to Jun's 4.3260 high (as labeled in the weekly log active-continuation
chart below) and
the
5-wave impulsive sub-division of Jun-Sep's (suspected initial 1st-Wave) decline
The
recovery attempt from 26-Sep's 2.1877 low is arguably only a 3-wave (Wave-2)
corrective rebuttal to Jun-Sep's decline within a massive, multi-quarter
PEAK/reversal process. Now granted, due to the magnitude of 2020 -2022's
secular bull market, we discussed the prospect for this (2nd-Wave corrective)
recovery to be "extensive" in terms of both price and time. A
"more extensive" correction is typified by a retracement of 61.8% or
more and spanning weeks or even months following a 3-month decline. Per
such, the (suspected corrective) recovery from 26-Sep's 2.1877 low could easily
have further to go, with commensurately larger-degree weakness than that
exhibited this week (i.e., a failure below at least 2.4822) required
to consider the correction complete. Indeed, the daily log chart above
shows the market thus far respecting former 2.6185-area resistance from 10-Oct
as a new support candidate.
These
issues considered, very shorter-term traders have been advised to move to a neutral/sideline
position following overnight's momentum failure below 2.6328, with a recovery
above 2.8172 required to negate this call, reaffirm the recovery and re-expose
potentially significant gains thereafter. For intermediate- and
longer-term players, a bullish policy and exposure remain advised with a
failure below 2.4822 required to threaten this call enough to warrant
neutralizing exposure. We will be watchful for another bearish divergence
in momentum following a recovery attempt that falls short of Fri's 2.8172 high
that would be considered the next reinforcing factor to a count calling that
2.8172 high the prospective end to the month-and-a-half 2nd-Wave
correction. In lieu of such, a resumption of the current rally to
eventual new highs above 2.8172 should not surprise.
By: John Caruso, Senior Market StrategistPosted Aug 7, 2020 8:58AM CT
NF Payrolls data:
1.8M jobs created vs 1.6M exp – Beat 10.25% rate vs 10.5% - Beat
Revisions:
May and June Payroll were revised up a net 9K
All of this was better than expected and what’s most concerning is the massive gap between the ADP data on Wed (showing 160K jobs created) vs today’s data showing 1.6M, and the potential for large revisions LOWER next month. Hmm.
Markets are chopping following the number, no real direction for the day thus far. Now the attention gets turned back to Washington DC and whether they can piece together a deal ahead of their Aug recess. I’d expect some near-term “fireworks” here as the deadline looms.
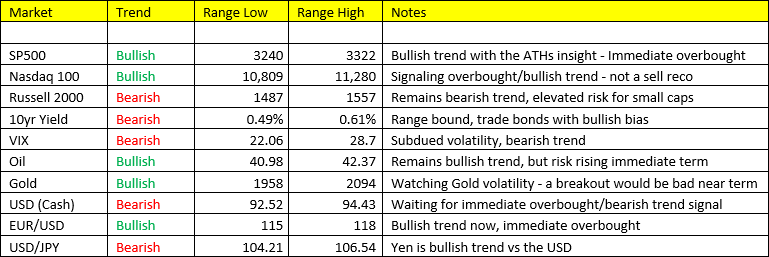
Rundown:
Global Equities: Europe was choppy to lower, Shanghai lost 1.00% overnight (remains bullish trend), but threatening a correction as Tencent becomes Trump's new target. The U.S. is looking at modestly lower open. Stay bullish Tech, but bearish on Small Caps.
Bonds/Yields: despite the “better than
expected” data, they can’t crack the bond market/lower yields. We’ve been
in about 6-8 bps range in the 10yr for the past 2 weeks.
Gold/Silver: Following Silver’s overnight ramp to
$30.00, it’s now $1.50 off the highs. We’ll wait patiently to signal
here. Gold same thing, bounce overnight now backing off $27.00 off the
highs.
I’m going to keep it relatively brief as we’re fairly swamped on this end. Back soon.
If you have any questions or would like to discuss the markets further, please feel free to contact me at 800-669-5354 or jcaruso@rjofutures.com.