Discover how options are priced and learn to read option quotes
How to trade rising and falling markets using options
New: The Stock Market After the Election
We are just a little over a week out from the 2020 Presidential Election and as predicted the stock market has seen increased volatility. Equity markets seems to be rising at an emphatic pace. We got an adrenaline injection on Monday with the news of a seemingly 90% effective Covid-19 vaccine that drove the market even higher. Don’t miss out on this opportunity, learn the best ways to navigate this post-election climate while it lasts!
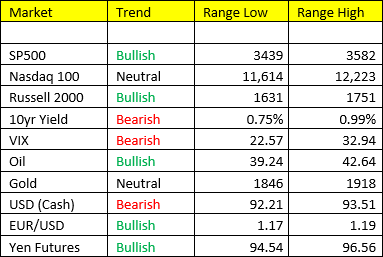
The Markets
Metals - Gold Losing Steam
Gold Losing Steam
By: Joshua GravesPosted 11/13/2020
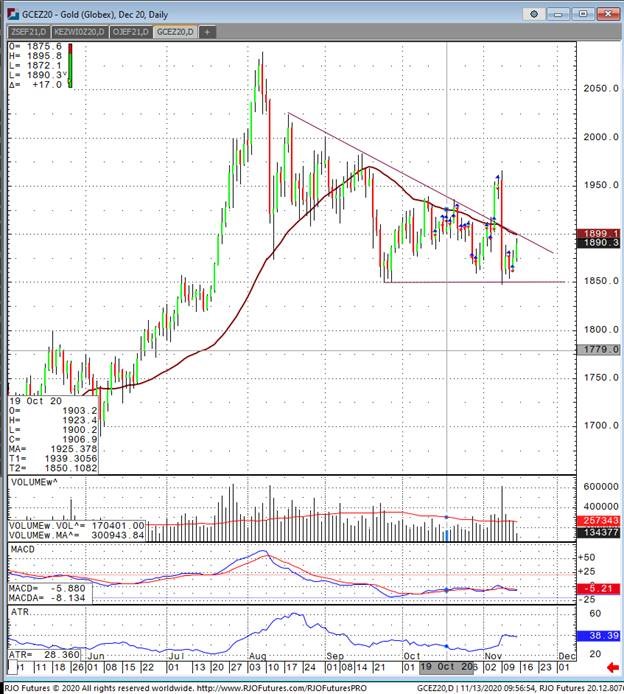
December gold continues to be one of the most volatile futures markets to trade right now. The only thing that is holding gold up here is the technical price level which all gold traders are watching not being taken out. This level happens to come in at 1850 and is quite important in the grand scheme of things. If this level gets taken out the most likely immediate direction of gold is lower and with no support coming in until all the way down at 1800 even. I think that what is likely to happen here is gold will not have the strength to take out the recent high of 1980 without a stimulus bill, or something along the sort that is a “big headline” type of event. Want to know something “spooky,” check out the biggest gold ETF having its biggest liquidation since March 20th yesterday selling off 503,000 oz of physical gold. The way to play gold right now is to the short side, with buy stops sitting above the recent high of 1966. If a trader is wanting to be long gold they need to be willing to give up the gains between current levels and the recent high. I think being long from this level is unlikely to avoid a washout selloff that appears more and more likely as bearish sentiment creeps in once again. Gold is currently up at 1890 and the volume is extremely light. This could be a draw for bulls but beware that no trading volume means no confidence. If a trader wishes to be long I would suggest using a defined risk call spread rather than outright long futures.
Gold Dec '20 Daily ChartMetals - Silver Waiting for a Second Stimulus
Silver Waiting for a Second Stimulus
By: Eli Tesfaye, Senior Market StrategistPosted Nov 13, 2020 9:08AM CT
Silver is stuck in a waiting pattern looking for some help from a second stimulus package. If and when this happens it could drive silver higher. If you have any questions or would like to discuss the markets further, please feel free to contact me at 800-367-7290 or etesfaye@rjofutures.com. Energy - Covid-19 Continuing to Dampen Demand Outlook in Crude Oil
Covid-19 Continuing to Dampen Demand Outlook in Crude Oil
By: Alex Turro, Senior Market StrategistPosted Nov 13, 2020 10:12AM CT
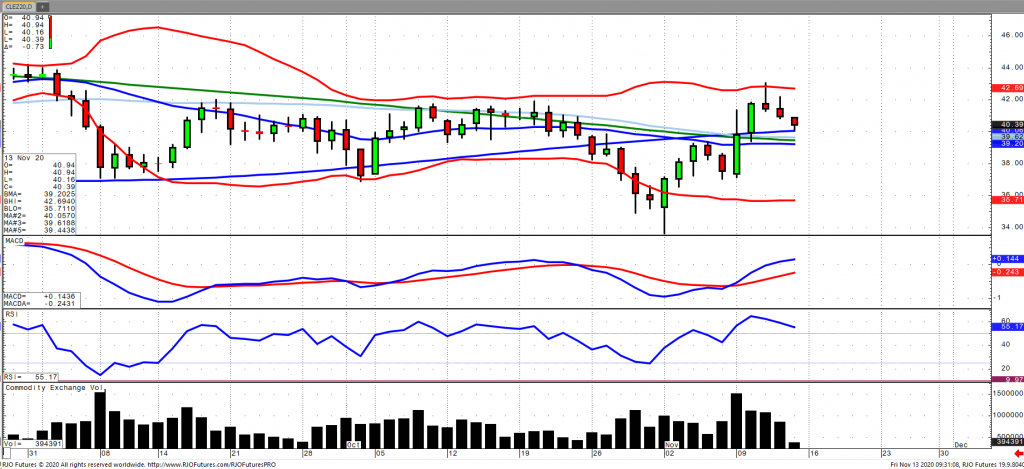
Oil has continued to move lower following an early week surge as the market assess the ongoing demand destruction as coronavirus cases continue to surge in the US and Europe with added restrictions being implemented. This has been coupled with an unexpected rise US crude stockpiles as inventories rose by 4.3 million barrels. Global consumption and dampening fuel demand continue to remain at the forefront despite the recent vaccine developments as the International Energy Agency (IEA) stated that global demand prospects were unlikely to accelerate well into 2021. In addition, the sentiment was echoed by OPEC, lowering its demand forecast stating that consumption was likely to rebound slower than initially expected. Notwithstanding, Algeria’s energy minister noted that OPEC+ may extend current production cuts of 7.7 million bpd into 2021 or deepen if necessary. OPEC+ is not expected to move forward with easing supply restrictions as was initially expected due to the increasingly grim demand outlook. This comes as US and Libyan production have continued to rise with Libyan production reportedly now up to 1.2 million bpd. The market has transitioned to bullish trend after breaking out above (~39 trend) but has been correcting from the top end of its range earlier in the week with today’s range seen between 38.31 – 42.89.
Crude Oil Dec '20 Daily Chart If you have any questions or would like to discuss the markets further, please feel free to contact me at 800-438-4805 or aturro@rjofutures.com. Softs - US Presidential Election Results, Covid-19 Cases Rise and Demand Concerns for Cocoa
US Presidential Election Results, Covid-19 Cases Rise and Demand Concerns for Cocoa
By: Peter MoosesPosted 11/13/2020
The
US markets started the week off with a positive tone, surging higher on
Election results and a potential Covid-19 vaccine breakthrough from Pfizer. As
indices moved higher, most commodities followed suit. This rally was
short-lived due to the growing number of Coronavirus cases in the US and
worldwide. Europe has implemented lockdowns; the US is rolling-back
restrictions in certain areas due to the rise in positive tests – these changes
will add volatility to all markets in the short-term. Until a vaccine is
approved and available to the public, anticipate this pattern for months to
come.
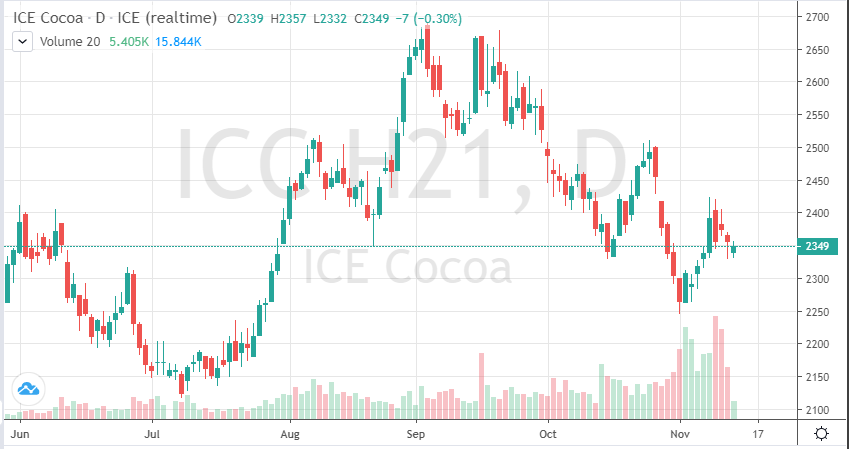
Cocoa
is already dealing with demand issues, add in lockdowns in Europe and the
closing of indoor dining in areas of the US, cocoa futures could see more
downside. Demand for chocolate is critical this time of year – Hershey and
Barry Callebaut may be seeing the fourth quarter a little more positive than
anticipated which can help cocoa prices rise heading into 2021.
Weather patterns in West Africa could be causing concerns for production in that region. If this holds, support could be seen on the chart at these current levels.
On
the heels of mid-Sep-to-early-Oct's steeper, accelerated, 3rd-wave-looking
recovery, the past week-and-a-half's boringly lateral chop is first considered
a corrective/consolidative event that warns of a continuation of the uptrend
that preceded it to new highs above 04-Oct's 891.0 high. This count
remains consistent with our broader base/correction/recovery count introduced
in 13-Sep's Technical Blog following that
day's bullish divergence in short-term momentum above 07-Sep's 809.5 minor
corrective high detailed in the hourly chart below.
The
important takeaway from this month's lateral, sleepy price action is the
definition of Wed's 851.5 low as
the end or lower boundary of a suspected 4th-Wave correction. A failure
below 851.5 will confirm a bearish divergence in daily momentum and defer or
threaten a bullish count enough to warrant non-bullish decisions like
long-covers. A failure below 851.5 will not
necessarily negate a broader bullish count, but it will threaten it enough to
warrant defensive measures as the next pertinent technical levels below 851.5 are
13-Sep's prospective minor 1st-Wave high at 813.8 and obviously 08-Sep's 766.0
low. And making non-bullish decisions "down there" is
sub-optimal to say the least. Per such, both short- and longer-term
commercial traders are advised to pare or neutralize bullish exposure on a
failure below 851.5, acknowledging and accepting whipsaw risk- back above 04-Oct's
891.0 high- in exchange for much deeper and sub-optimal nominal risk below
766.0.
On
a broader scale, the daily log scale chart above shows the developing potential
for a bearish divergence in daily momentum that will be considered confirmed
below 851.5. This chart also shows the past month's recovery thus far
stalling in the immediate neighborhood of the (888.0) Fibonacci
minimum 38.2% retrace of Apr-Sep's entire 1128 - 766 decline). COMBINED
with a failure below 851.5, traders
would then need to be concerned with at least a larger-degree correction pf the
past month's rally and possibly a resumption of Apr-Sep's major downtrend.
Until
and unless the market fails below 851.5 however, we would
remind longer-term players of the key elements on which our bullish count is
predicated:
a confirmed bullish divergence in WEEKLY momentum
(below)
amidst
an
historically low 11% reading in out RJO Bullish Sentiment Index and
a
textbook complete and major 5-wave Elliott sequence down from 29-Apr's
1128 high to 08-Sep's 766.0 low.
Thus
far, the market is only a month into correcting a 4-MONTH, 32% drawdown, so
further and possibly protracted gains remain well within the bounds of a major
(suspected 2nd-Wave) correction of Apr-Sep's decline within an even more
massive PEAK/reversal process from 17-May's 1219 high on an active continuation
basis below.
These
issues considered, a bullish policy and exposure remain advised with a failure
below 851.5 required to defer or threaten this call enough to warrant moving to
a neutral/sideline position. In lieu of such weakness, we anticipate a
continuation of the past month's rally to new highs and potentially significant
gains above 891.0.
Agricultural - Grain Futures Update w/Stephen Davis - 11/13/2020
Grain Futures Update w/Stephen Davis - 11/13/2020
By: Stephen DavisPosted 11/13/2020
Stephen Davis discusses the latest news moving the grain markets amid post-election falloutEquity - Stocks are Up Today After Slow Week
Stocks are Up Today After Slow Week
By: Jeff Yasak, Senior Market StrategistPosted Nov 13, 2020 9:19AM CT
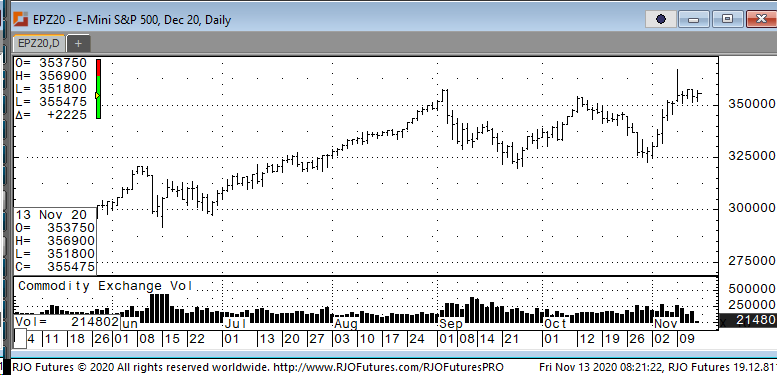
The U.S. stock
futures are up this morning looking to end the week on a good note after the
market was down this week on record number COVID-19 cases. The market had also been dealing with new
stimulus concerns and the vaccine reports.
The U.S. coronavirus problem hit hard this week as new cases saw a
record number of 150,000 on Wednesday alone.
This increase has led numerous states and municipalities imposing
curfews and restrictions once again to help curtail the spread. Earnings also
helped the market rally with Disney and Cisco leading the way. Disney shares rose with the company
announcing it now has 73 million paid subscribers for its streaming service,
Disney+. Cisco shares jumped 7% with of
a strong report on earnings and revenue and better than expected prediction on
the new quarter.
Support today is 350000 and 347500 with resistance showing 356700 and 360000.
E-mini S&P 500 Dec '20 Daily Chart If you have any questions or would like to discuss the markets further, please feel free to contact me at 888-861-1656 or jyasak@rjofutures.com. Economy - S-T Mo Failure Insufficient to End RBOB Correction, But Beware
S-T Mo Failure Insufficient to End RBOB Correction, But Beware
By: RJO Market InsightsPosted 11/08/2022
Posted on Nov 08, 2022, 07:51 by Dave Toth
In Fri's Technical Webcast we identified a
minor corrective low at 2.6328 from Thur as a mini risk parameter the market
needed to sustain gains above to maintain a more immediate bullish count.
The 240-min chart below shows the market's failure overnight below this level,
confirming a bearish divergence in very short-term momentum. This mo
failure defines Fri's 2.8172 high as
one of developing importance and a parameter from which very short-term traders
can objectively base non-bullish decisions like long-covers.
Given
the magnitude of the past three weeks' broader recovery however, this
short-term momentum failure is of an insufficient scale to conclude anything
more than another correction within this broader recovery from 26-Sep's 2.1877
low. Indeed, overnights failure below 2.6328 only allows us to conclude
the end of the portion of the month-and-a-half rally from 31-Oct's 2.4822 next
larger-degree corrective low. 2.4822 is the
risk parameter this market still needs to fail below to break the uptrend from
18-Oct's 2.3526 low while this 2.3526 low
remains intact as the risk parameter this market needs to fail below to break
the month-and-a-half uptrend. From an
intermediate-to-longer-term perspective, this week's setback falls well within
the bounds of another correction ahead of further gains. This is another
excellent example of the importance of technical and trading SCALE and
understanding and matching directional risk exposure to one's personal risk
profile.
The
reason overnight's admittedly minor mo failure might have longer-term
importance is the 2.8172-area from which it stemmed. In
Fri's Technical Blog we also noted the market's engagement of the
2.8076-to-2.8159-area marked by the 61.8% retrace of Jun0-Sewp's 3.2758 -2.1877
decline and the 1.000 progression of Sep-Oct's initial 2.1877 - 2.6185
(suspected a-Wave) rally from 18-Oct's 2.3526 (suspected b-Wave) low. We
remind longer-term players that because of the unique and compelling confluence
of:
early-Aug's bearish divergence in WEEKLY momentum
amidst
historically
extreme bullish sentiment/contrary opinion levels in our RJO Bullish
Sentiment Index
an
arguably complete and massive 5-wave Elliott sequence from Mar'20's 0.4605
low to Jun's 4.3260 high (as labeled in the weekly log active-continuation
chart below) and
the
5-wave impulsive sub-division of Jun-Sep's (suspected initial 1st-Wave) decline
The
recovery attempt from 26-Sep's 2.1877 low is arguably only a 3-wave (Wave-2)
corrective rebuttal to Jun-Sep's decline within a massive, multi-quarter
PEAK/reversal process. Now granted, due to the magnitude of 2020 -2022's
secular bull market, we discussed the prospect for this (2nd-Wave corrective)
recovery to be "extensive" in terms of both price and time. A
"more extensive" correction is typified by a retracement of 61.8% or
more and spanning weeks or even months following a 3-month decline. Per
such, the (suspected corrective) recovery from 26-Sep's 2.1877 low could easily
have further to go, with commensurately larger-degree weakness than that
exhibited this week (i.e., a failure below at least 2.4822) required
to consider the correction complete. Indeed, the daily log chart above
shows the market thus far respecting former 2.6185-area resistance from 10-Oct
as a new support candidate.
These
issues considered, very shorter-term traders have been advised to move to a neutral/sideline
position following overnight's momentum failure below 2.6328, with a recovery
above 2.8172 required to negate this call, reaffirm the recovery and re-expose
potentially significant gains thereafter. For intermediate- and
longer-term players, a bullish policy and exposure remain advised with a
failure below 2.4822 required to threaten this call enough to warrant
neutralizing exposure. We will be watchful for another bearish divergence
in momentum following a recovery attempt that falls short of Fri's 2.8172 high
that would be considered the next reinforcing factor to a count calling that
2.8172 high the prospective end to the month-and-a-half 2nd-Wave
correction. In lieu of such, a resumption of the current rally to
eventual new highs above 2.8172 should not surprise.
Economy - Futures Market Outlook w/John Caruso - 11/13/2020
Futures Market Outlook w/John Caruso - 11/13/2020
By: John Caruso, Senior Market StrategistPosted Nov 13, 2020 10:03AM CT
The USD has finally found some resistance, back down -0.16%
this morning, while risk assets roll-up.
Metals: Copper +0.60%, Platinum joining in +1.41%, Gold and Silver +0.92% and +1.99% respectively. Copper specifically looks to be on a solid path to 3.30 as US inflation (and Chinese growth) continues to accelerate.
10yr yields back -10bps day/day. We’ve removed Bonds from our basket of long ideas, and will likely make its way onto the “Sell” list. Inflation will (and already is) be accounted for and expressed via rising rates at the long end of the curve. Don’t be surprised to see a “Sell 10yr Notes” trade pop up in your email soon.
Oil- pulling back, be ready here. We still may take a peak under 40 – but I may not wait. Sometimes its OK to be early, so long as you have the trend in your corner. We’re not going to “nail” every top and bottom, that’s just not realistic. We’ll keep our positions small, and trade with the overall trend, which moved to bullish again earlier this week.
Producer Price Index PPI accelerated y/y from 0.4 to 0.5 –
Inflation accelerating
If you haven’t already learned by now, the economy is NOT the market and visa versa. Unfortunately for most of this country, they don’t have the wherewithal to purchase risk assets (or short the USD) that help them offset the burden of rising inflation costs. For most of America, they punch their time clock in the morning, and punch out at the end of the day. And while it’s nice to get a stimulus check in the mail or extra unemployment benefits every week, don’t for a second think that that doesn’t come with a price. Inflation. This has been ongoing since June, following the crash in March, and this is likely to persist through the first half of next year according to our forecast.
If you have any questions or would like to discuss the markets further, please feel free to contact me at 800-669-5354 or jcaruso@rjofutures.com.