Energy is something that has been traded and used since the dawn of man and is continually used by billions around the world today. We have assembled this kit with goal of informing you how to make money off these precious commodities. The Energy Investor Kit is complete with detailed fundamental and technical analysis on the energy sector and will teach you how to navigate these ever important and potentially lucrative markets.
RJO Futures PRO Trading Platform
FREE 100k Simulated Trading Account
Experience a trading platform like no other with integrated tools to seamlessly trade and monitor the markets. With a free simulated trading account and personal broker experience, we’ll teach you about futures trading and help you develop a trading strategy.
The Markets
Metals - Gold is Now Broker
Gold is Now Broker
By: Joshua GravesPosted 11/25/2020
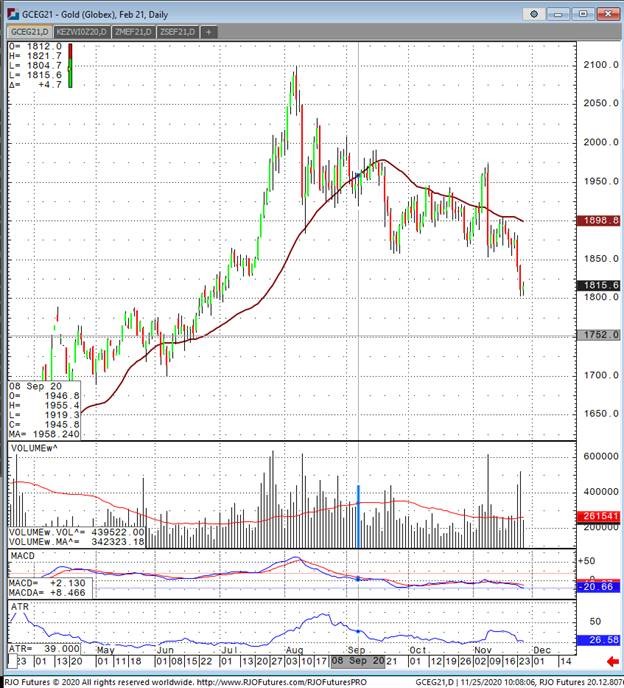
After writing about gold market price action looking weak recently, the market has confirmed my suspicions that precious metals in general continue to look weak, and the weakest of them all being gold. Let’s once again take the noise out of the market and simply look at the technical aspect of how gold is trading. It’s a no brainer that once gold broke a multi month low on Monday at around 1850 (a number I’m sure many traders were watching) the market immediately pushed well through 1800 and even into seven handle range on the December contract. It’s not totally over for gold, there is still some strong support at 1750-1775, but if those get taken out a move to 1700 seems inevitable. I would be positioning myself for a strong selloff soon and covering the position to see how price action trades at around 1750. This is all done on the February contract in gold futures. The only way for me to be bullish gold at this point would be for a significant rally, and close, above 1925. This would be at least giving the bulls a scenario where we are back above 1900, and in a meaningful amount. We would also be above the recent multi week high of just over 1900. Fundamentals are taking a back seat in my opinion, trade the charts.
Gold Feb '21 Daily ChartMetals - Silver is Range-Bound
Silver is Range-Bound
By: Eli Tesfaye, Senior Market StrategistPosted Nov 25, 2020 10:58AM CT
Eli Tesfaye discusses the latest news moving a range-bound silver contrct as it still awaits news on a stimulus package. If you have any questions or would like to discuss the markets further, please feel free to contact me at 800-367-7290 or etesfaye@rjofutures.com. Energy - Oil Continues Advance on Vaccine Optimism
Oil Continues Advance on Vaccine Optimism
By: Alex Turro, Senior Market StrategistPosted Nov 25, 2020 9:22AM CT
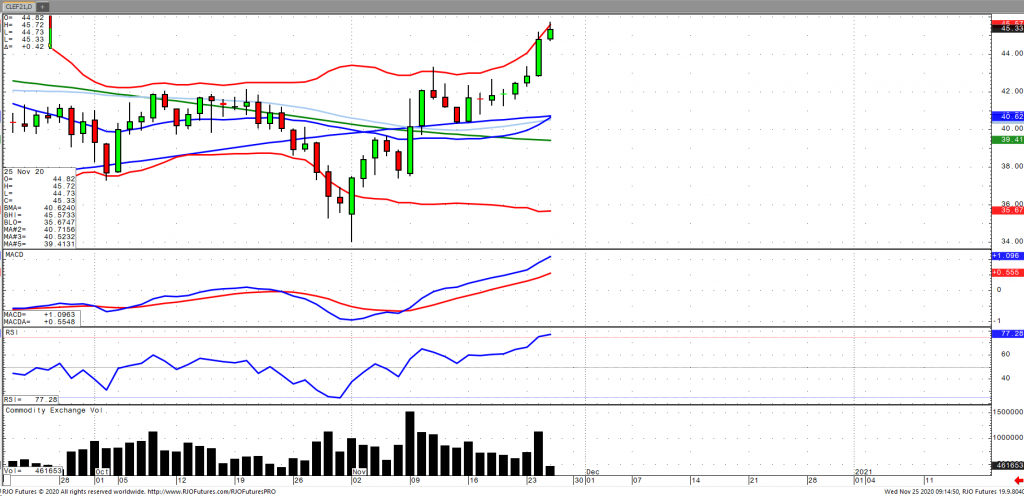
Oil has continued its advance moving to its highest price since March, rallying nearly 10% in the last four sessions on ongoing vaccine optimism suggesting a turn in economic recovery and subsequent boost in fuel demand. In addition, further support may have been drafted from reports that Chinese oil demand in October rose nearly 1% higher than year ago levels. OPEC+ are set to meet Nov. 30 to Dec. 1 with an expectation of a rollover of cuts of at least 3 months from January. Weekly inventories came in with a surprise jump of 3.8 million barrels. Fueling more of the optimism is that the market is now in backwardation signaling higher expected consumption. Oil continues to remain bullish trend as it takes its inflation higher with today’s range seen between 40.98 – 45.75.
Crude Oil Jan '21 Daily Chart If you have any questions or would like to discuss the markets further, please feel free to contact me at 800-438-4805 or aturro@rjofutures.com. Softs - Cocoa Futures' Prices Pull Back Ahead of Thanksgiving Holiday
Cocoa Futures' Prices Pull Back Ahead of Thanksgiving Holiday
By: Peter MoosesPosted 11/25/2020
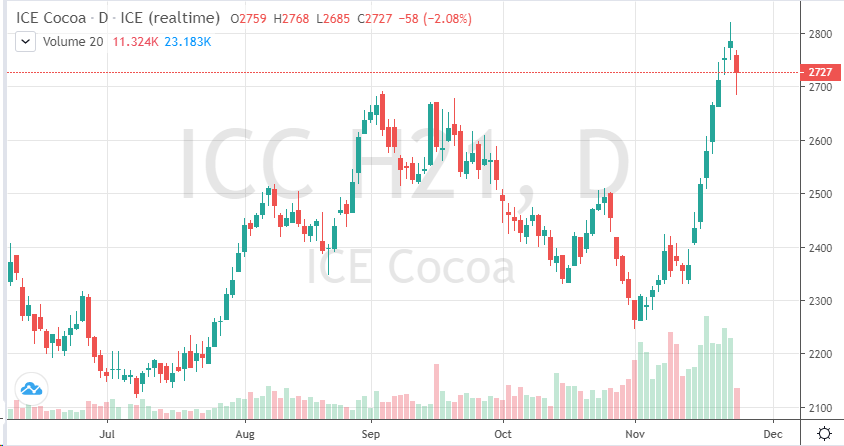
Cocoa futures have retreated after recent highs. March cocoa futures broke above 2800 but failed to hold as traders took profits heading into the Thanksgiving holiday. As news broke that Europe would be easing its Covid-19 restrictions in certain areas the hope that cocoa demand would rise has supported the market this week. If businesses have “soft” re-openings and chocolate sales increase – cocoa prices could end the year above 2800.
The latest cocoa rally could also thank the recent announcements from multiple vaccine providers that they are getting closer to releasing their versions. The equity markets like the news, which carried over to most major commodities. Vaccines lead to re-openings of businesses, schools, restaurants and lifts on travel restrictions – all supportive to higher commodity prices. Technically, the chart is vulnerable to a sell-off after a major move this high, this quick. The news that caused this rally is positive for the long-term trade, but nothing certain in the short-term, so expect volatility through the end of the year.
On
the heels of mid-Sep-to-early-Oct's steeper, accelerated, 3rd-wave-looking
recovery, the past week-and-a-half's boringly lateral chop is first considered
a corrective/consolidative event that warns of a continuation of the uptrend
that preceded it to new highs above 04-Oct's 891.0 high. This count
remains consistent with our broader base/correction/recovery count introduced
in 13-Sep's Technical Blog following that
day's bullish divergence in short-term momentum above 07-Sep's 809.5 minor
corrective high detailed in the hourly chart below.
The
important takeaway from this month's lateral, sleepy price action is the
definition of Wed's 851.5 low as
the end or lower boundary of a suspected 4th-Wave correction. A failure
below 851.5 will confirm a bearish divergence in daily momentum and defer or
threaten a bullish count enough to warrant non-bullish decisions like
long-covers. A failure below 851.5 will not
necessarily negate a broader bullish count, but it will threaten it enough to
warrant defensive measures as the next pertinent technical levels below 851.5 are
13-Sep's prospective minor 1st-Wave high at 813.8 and obviously 08-Sep's 766.0
low. And making non-bullish decisions "down there" is
sub-optimal to say the least. Per such, both short- and longer-term
commercial traders are advised to pare or neutralize bullish exposure on a
failure below 851.5, acknowledging and accepting whipsaw risk- back above 04-Oct's
891.0 high- in exchange for much deeper and sub-optimal nominal risk below
766.0.
On
a broader scale, the daily log scale chart above shows the developing potential
for a bearish divergence in daily momentum that will be considered confirmed
below 851.5. This chart also shows the past month's recovery thus far
stalling in the immediate neighborhood of the (888.0) Fibonacci
minimum 38.2% retrace of Apr-Sep's entire 1128 - 766 decline). COMBINED
with a failure below 851.5, traders
would then need to be concerned with at least a larger-degree correction pf the
past month's rally and possibly a resumption of Apr-Sep's major downtrend.
Until
and unless the market fails below 851.5 however, we would
remind longer-term players of the key elements on which our bullish count is
predicated:
a confirmed bullish divergence in WEEKLY momentum
(below)
amidst
an
historically low 11% reading in out RJO Bullish Sentiment Index and
a
textbook complete and major 5-wave Elliott sequence down from 29-Apr's
1128 high to 08-Sep's 766.0 low.
Thus
far, the market is only a month into correcting a 4-MONTH, 32% drawdown, so
further and possibly protracted gains remain well within the bounds of a major
(suspected 2nd-Wave) correction of Apr-Sep's decline within an even more
massive PEAK/reversal process from 17-May's 1219 high on an active continuation
basis below.
These
issues considered, a bullish policy and exposure remain advised with a failure
below 851.5 required to defer or threaten this call enough to warrant moving to
a neutral/sideline position. In lieu of such weakness, we anticipate a
continuation of the past month's rally to new highs and potentially significant
gains above 891.0.
Agricultural - Grain Futures Update w/Stephen Davis - 11/25/2020
Grain Futures Update w/Stephen Davis - 11/25/2020
By: Stephen DavisPosted 11/25/2020
Stephen Davis discusses the latest news moving the grain markets. Corn is trending much higher, but soybeans could go lower as China claims they will not be buying U.S. soy.Agricultural - Live Cattle Trading High
Live Cattle Trading High
By: Peter McGinnPosted 11/25/2020
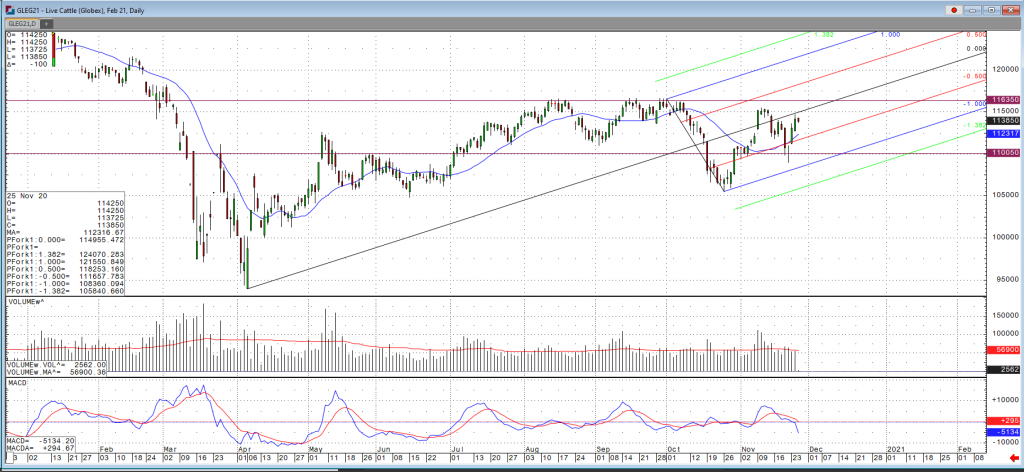
The cattle market has traded at it’s highest levels since the late spring Covid-19 rally. This recent runup in prices has traders optimistic that the packers will come in and start bidding up cash live cattle this week. The cold storage report was a bit bearish but the market had shrugged off that news and concentrated on the strong cash news. The USDA boxed beef cutout was up $2.69 at mid-session yesterday and closed $2.70 higher at $244.30. This was up from $233.72 the previous week and the highest the market has been since June 9. If you disregard May's Covid rally to a record-high $475.39, prices are at their highest since March and are approaching their second highest since June 2017. The USDA estimated cattle slaughter came in at 122,000 head yesterday. This brings the total for the week so far to 242,000 head, up from 240,000 last week and 229,000 a year ago. Cash live cattle trade is starting out slow this week. As of Tuesday afternoon, the only location reporting was Iowa/Minnesota, which had 1,249 head trading at 109-110 and an average price of 109.74. A strong beef price trend is keeping a bid under the live cattle market. February support is at 111.27, with resistance at 115.45. Look for choppy to higher trade short-term.
Live Cattle Feb '21 Daily ChartEquity - Stocks Mixed Ahead of Thanksgiving
Stocks Mixed Ahead of Thanksgiving
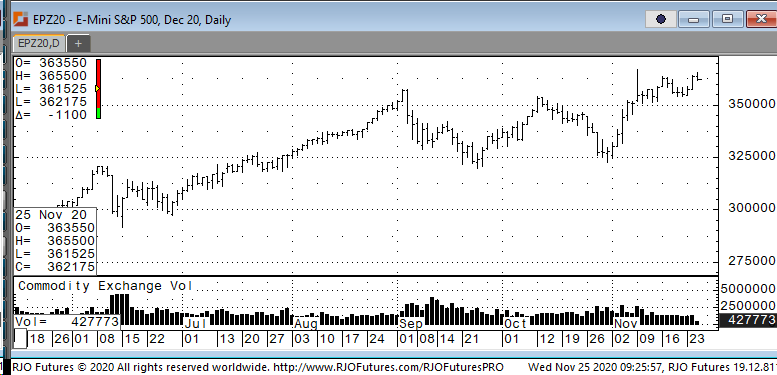
By: Jeff Yasak, Senior Market StrategistPosted Nov 25, 2020 9:30AM CT
The U.S. stock markets are mixed this
morning with a dip in the Dow and a Nasdaq rally.
The markets opened today with the Dow
taking a break after it traded above 30,000 on Tuesday and the Nasdaq climbing
above 12,000. The market reacted to
government numbers released today before the Holiday. The Department of Labor reported jobless
claims had risen to 778,000 opposed to an economic prediction of 730,000. The
Commerce Department also released their own data with numbers on GDP and
durable goods. GDP growth was stable
with 33.1% annualized rate, the deepest since the government started keeping
this data in 1947. Durable goods orders were higher than expected up 1.3%% in
October which was below September’s 2.1% but well above the .09% predicted
number. New home sales fell by 0.3% to
an adjusted rate of 999,000 units last month, although lower than last month it
still beat expectations by 27,000.
Have a healthy and safe Thanksgiving.
Support is checking in today at 360000 and 355500 with resistance at 366500 and 368500.
E-mini S&P 500 Dec '20 Daily Chart If you have any questions or would like to discuss the markets further, please feel free to contact me at 888-861-1656 or jyasak@rjofutures.com. Economy - S-T Mo Failure Insufficient to End RBOB Correction, But Beware
S-T Mo Failure Insufficient to End RBOB Correction, But Beware
By: RJO Market InsightsPosted 11/08/2022
Posted on Nov 08, 2022, 07:51 by Dave Toth
In Fri's Technical Webcast we identified a
minor corrective low at 2.6328 from Thur as a mini risk parameter the market
needed to sustain gains above to maintain a more immediate bullish count.
The 240-min chart below shows the market's failure overnight below this level,
confirming a bearish divergence in very short-term momentum. This mo
failure defines Fri's 2.8172 high as
one of developing importance and a parameter from which very short-term traders
can objectively base non-bullish decisions like long-covers.
Given
the magnitude of the past three weeks' broader recovery however, this
short-term momentum failure is of an insufficient scale to conclude anything
more than another correction within this broader recovery from 26-Sep's 2.1877
low. Indeed, overnights failure below 2.6328 only allows us to conclude
the end of the portion of the month-and-a-half rally from 31-Oct's 2.4822 next
larger-degree corrective low. 2.4822 is the
risk parameter this market still needs to fail below to break the uptrend from
18-Oct's 2.3526 low while this 2.3526 low
remains intact as the risk parameter this market needs to fail below to break
the month-and-a-half uptrend. From an
intermediate-to-longer-term perspective, this week's setback falls well within
the bounds of another correction ahead of further gains. This is another
excellent example of the importance of technical and trading SCALE and
understanding and matching directional risk exposure to one's personal risk
profile.
The
reason overnight's admittedly minor mo failure might have longer-term
importance is the 2.8172-area from which it stemmed. In
Fri's Technical Blog we also noted the market's engagement of the
2.8076-to-2.8159-area marked by the 61.8% retrace of Jun0-Sewp's 3.2758 -2.1877
decline and the 1.000 progression of Sep-Oct's initial 2.1877 - 2.6185
(suspected a-Wave) rally from 18-Oct's 2.3526 (suspected b-Wave) low. We
remind longer-term players that because of the unique and compelling confluence
of:
early-Aug's bearish divergence in WEEKLY momentum
amidst
historically
extreme bullish sentiment/contrary opinion levels in our RJO Bullish
Sentiment Index
an
arguably complete and massive 5-wave Elliott sequence from Mar'20's 0.4605
low to Jun's 4.3260 high (as labeled in the weekly log active-continuation
chart below) and
the
5-wave impulsive sub-division of Jun-Sep's (suspected initial 1st-Wave) decline
The
recovery attempt from 26-Sep's 2.1877 low is arguably only a 3-wave (Wave-2)
corrective rebuttal to Jun-Sep's decline within a massive, multi-quarter
PEAK/reversal process. Now granted, due to the magnitude of 2020 -2022's
secular bull market, we discussed the prospect for this (2nd-Wave corrective)
recovery to be "extensive" in terms of both price and time. A
"more extensive" correction is typified by a retracement of 61.8% or
more and spanning weeks or even months following a 3-month decline. Per
such, the (suspected corrective) recovery from 26-Sep's 2.1877 low could easily
have further to go, with commensurately larger-degree weakness than that
exhibited this week (i.e., a failure below at least 2.4822) required
to consider the correction complete. Indeed, the daily log chart above
shows the market thus far respecting former 2.6185-area resistance from 10-Oct
as a new support candidate.
These
issues considered, very shorter-term traders have been advised to move to a neutral/sideline
position following overnight's momentum failure below 2.6328, with a recovery
above 2.8172 required to negate this call, reaffirm the recovery and re-expose
potentially significant gains thereafter. For intermediate- and
longer-term players, a bullish policy and exposure remain advised with a
failure below 2.4822 required to threaten this call enough to warrant
neutralizing exposure. We will be watchful for another bearish divergence
in momentum following a recovery attempt that falls short of Fri's 2.8172 high
that would be considered the next reinforcing factor to a count calling that
2.8172 high the prospective end to the month-and-a-half 2nd-Wave
correction. In lieu of such, a resumption of the current rally to
eventual new highs above 2.8172 should not surprise.
Economy - Futures Market Outlook w/John Caruso - 11/25/2020
Futures Market Outlook w/John Caruso - 11/25/2020
By: John Caruso, Senior Market StrategistPosted Nov 25, 2020 8:53AM CT
What a year it’s been so far…
With approximately 1 month and a few days left of 2020, it’s definitely been a year to count your blessings and give thanks. When you look back upon the year that we’ve had, you come to realize the many misfortunes bestowed upon people across the world. I think it’s always important to look around you and be thankful for not only what you have in life, but also the PEOPLE you have in your life. For me, I’m just simply a flawed human being, putting one foot in front of the other, trying to do my job better than the day before. And of course I’m thankful for the opportunity not only that RJ O’Brien gives me, but also the confidence that you’ve bestowed upon me. As we barrel into year end, with the markets having come full circle, and seemingly (we hope) the virus as well, there’s plenty to be thankful for in terms of family, friends, and maybe most of all this year, your health. So, during your Turkey Day toasts be sure to know how lucky you are, and don’t be afraid to express your gratitude!
Jobless claims +778K vs +730K last week - net +48K w/w
– certainly not a positive development
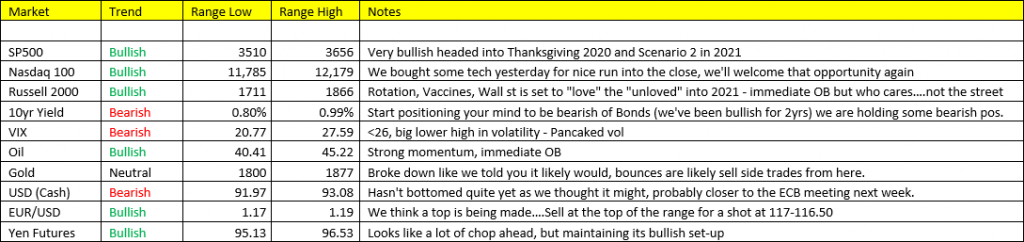
Stocks/Commodities: a very bullish set-up into the holiday, however some caution should be warranted as we’re beginning to build heavy implied vol DISCOUNTS in SPY, and NQ. Typically a classic “complacency” signal that may present some downside trading action into early December. You should welcome that opportunity, because we believe it will be a fantastic buying opportunity into year end. Our call stands for Growth and Inflation accelerating into 2021, and will likely stand through the first half of next year. You must remember, in 1H2021 Macro data and Corporate profits and earnings data will be comparing y/y to the 1H of 2020 aka the pandemic lows of the market. This could be very bullish in terms of risk assets. Utilize our levels below for your entry and exit points, and please feel free to reach out if you have questions.
Drink up, eat up, and we’ll catch you next week!
If you have any questions or would like to discuss the markets further, please feel free to contact me at 800-669-5354 or jcaruso@rjofutures.com.