Energy is something that has been traded and used since the dawn of man and is continually used by billions around the world today. We have assembled this kit with goal of informing you how to make money off these precious commodities. The Energy Investor Kit is complete with detailed fundamental and technical analysis on the energy sector and will teach you how to navigate these ever important and potentially lucrative markets.
RJO Futures PRO Trading Platform
FREE 100k Simulated Trading Account
Experience a trading platform like no other with integrated tools to seamlessly trade and monitor the markets. With a free simulated trading account and personal broker experience, we’ll teach you about futures trading and help you develop a trading strategy.
The Markets
Metals - Gold is Laying a Trap
Gold is Laying a Trap
By: Joshua GravesPosted 12/11/2020
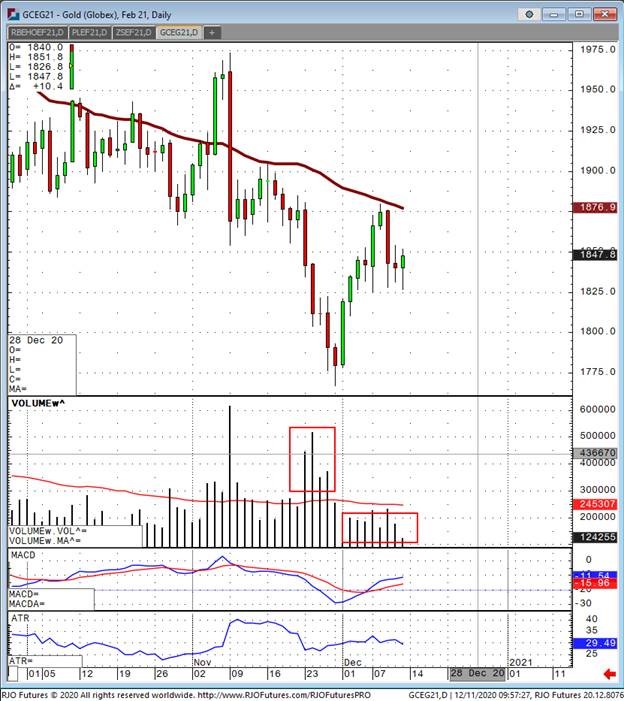
Feb gold futures have jumped significantly off the recent lows, but this is simply a trap in my opinion that is fooling traders into thinking this rally is for real. Could it be real? Yes, the answer is absolutely but not likely. There is always a calling card for big reversals in any commodity market. Volume is the single most significant indicator that managed money types simply can’t hide. If you look at the volume when gold recently hit 1767, the daily moves downward showed volume exceeding two times the daily average of 245,000 futures contracts. This to me shows confidence in a move lower. Gold moved well off those upper 1700 lows in short order, but on volume that still today has not once even hit the average trade volume. There were multiple days where volume was lucky to hit 130,000 contracts traded. Fundamentals of gold are not really something to follow right now as it seems whichever way the wind blows in the news that day is considered a “fundamental.” We will likely get stimulus at some point in the next month or so, and that’s already been priced into gold in my opinion. It’s a supportive factor don’t get me wrong as it’s a boost for inflation, but it’s not something I’m going to sit back and trade day to day on. Traders should be watching gold for a long only if can take out 1900 and get a close above 1915.
Gold Feb '21 Daily ChartMetals - Silver Outlook - 12/11/2020
Silver Outlook - 12/11/2020
By: Adam TuiaanaPosted 12/11/2020
Adam shares observations of Silver in well-defined range.Energy - Oil Set for Sixth Weekly Gain
Oil Set for Sixth Weekly Gain
By: Alex Turro, Senior Market StrategistPosted Dec 11, 2020 9:29AM CT
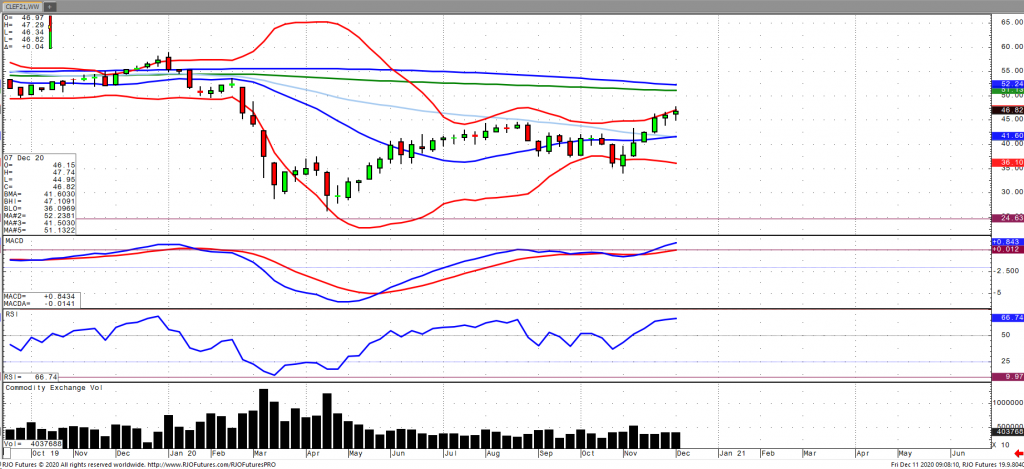
Oil prices are correcting slightly here in the early session but are poised to make its sixth consecutive weekly gain amid continued optimism regarding vaccine rollouts and subsequent recovery in fuel demand. This comes despite a massive build in inventories of 15.2 million barrels versus an expected 1.4 million drop, according to the EIA as well as considerable inflows of product readings. Some support may have been garnered by reports of an attack on an Iraqi oil field earlier in the week in addition to some uncertainty regarding Nigerian oil supply. Further, strong vehicle sales out of China suggest an uptick in demand prospects. Oil has continued its inflation higher as it remains bullish trend with today’s range seen between 44.33 – 46.95.
Crude Oil Jan '21 Weekly Chart If you have any questions or would like to discuss the markets further, please feel free to contact me at 800-438-4805 or aturro@rjofutures.com. Softs - 2021 Cocoa Demand Could Look Different
2021 Cocoa Demand Could Look Different
By: Peter MoosesPosted 12/11/2020
As
we near the end of 2020, analysts start to dissect and predict certain
possibilities in the new year. Will cocoa demand be up? What will production
data be? Will a Covid vaccine speed up the “back to normal process?”
Many
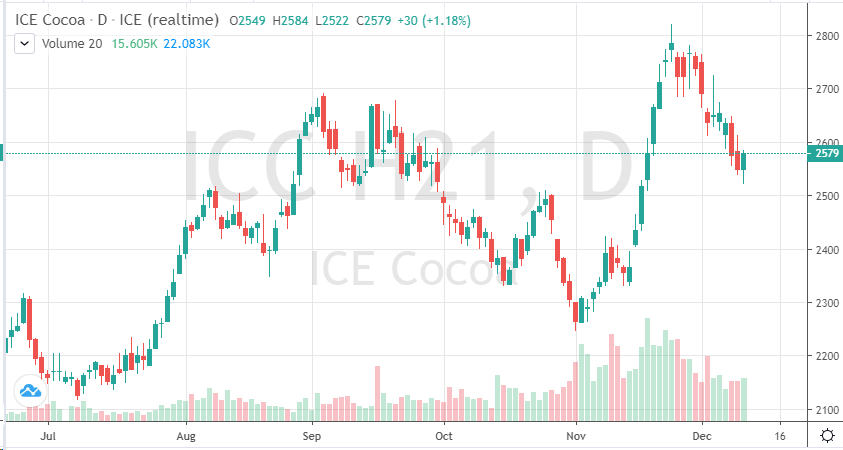
of cocoa’s 2020 stories have been on repeat. 2021 can see cocoa prices test
highs. Cocoa prices are very much demand driven. In a down year for many commodities,
cocoa was able to find a few big rallies higher when the fundamentals where
working with the technicals. If chocolate companies start the new year with
better than expected earnings, we can see cocoa trade back towards 2800, we
were just there in the March contract. If Q1 can give us direction on the
production numbers, 3000 is completely possible by mid-year.
The
unknowns, outside of the virus discussion, that could help a cocoa price rally
are a few key indicators for the soft– what happens with the Brexit? What
levels will the Euro and Pound trade? Will unrest in Ivory Coast, West Africa
affect output?
With all those factors waiting to be discovered, cocoa is a market that will volatile in the coming year.
On
the heels of mid-Sep-to-early-Oct's steeper, accelerated, 3rd-wave-looking
recovery, the past week-and-a-half's boringly lateral chop is first considered
a corrective/consolidative event that warns of a continuation of the uptrend
that preceded it to new highs above 04-Oct's 891.0 high. This count
remains consistent with our broader base/correction/recovery count introduced
in 13-Sep's Technical Blog following that
day's bullish divergence in short-term momentum above 07-Sep's 809.5 minor
corrective high detailed in the hourly chart below.
The
important takeaway from this month's lateral, sleepy price action is the
definition of Wed's 851.5 low as
the end or lower boundary of a suspected 4th-Wave correction. A failure
below 851.5 will confirm a bearish divergence in daily momentum and defer or
threaten a bullish count enough to warrant non-bullish decisions like
long-covers. A failure below 851.5 will not
necessarily negate a broader bullish count, but it will threaten it enough to
warrant defensive measures as the next pertinent technical levels below 851.5 are
13-Sep's prospective minor 1st-Wave high at 813.8 and obviously 08-Sep's 766.0
low. And making non-bullish decisions "down there" is
sub-optimal to say the least. Per such, both short- and longer-term
commercial traders are advised to pare or neutralize bullish exposure on a
failure below 851.5, acknowledging and accepting whipsaw risk- back above 04-Oct's
891.0 high- in exchange for much deeper and sub-optimal nominal risk below
766.0.
On
a broader scale, the daily log scale chart above shows the developing potential
for a bearish divergence in daily momentum that will be considered confirmed
below 851.5. This chart also shows the past month's recovery thus far
stalling in the immediate neighborhood of the (888.0) Fibonacci
minimum 38.2% retrace of Apr-Sep's entire 1128 - 766 decline). COMBINED
with a failure below 851.5, traders
would then need to be concerned with at least a larger-degree correction pf the
past month's rally and possibly a resumption of Apr-Sep's major downtrend.
Until
and unless the market fails below 851.5 however, we would
remind longer-term players of the key elements on which our bullish count is
predicated:
a confirmed bullish divergence in WEEKLY momentum
(below)
amidst
an
historically low 11% reading in out RJO Bullish Sentiment Index and
a
textbook complete and major 5-wave Elliott sequence down from 29-Apr's
1128 high to 08-Sep's 766.0 low.
Thus
far, the market is only a month into correcting a 4-MONTH, 32% drawdown, so
further and possibly protracted gains remain well within the bounds of a major
(suspected 2nd-Wave) correction of Apr-Sep's decline within an even more
massive PEAK/reversal process from 17-May's 1219 high on an active continuation
basis below.
These
issues considered, a bullish policy and exposure remain advised with a failure
below 851.5 required to defer or threaten this call enough to warrant moving to
a neutral/sideline position. In lieu of such weakness, we anticipate a
continuation of the past month's rally to new highs and potentially significant
gains above 891.0.
Agricultural - Grain Futures Update w/Stephen Davis - 12/11/2020
Grain Futures Update w/Stephen Davis - 12/11/2020
By: Stephen DavisPosted 12/11/2020
Stephen Davis discusses the latest news moving the grain markets including some interesting moves following last week's report.Agricultural - Live Cattle Looking Shaky in 2021
Live Cattle Looking Shaky in 2021
By: Peter McGinnPosted 12/11/2020
The USDA came out with their WASDE report yesterday with
their expectations for the 2021 year. Overall for the cattle markets show a
lower price target for the first quarter of 2021 while the Q2 expectations for
supply look to dry up and production looks to slow down and a rise going
forward. The actual projections for Q2 production were lowered 1.8% and this
seems to reflect the OCT cattle on feed placement number. The supply
projections seem to be in line with the fed cattle values, which look strong
come next spring. They do raise the question of what South America will do in
terms of import numbers. With COVID restrictions possibly in play, come Feb 1st
we will have a clearer picture of what our relationship with China will be,
which would answer some questions as far as the demand coming from them.
Although a possible vaccine for COVID seems like it is
coming and people do expect the demand to increase because of that, but it
doesn’t seem to carry much weight/or have that much of an impact that would
change the outlook for the overall market production. The USDA estimated cattle
slaughter came in at 120,000 head yesterday. This brings the total for the week
so far to 474,000 head, down from 481,000 last week and down from 491,000 a
year ago. US beef export sales for the week ending December 3 came in at 2,989
tonnes for 2020 and 12,028 for 2021 for a total of 15,017. This was down from
16,912 the previous week and a four-week average of 19,416. In Nebraska
1,962 head traded at 106-107 and an average price of 106.54, down from an
average of 109.88 last week and 110.64 the week before that.
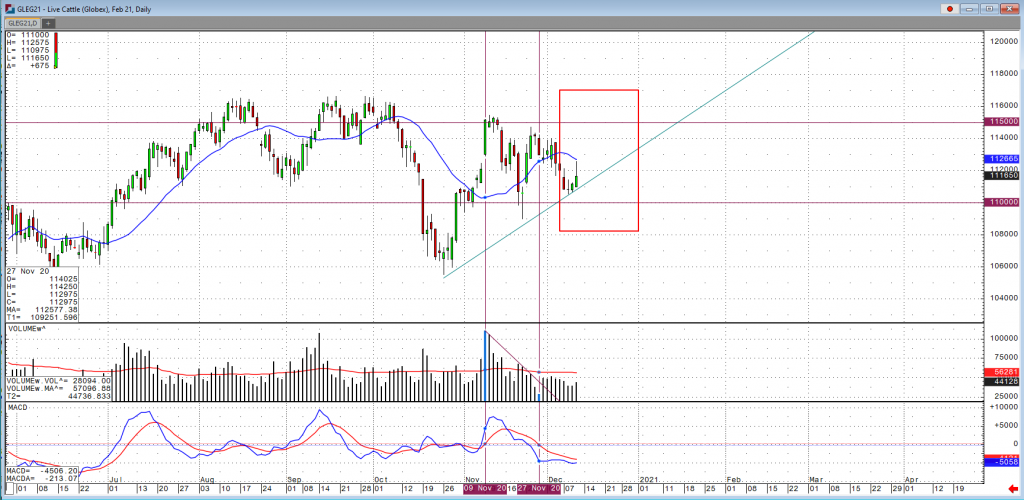
If Feb futures breakdown below the $110 level we could see the basis narrow and trade near the $108 level. The near-term resistance $114 but the $116 level has shown to be very strong resistance so if by chance we even get through $114 there would have to be pretty drastic change in supply for Feb cattle to trade above $116.
Live Cattle Feb '21 Daily ChartEquity - Stocks Lower with Stimulus Talks Stalling Again
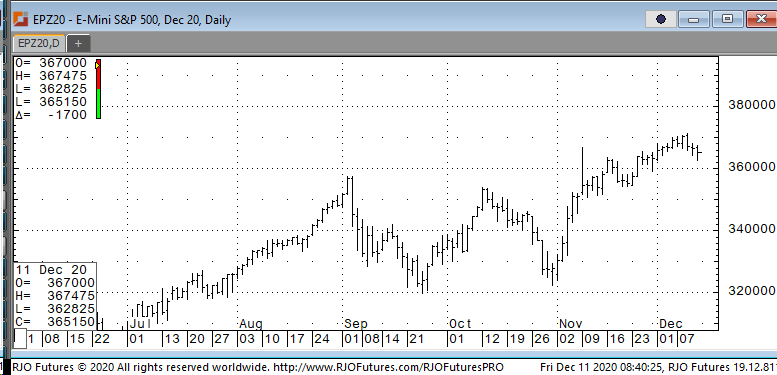
Stocks Lower with Stimulus Talks Stalling Again
By: Jeff Yasak, Senior Market StrategistPosted Dec 11, 2020 9:25AM CT
U.S. stock futures
are trading lower this morning with the Covid-19 stimulus talks stalling once
again. There were some positive signs
that the bipartisan stimulus deal, roughly 900 billion, was going to pass but
they could not reach an agreement on some aspects of the deal. The stimulus package has largely been priced
in the market so any negative news should hit the market harder than a positive
reaction to good news. “There is a
nontrivial chance that we get a deal in the coming weeks,” said Jeff Mills the
chief investment officer of Bryn Mawr Trust,” if it doesn’t come by late
January, when the new congress is sworn in, then I think we could see markets
starting to get a bit nervous.” Without this
new stimulus package millions of Americans could lose their unemployment
benefits starting the new year. Weekly
jobless claims also increased to 853,000 this past week, the highest since
Sept. 19th , as new lockdown orders took its toll on businesses from
new corona virus cases.
Support is checking in today at 364000 and 362000 with resistance showing 368000 and 370000.
E-mini S&P 500 Dec '20 Daily Chart If you have any questions or would like to discuss the markets further, please feel free to contact me at 888-861-1656 or jyasak@rjofutures.com. Economy - S-T Mo Failure Insufficient to End RBOB Correction, But Beware
S-T Mo Failure Insufficient to End RBOB Correction, But Beware
By: RJO Market InsightsPosted 11/08/2022
Posted on Nov 08, 2022, 07:51 by Dave Toth
In Fri's Technical Webcast we identified a
minor corrective low at 2.6328 from Thur as a mini risk parameter the market
needed to sustain gains above to maintain a more immediate bullish count.
The 240-min chart below shows the market's failure overnight below this level,
confirming a bearish divergence in very short-term momentum. This mo
failure defines Fri's 2.8172 high as
one of developing importance and a parameter from which very short-term traders
can objectively base non-bullish decisions like long-covers.
Given
the magnitude of the past three weeks' broader recovery however, this
short-term momentum failure is of an insufficient scale to conclude anything
more than another correction within this broader recovery from 26-Sep's 2.1877
low. Indeed, overnights failure below 2.6328 only allows us to conclude
the end of the portion of the month-and-a-half rally from 31-Oct's 2.4822 next
larger-degree corrective low. 2.4822 is the
risk parameter this market still needs to fail below to break the uptrend from
18-Oct's 2.3526 low while this 2.3526 low
remains intact as the risk parameter this market needs to fail below to break
the month-and-a-half uptrend. From an
intermediate-to-longer-term perspective, this week's setback falls well within
the bounds of another correction ahead of further gains. This is another
excellent example of the importance of technical and trading SCALE and
understanding and matching directional risk exposure to one's personal risk
profile.
The
reason overnight's admittedly minor mo failure might have longer-term
importance is the 2.8172-area from which it stemmed. In
Fri's Technical Blog we also noted the market's engagement of the
2.8076-to-2.8159-area marked by the 61.8% retrace of Jun0-Sewp's 3.2758 -2.1877
decline and the 1.000 progression of Sep-Oct's initial 2.1877 - 2.6185
(suspected a-Wave) rally from 18-Oct's 2.3526 (suspected b-Wave) low. We
remind longer-term players that because of the unique and compelling confluence
of:
early-Aug's bearish divergence in WEEKLY momentum
amidst
historically
extreme bullish sentiment/contrary opinion levels in our RJO Bullish
Sentiment Index
an
arguably complete and massive 5-wave Elliott sequence from Mar'20's 0.4605
low to Jun's 4.3260 high (as labeled in the weekly log active-continuation
chart below) and
the
5-wave impulsive sub-division of Jun-Sep's (suspected initial 1st-Wave) decline
The
recovery attempt from 26-Sep's 2.1877 low is arguably only a 3-wave (Wave-2)
corrective rebuttal to Jun-Sep's decline within a massive, multi-quarter
PEAK/reversal process. Now granted, due to the magnitude of 2020 -2022's
secular bull market, we discussed the prospect for this (2nd-Wave corrective)
recovery to be "extensive" in terms of both price and time. A
"more extensive" correction is typified by a retracement of 61.8% or
more and spanning weeks or even months following a 3-month decline. Per
such, the (suspected corrective) recovery from 26-Sep's 2.1877 low could easily
have further to go, with commensurately larger-degree weakness than that
exhibited this week (i.e., a failure below at least 2.4822) required
to consider the correction complete. Indeed, the daily log chart above
shows the market thus far respecting former 2.6185-area resistance from 10-Oct
as a new support candidate.
These
issues considered, very shorter-term traders have been advised to move to a neutral/sideline
position following overnight's momentum failure below 2.6328, with a recovery
above 2.8172 required to negate this call, reaffirm the recovery and re-expose
potentially significant gains thereafter. For intermediate- and
longer-term players, a bullish policy and exposure remain advised with a
failure below 2.4822 required to threaten this call enough to warrant
neutralizing exposure. We will be watchful for another bearish divergence
in momentum following a recovery attempt that falls short of Fri's 2.8172 high
that would be considered the next reinforcing factor to a count calling that
2.8172 high the prospective end to the month-and-a-half 2nd-Wave
correction. In lieu of such, a resumption of the current rally to
eventual new highs above 2.8172 should not surprise.
Economy - Futures Market Outlook w/John Caruso - 12/11/2020
Futures Market Outlook w/John Caruso - 12/11/2020
By: John Caruso, Senior Market StrategistPosted Dec 11, 2020 8:47AM CT
I’m not sure what the narrative is going to be, all that I
know is that there will be one….
Studying macro cycles for 2 decades now, it’s funny how the
“news” and “narratives” presented on CNBC and in the WSJ seem to always fit
perfectly to the tune of markets. When we make a call for “Scenario 4”,
its not because we’ve reached into our bag of “narratives” and pulled one out
and said LOOK, here’s the political or geopolitical reason why we’re making
this call. Absolutely not…It’s the data, it’s always about the DATA, and
the news, coincidentally just some how ultimately cozies up right next to it.
Whenever we’ve been wrong on calling a turn in the cycle, it’s not because our
“narrative” is incorrect, it’s because the incoming data doesn’t match up with
our forecasts, and back tests better or worse on a 1 yr and 2yr lookback.
Yes I said we’ve been wrong in the past, and we’ll be wrong again – have you
ever heard another financial asset manager say that before? Certainly not
on CNBC or Twitter that’s for sure, where everyone’s batting 1.000% of course
(at least we’re showing our work). This is why our process is
multi-faceted. We’re consistently checking not only our view of the
market cycle as it relates to the incoming data, but also our quantitative
methods in measuring multi-duration trend changes in markets. 9/10 times
the quantitative signal turns first, followed by the data, i.e. a bullish to
bearish or bearish to bullish phase transition.
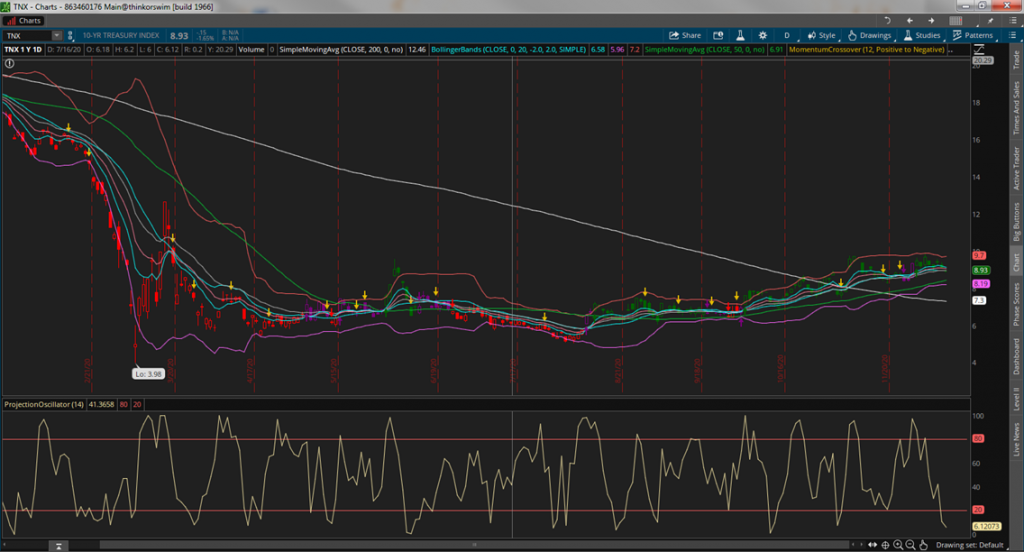
Speaking of bullish to bearish phase transitions, here’s a
look at the 10yr yield with some bullet points below of what we see…..
*First thing you notice is probably the massive drop over
the past 2yrs from the cycle peak of 3.25% in Q3 of 2018. Yes Q3 2018 was
when the cycle peaked in bonds and subsequently the economy.
*Secondly, the range analysis shown, which is a reflection
of price and volatility….you can see how wide the ranges were on the left side
of the chart – that’s sign of elevated volatility which is a BEARISH indicator
for price…we all knew that though.
*Third, check out the momentum indicator, which changes from
Red (Negative) to Purple (Neutral), to Green (Positive) coupled with a
NARROWING range….hmm, how about that. Not to mention the trend has also
shifted to now pointing (albeit slowly) to the upside. Turns in the bond
market are like an Oil tanker turning in the ocean…it happens very slowly and
then it begins to happen faster. Risk happens slowly and then all at once
– a mentor of mine once issued those words, and I believe them never to be
truer than in this case right now.
*Finally, the bottom chart is an OB or OS indicator, which
you can clearly see is well below the OS line (6.12 to be exact). So
putting this all together, I’m reading this chart as, wait for it….
BULLISH TREND, BULLISH MOMENTUM, AND IMMEDIATE OVERSOLD….AND falling Volatility! Yes I would short more US Treasuries right here, right now.
This was all for the purpose of showing some my work.
I know its hard to simply just take my word for it, especially for our
newcomers, but this is just a small part of what we do in terms of studying
quantitative signals,…getting the Growth/Inflation cycle can be much more
tedious and tricky, and requires a lot of “nose to the grindstone” style
work. But as a former athlete, I know that anything that is hard, or
tedious….is usually the best thing for you. As Ray Dalio would say….Go
towards the PAIN!
That’s all…Good luck…..I’ll get the ranges out soon!
If you have any questions or would like to discuss the markets further, please feel free to contact me at 800-669-5354 or jcaruso@rjofutures.com.