What you should know about trading these instruments
Using the Gap trade strategy to build consistency
New: E-mini S&P 500 Investor Kit
Historically, the E-mini S&P 500 is one of the most popular and widely traded futures contracts around the world. The reason behind its popularity lies within the leverage it affords the trader, and when you couple that with its accessibility and ease to trade it makes the contract viable to virtually any trader. The S&P 500 hits new highs seemingly every day and now is the perfect time to add it to your portfolio. Complete with actionable trading strategies our E-mini S&P 500 Investor kit is here to help all traders, regardless of experience!
The Markets
Metals - The Bears Have an Edge in Gold
The Bears Have an Edge in Gold
By: Frank J. Cholly, Senior Market StrategistPosted Feb 12, 2021 8:51AM CT
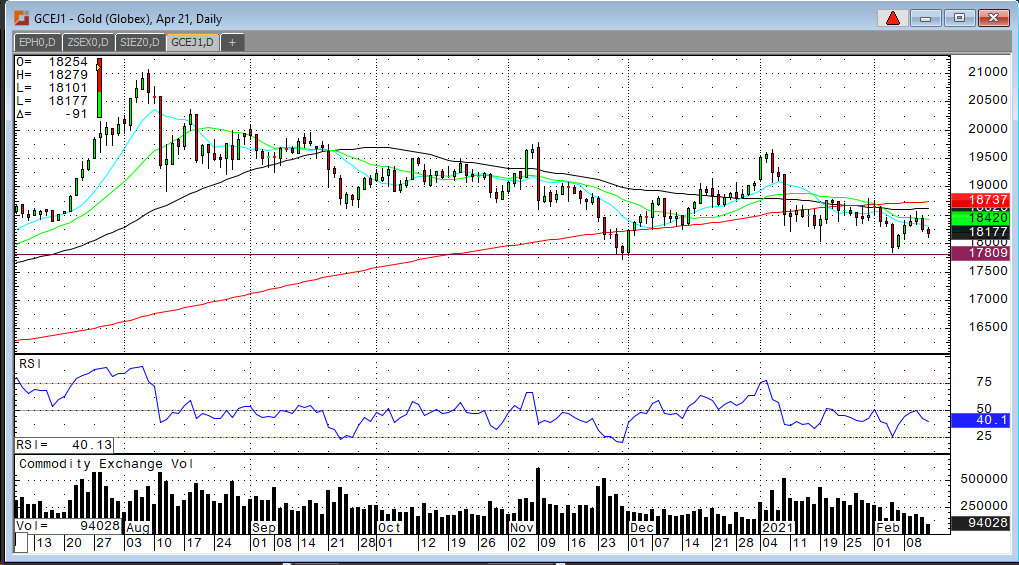
Every time it looks like a recovery in gold prices is
coming, it rolls back over. Let’s face it. This market has been sideways with a
slightly downward slope for the past six months. So, since my last writing one
week ago when I called for a test of the $1,750 level, not much has changed.
April gold rallied to $1,856.60 and today we’re back around $1,815. The path of
least resistance is still down. Lower physical demand from India and a little
bounce in the dollar and suddenly the chart points down again. April gold is
very close today to a “tipping” point. At the time of this writing, the low of
the day is at $1,810.10. A close below $1,810 would be a negative and perhaps
encourage additional selling.
While I do remain long term bullish, I also remain cautious. You must trade off what the charts are saying…not your heart. Third and fourth quarter of 2021 will likely see gold prices above $2,000. I want and encourage my clients to have long side exposure in metals. Again, there’s just too much money out there and slowly the economies around the globe begin to open. We are seeing signs of inflation creeping in regardless of what you here on the news. Once we embrace inflation, gold prices will explode. Perhaps all this sideways trading is actually basing a long term bottom…
Gold Apr '21 Daily Chart If you have any questions or would like to discuss the markets further, please feel free to contact me at 800-826-4124 or fcholly@rjofutures.com. Metals - Silver Could Hit $30
Silver Could Hit $30
By: Eli Tesfaye, Senior Market StrategistPosted Feb 12, 2021 11:57AM CT
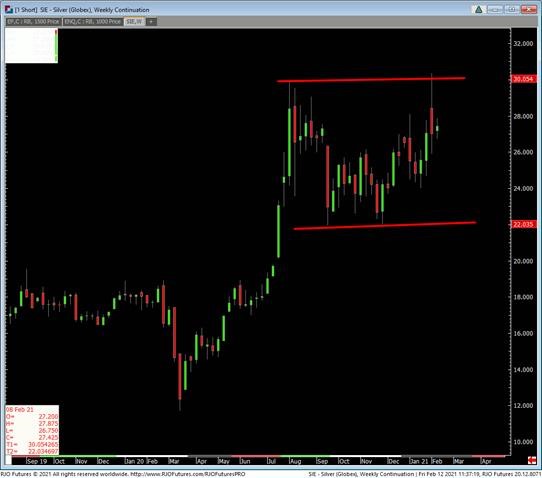
AS per the chart attached, Silver hit that double top breaking over $30.00. Early February, we sew that Silver hit that $30 in the “ GameStop” style of a short squeeze. Since then, selling pressure has had silver drift lower. But in my view, Silver could still test $30.00 before it sees $20.00 in my opinion. Markets are currently range-bound on charts. This sideway price action could be traded using options. Also, remember, in the future, you can trade the 1000oz contract.
Silver Mar '21 Daily Chart If you have any questions or would like to discuss the markets further, please feel free to contact me at 800-367-7290 or etesfaye@rjofutures.com. Energy - Oil Pauses After Eight Session Gain
Oil Pauses After Eight Session Gain
By: Alex Turro, Senior Market StrategistPosted Feb 12, 2021 8:24AM CT
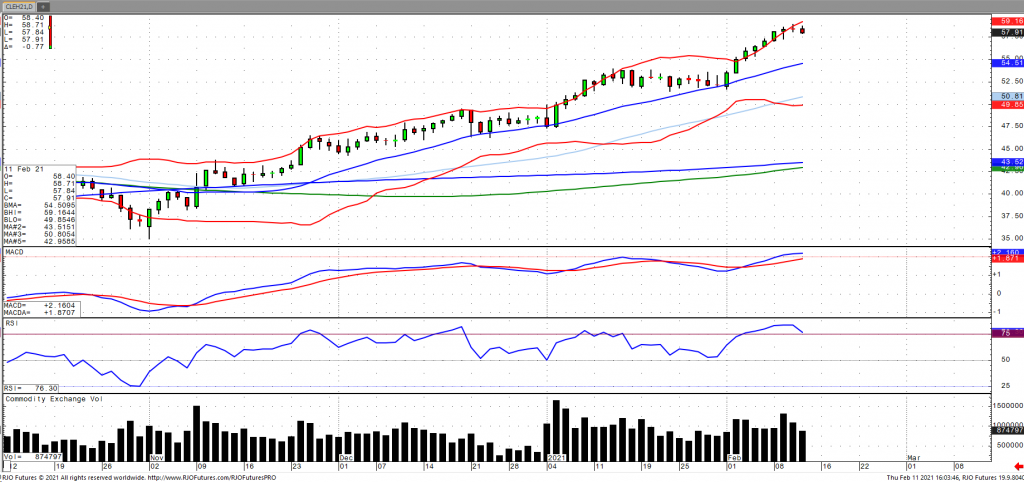
Oil prices are taking a breather as of Thursday afternoon after posting its longest winning streak in nearly 2 years as inventories fell expectedly 6.6 million barrels, resulting in a fourth consecutive draw. Contributing to the draw have been higher refinery rates as well as lower imports. This has been coupled with expectations of further supply cuts as well continued optimism on vaccine rollouts and the subsequent impact on the recovery of fuel demand. Russian January production posted a surprise decline and OPEC+ cut production by more than 215k barrels than their target in Janurary, providing yet another supportive development. The market remains bullish trend with today’s range seen between 53.66 – 60.29.
Crude Oil Mar '21 Daily Chart If you have any questions or would like to discuss the markets further, please feel free to contact me at 800-438-4805 or aturro@rjofutures.com. Softs - Buying Chocolate for Valentines Day? - Cocoa Futures
Buying Chocolate for Valentines Day? - Cocoa Futures
By: Peter MoosesPosted 02/12/2021
Cocoa
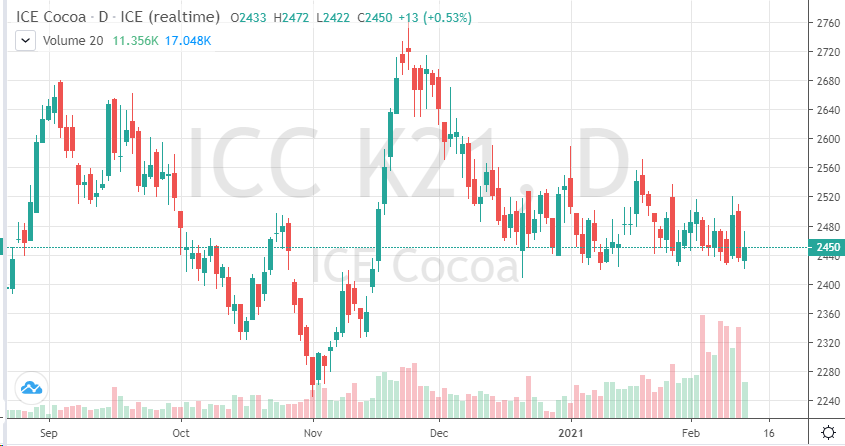
futures continue to be demand driven. This time of year, typically we see a
boost in chocolate sales for the Valentine’s Day holiday, this year is a little
different. With less people going out due to restrictions and restaurants and
stores reopening slowly, chocolate sales are down. The May chart continues to
trade in consolidation due to these factors.
Thursday,
we saw a 9 % drop down at one point. I do believe a lot of it has to do with traders
preparing for the roll. Cocoa is one of the commodities to watch this year
since it has been heavily affected by the lockdowns. Loosening restrictions and
more activities opening can only help prices move higher. If the trend
continues, traders will continue to want to be long, so shorts probably will
look to exit positions as the year progresses. We saw a dramatic sell-off due
to repositioning from the March contract to further out months. Looking at
options pricing it appears traders are looking to remain long cocoa contracts.
With weather patterns also creating a bullish sentiment, cocoa prices should head back above 2500 in the near-term.
On
the heels of mid-Sep-to-early-Oct's steeper, accelerated, 3rd-wave-looking
recovery, the past week-and-a-half's boringly lateral chop is first considered
a corrective/consolidative event that warns of a continuation of the uptrend
that preceded it to new highs above 04-Oct's 891.0 high. This count
remains consistent with our broader base/correction/recovery count introduced
in 13-Sep's Technical Blog following that
day's bullish divergence in short-term momentum above 07-Sep's 809.5 minor
corrective high detailed in the hourly chart below.
The
important takeaway from this month's lateral, sleepy price action is the
definition of Wed's 851.5 low as
the end or lower boundary of a suspected 4th-Wave correction. A failure
below 851.5 will confirm a bearish divergence in daily momentum and defer or
threaten a bullish count enough to warrant non-bullish decisions like
long-covers. A failure below 851.5 will not
necessarily negate a broader bullish count, but it will threaten it enough to
warrant defensive measures as the next pertinent technical levels below 851.5 are
13-Sep's prospective minor 1st-Wave high at 813.8 and obviously 08-Sep's 766.0
low. And making non-bullish decisions "down there" is
sub-optimal to say the least. Per such, both short- and longer-term
commercial traders are advised to pare or neutralize bullish exposure on a
failure below 851.5, acknowledging and accepting whipsaw risk- back above 04-Oct's
891.0 high- in exchange for much deeper and sub-optimal nominal risk below
766.0.
On
a broader scale, the daily log scale chart above shows the developing potential
for a bearish divergence in daily momentum that will be considered confirmed
below 851.5. This chart also shows the past month's recovery thus far
stalling in the immediate neighborhood of the (888.0) Fibonacci
minimum 38.2% retrace of Apr-Sep's entire 1128 - 766 decline). COMBINED
with a failure below 851.5, traders
would then need to be concerned with at least a larger-degree correction pf the
past month's rally and possibly a resumption of Apr-Sep's major downtrend.
Until
and unless the market fails below 851.5 however, we would
remind longer-term players of the key elements on which our bullish count is
predicated:
a confirmed bullish divergence in WEEKLY momentum
(below)
amidst
an
historically low 11% reading in out RJO Bullish Sentiment Index and
a
textbook complete and major 5-wave Elliott sequence down from 29-Apr's
1128 high to 08-Sep's 766.0 low.
Thus
far, the market is only a month into correcting a 4-MONTH, 32% drawdown, so
further and possibly protracted gains remain well within the bounds of a major
(suspected 2nd-Wave) correction of Apr-Sep's decline within an even more
massive PEAK/reversal process from 17-May's 1219 high on an active continuation
basis below.
These
issues considered, a bullish policy and exposure remain advised with a failure
below 851.5 required to defer or threaten this call enough to warrant moving to
a neutral/sideline position. In lieu of such weakness, we anticipate a
continuation of the past month's rally to new highs and potentially significant
gains above 891.0.
Agricultural - Mixed Trading in Live Cattle
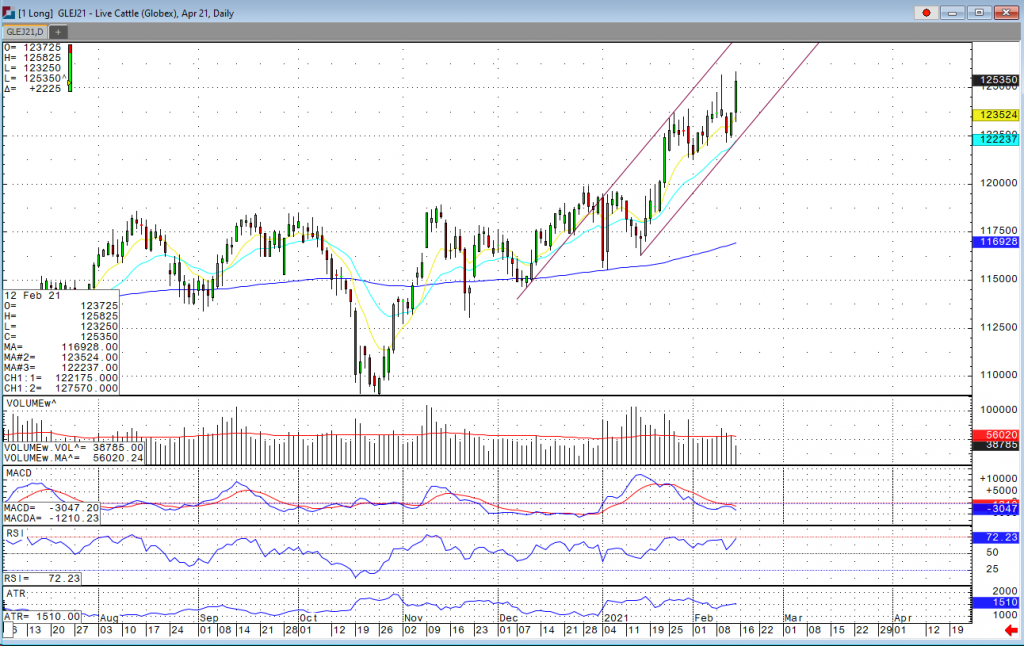
Mixed Trading in Live Cattle
By: Peter McGinnPosted 02/12/2021
Fundamentally, weather is helping to support this market along with good demand, but on Tuesday a key reversal happened in the April LC contract which helps confirm a short-term top. On Wednesday, we saw some follow through to the downside, yesterday’s trade seemed to regain those losses but there wasn’t that much total volume. Cash live cattle are trading mixed as we move through the week, with slightly weaker prices reported in Kansas and Nebraska and slightly firmer in Texas/Oklahoma. In Kansas on Thursday, 879 head were reported at 113-144 with an average price of 113.78 versus an average of 113.96 last week. In Nebraska, 2,141 head were reported at 113-114 with an average price of 113.09 versus an average of 114.45 last week. In Texas/Oklahoma, 105 head were reported at 114 versus an average of 113.90 last week. Average dressed steer weights for the week ending January 30 came in at 920 pounds, down from 926 the previous week but up from 897 a year ago. The 5-year average weekly weight for that week is 891.0. Actual slaughter that week came in at 637,597 head which was up 2.82% from last year, but the higher weights pushed beef production to 553.2 million pounds, up 5.2% from last year.
US beef export sales for the week ending February 4 came in at 17,544 tonnes, down from 29,882 the previous week and the lowest they have been since January 7. The average of the previous four weeks is 24,998. Cumulative sales for 2021 have reached 302,851 tonnes, up from 234,874 last year and the highest on record. The 5-year average is 176,624. The biggest buyer this week was Japan at 5,115 tonnes, followed by South Korea at 4,296 and Mexico at 3,180. South Korea has the largest commitments for 2021 at 81,927 tonnes, followed by Japan at 63,759, Hong Kong at 42,769, and China at 42,111. The USDA estimated cattle slaughter came in at 116,000 head yesterday. This brings the total for the week so far to 461,000 head, down from 470,000 last week and 486,000 a year ago.
Live Cattle Apr '21 Daily ChartAgricultural - Grain Futures Update w/Stephen Davis - 02/12/2021
Grain Futures Update w/Stephen Davis - 02/12/2021
By: Stephen DavisPosted 02/12/2021
RJO Futures Senior Market Strategist, Stephen Davis, discusses the latest news moving the grain futures markets.Interest Rates - S-T Mo Failures Interrupt T-Note, Bund Slides
S-T Mo Failures Interrupt T-Note, Bund Slides
By: RJO Market InsightsPosted 02/11/2021
MAR 10-Yr T-NOTES
In yesterday morning's Technical Blog we
identified last Fri's 136.295 high as the smaller-degree corrective high the
market needed to sustain losses below to avoid confirming a bullish divergence
in short-term momentum. The market's recovery above this level yesterday
afternoon confirms the divergence that defines Mon's 136.145 low
as the end of the decline from 27-Jan's 137.205 key high and
longer-term risk parameter. Per such, we're defining 136.14 as
our new short-term risk parameter from which non-bearish decisions like
short-covers and cautious bullish punts can be objectively based and managed by
shorter-term traders with tighter risk profiles.
The challenge now is discerning this week's recovery as either a smaller-degree, intra-range corrective hiccup within the major downtrend OR a continuation of a larger-degree correction up from 12-Jan's 136.01 low that could break 27-Jan's 137.205 high as part f a major correction of Aug-Jan's entire 140.13 - 136.01 decline. A relapse below 136.14 will reinforce the former, bearish count while a trendy, impulsive break above 137.21 will confirm the latter, bullish count.
The
daily chart of the contract above shows the magnitude of the major and arguably
still-developing downtrend from 05Aug20's 140.13 all-time high. A
recovery above 27-Jan's 137.205 high remains required to, in
fact, conclude 12-Jan's 136.01 low as the end of this decline and expose a
larger-degree (B- or 2nd-Wave) correction higher that could span weeks or even
months and reach well into the 138-handle or higher. Until such 137.21+ strength
is proven however, it would be premature from a longer-term perspective to
conclude this week's rebound as anything more than a smaller-degree
interruptive corrective hiccup within the past month's thus far lateral range
that's easily considered a mere consolidation within the major downtrend.
In effect, the short-term trend is up within the long-term trend that remains
arguably down.
On a 10-yr yield basis shown in the daily log close-only chart below, the analogous longer-term risk parameter is defined by 27-Jan's 1.018% corrective low. This is the minimum level the market needs to relapse below to arrest the SIX MONTH rate rise from 04-Aug's 0.504% low and expose a larger-degree correction lower in rates.
On
an even broader basis, there's n need to reiterate the momentum, sentiment and
Elliott details introduced in 11Aug20's Technical Webcast that
introduced a major peak/reversal environment. This long-term
peak/reversal count will remain intact until and unless last Aug's 140.13 high
is broken. This major peak/reversal process does allow for what could be
an extensive B- or 2nd-Wave corrective rebound however IF the market
recoups 137.21.
This
major reversal count is even more obvious on a weekly log 10-yr basis below
where the break of the nearly-two-year rate decline from Oct'18's 3.237% high
is crystal clear. The very interesting thing here is whether this Oct'18
- Jul'20 decline is the completing 5th-wave of a generation-long sequence that
dates from 1981's 15.84% high. This rate base/reversal process could
easily span years before a recovery above Oct'18's 3.261% major corrective high
confirms the reversal of a 39-YEAR bear trend in rates.
These issues considered, a bearish policy and policy and exposure remain advised for longer-term institutional players with a recovery above 137.21 required to defer our bearish count enough to warrant moving to a neutral-to-cautiously-bullish stance. Shorter-term traders have been advised to move to a neutral/sideline position as a result of yesterday's recovery above 136.30. The market's position in the middle of the recent 136.01 - 137.21-range presents abhorrent risk/reward metrics however, so standing aside is advised for the time being. We will be watchful for an intra-range recovery-stemming bearish divergence in short-term mo to reject/define a more reliable level from which a resumed bearish stance can be objectively based and managed.
MAR GERMAN BUNDS
Overnight's
recovery above Tue's 176.36 initial counter-trend high confirms a bullish
divergence in very short-term momentum that confirms at least an interim
correction up from Mon's 175.61 low and leaves yesterday's 175.94 low in
its wake as the latest minor corrective low the market now needs to sustain
gains above IF there's something bigger brewing to the upside. Per such,
this 175.94 low serves as a micro risk parameter from which non-bearish
decisions can be objectively based and managed by very short-term traders.
As
this recovery has thus far only engaged former mid-176-handle-area
support-turned-resistance however, t would be premature to conclude that this
week's bounce is anything more than an interim (4th-Wave) correction within the
decline from 27-Jan's 178.12
high. We believe a recovery above at least 29-Jan's 176.89
(suspected minor 1st-Wave) low remains required to
jeopardize the impulsive integrity of the decline from 178.12 and expose a
more protracted correction or reversal higher that would warrant defensive
steps by shorter-term traders.
From
a longer-term perspective, commensurately larger-degree strength above
25-Jan's 177.87 larger-degree corrective high remains required to negate our
longer-term peak/reversal count, render the sell-off attempt
from 04-Nov's 178.85 high a 3-wave and thus corrective affair and re-expose the
secular bull. Until and unless such strength is shown, recovery attempts
remain advised to first be approached as corrective selling opportunities by
longer-term institutional players.
In sum, a bearish policy and exposure remain advised with a recovery above 176.89 required for shorter-term traders to step aside and commensurately larger-degree strength above 177.87 required for longer-term players to follow suit. Very short-term traders are OK to consider cautious bullish punts from 176.40 OB with a failure below 175.94 required to negate this specific call and warrant its cover ahead of what we'd then believe is a likely resumption of the major bear trend.
Economy - S-T Mo Failure Insufficient to End RBOB Correction, But Beware
S-T Mo Failure Insufficient to End RBOB Correction, But Beware
By: RJO Market InsightsPosted 11/08/2022
Posted on Nov 08, 2022, 07:51 by Dave Toth
In Fri's Technical Webcast we identified a
minor corrective low at 2.6328 from Thur as a mini risk parameter the market
needed to sustain gains above to maintain a more immediate bullish count.
The 240-min chart below shows the market's failure overnight below this level,
confirming a bearish divergence in very short-term momentum. This mo
failure defines Fri's 2.8172 high as
one of developing importance and a parameter from which very short-term traders
can objectively base non-bullish decisions like long-covers.
Given
the magnitude of the past three weeks' broader recovery however, this
short-term momentum failure is of an insufficient scale to conclude anything
more than another correction within this broader recovery from 26-Sep's 2.1877
low. Indeed, overnights failure below 2.6328 only allows us to conclude
the end of the portion of the month-and-a-half rally from 31-Oct's 2.4822 next
larger-degree corrective low. 2.4822 is the
risk parameter this market still needs to fail below to break the uptrend from
18-Oct's 2.3526 low while this 2.3526 low
remains intact as the risk parameter this market needs to fail below to break
the month-and-a-half uptrend. From an
intermediate-to-longer-term perspective, this week's setback falls well within
the bounds of another correction ahead of further gains. This is another
excellent example of the importance of technical and trading SCALE and
understanding and matching directional risk exposure to one's personal risk
profile.
The
reason overnight's admittedly minor mo failure might have longer-term
importance is the 2.8172-area from which it stemmed. In
Fri's Technical Blog we also noted the market's engagement of the
2.8076-to-2.8159-area marked by the 61.8% retrace of Jun0-Sewp's 3.2758 -2.1877
decline and the 1.000 progression of Sep-Oct's initial 2.1877 - 2.6185
(suspected a-Wave) rally from 18-Oct's 2.3526 (suspected b-Wave) low. We
remind longer-term players that because of the unique and compelling confluence
of:
early-Aug's bearish divergence in WEEKLY momentum
amidst
historically
extreme bullish sentiment/contrary opinion levels in our RJO Bullish
Sentiment Index
an
arguably complete and massive 5-wave Elliott sequence from Mar'20's 0.4605
low to Jun's 4.3260 high (as labeled in the weekly log active-continuation
chart below) and
the
5-wave impulsive sub-division of Jun-Sep's (suspected initial 1st-Wave) decline
The
recovery attempt from 26-Sep's 2.1877 low is arguably only a 3-wave (Wave-2)
corrective rebuttal to Jun-Sep's decline within a massive, multi-quarter
PEAK/reversal process. Now granted, due to the magnitude of 2020 -2022's
secular bull market, we discussed the prospect for this (2nd-Wave corrective)
recovery to be "extensive" in terms of both price and time. A
"more extensive" correction is typified by a retracement of 61.8% or
more and spanning weeks or even months following a 3-month decline. Per
such, the (suspected corrective) recovery from 26-Sep's 2.1877 low could easily
have further to go, with commensurately larger-degree weakness than that
exhibited this week (i.e., a failure below at least 2.4822) required
to consider the correction complete. Indeed, the daily log chart above
shows the market thus far respecting former 2.6185-area resistance from 10-Oct
as a new support candidate.
These
issues considered, very shorter-term traders have been advised to move to a neutral/sideline
position following overnight's momentum failure below 2.6328, with a recovery
above 2.8172 required to negate this call, reaffirm the recovery and re-expose
potentially significant gains thereafter. For intermediate- and
longer-term players, a bullish policy and exposure remain advised with a
failure below 2.4822 required to threaten this call enough to warrant
neutralizing exposure. We will be watchful for another bearish divergence
in momentum following a recovery attempt that falls short of Fri's 2.8172 high
that would be considered the next reinforcing factor to a count calling that
2.8172 high the prospective end to the month-and-a-half 2nd-Wave
correction. In lieu of such, a resumption of the current rally to
eventual new highs above 2.8172 should not surprise.
Economy - Futures Market Outlook w/John Caruso - 02/11/2021
Futures Market Outlook w/John Caruso - 02/11/2021
By: John Caruso, Senior Market StrategistPosted Feb 11, 2021 3:22PM CT
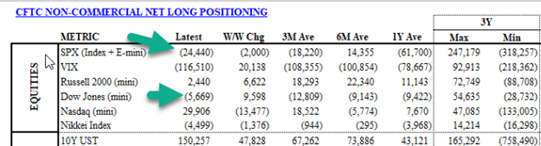
SP500- interesting tidbit for you on the SPY CFTC positioning – headed into the end of Q3 2018 AKA the peak of the growth cycle, the SPY was carrying a NET LONG position of 247K contracts…today it’s carrying a NET SHORT position of 24K contracts. Think about that. What this tells me is that consensus is nowhere near BUBBLE territory in terms of exuberance and net positioning. Interesting. EPS and Sales Rev’s continue to post strong results as well. BONUS: the lower range of the VIX has just puked to 15.98! 15.98 VIX is a possibility.
Yields- While talking heads on TV like to compare present market climate to those of the past, we always hear of the dot com bubble at the end of the 1990s/early 2000s. The interesting comparison is more to do with the yield environments between present day and 1999 – when the 10yr was yielding 6% vs today 1.14% - low rates, Fed monetary and FISCAL support….again to me, we may have a lot more to go in terms of stock market exuberance – and certainly PLENTY of more room to run in 10yr yields!
If you have any questions or would like to discuss the markets further, please feel free to contact me at 800-669-5354 or jcaruso@rjofutures.com.