It’s time to turn the page to a new year! Receive $5-A-Side commissions for 60-days when you open a Broker-Assisted account anytime during January and February!
New: E-mini S&P 500 Investor Kit
Historically, the E-mini S&P 500 is one of the most popular and widely traded futures contracts around the world. The reason behind its popularity lies within the leverage it affords the trader, and when you couple that with its accessibility and ease to trade it makes the contract viable to virtually any trader. The S&P 500 hits new highs seemingly every day and now is the perfect time to add it to your portfolio. Complete with actionable trading strategies our E-mini S&P 500 Investor kit is here to help all traders, regardless of experience!
The Markets
Metals - Look for Gold to Build Base around $1750
Look for Gold to Build Base around $1750
By: Frank J. Cholly, Senior Market StrategistPosted Feb 19, 2021 8:39AM CT
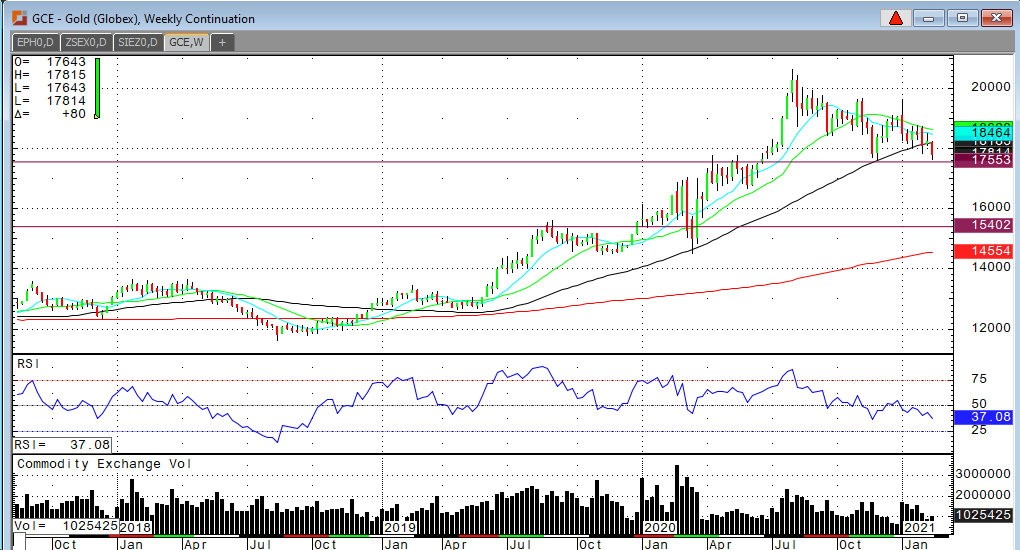
I’ve been calling for a test of this chart level for the
past few weeks. Now I look for a period of consolidation in this area around
$1,750. Dollar weakness will help to stabilize gold prices. Other metals
experiencing sharp recovery bounces off overnight lows. These are eight-month
lows in gold while platinum is at multi year highs and silver holding steady
with levels above $27.00. All along I’ve also been calling for silver and
platinum to “normalize” their price ratios with gold. That is happening.
I’m not about to give up on gold, but gold has run into
significant headwinds. Gold for now has lost its safe-haven trade. Rising
interest rates hasn’t made gold more attractive and then there’s the debate
over Bitcoin replacing gold…which I’m not buying. Gold will recover and be
closer to $2,000 buy year end in my opinion.
The Fed is committed to heating up the economy which will continue to open as vaccines are distributed. The Biden Administration is determined to push through more and more spending. The dollar will resume its down trend. Inflation will happen. There’s too many dollars out there and the bond market is telling us that’s too.
Gold Weekly Chart If you have any questions or would like to discuss the markets further, please feel free to contact me at 800-826-4124 or fcholly@rjofutures.com. Metals - Dull Week of Trading for Silver
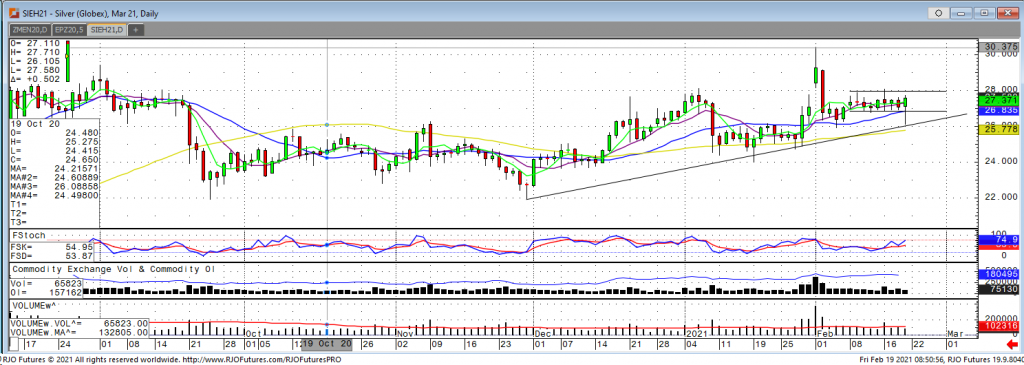
March silver saw a pretty dull week of trading after starting the week making a new high of 28.075 during Tuesday’s session before closing down on the day. Wednesday and Thursday brought mixed trade until the start of the over night session Thursday were we saw a drop down to 26.105 before working its way back positive to where its currently trading at 27.51. Pressure for the silver market started this week with a stronger US dollar and an uptick in interest rates. Although the dollar has fallen some in the second half of the week, its still weighing on the metals markets as there is a lack of bullish fundamentals to get an extended rally started. There is still a premium for physical silver vs the futures price with some silver ETFs coming out with statements about being worried about being able to acquire the silver needed. Although its not as much of a discrepancy as it was a couple weeks ago, the bulls are looking for that increase in demand to continue and support a rally. From a technical standpoint there is no definitive direction where the silver market wants to go. Silver has done a decent job of bucking any negative news but also has failed to rally off anything as well. Support comes in at 26.85 and with a break of that we would expect to see trade down to 26.10 - 26.20. Resistance comes in at 28.00 and we would need to see a close above that to see a breakout and retest of the highs from the beginning of the month.
Silver Mar '21 Daily Chart If you have any questions or would like to discuss the markets further, please feel free to contact me at 800-826-2270 or therrmann@rjofutures.com. Energy - Continued Intra-Range Nat Gas Gains Define New S-T Bull Risk
Continued Intra-Range Nat Gas Gains Define New S-T Bull Risk
By: RJO Market InsightsPosted 02/17/2021
The fact that nat gas is rallying
now, in the dead of what's becoming a more challenging winter than most
anticipated, is a surprise to no one. The 240-min chart below shows this
week's break above the prior couple weeks' resistance around 3.057, with the
important by-product being the market's definition of last Fri's 2.834 low as the latest
smaller-degree corrective low it's now required to sustain gains above to
maintain a more immediate bullish count. Per such, this 2.834 level
becomes our new short-term risk parameter from which traders can rebase and
manage the risk of a bullish policy.
Generally speaking and because of
the market's position still deep within the middle-half bowels of the
massive FIVE YEAR lateral range where the risk/reward merits of directional
exposure are abhorrent, we continue to advise a neutral/sideline policy.
For those imbedded in this industry who HAVE to make directional decisions, a
cautious bullish policy remains advised with a failure below 2.834 required
to negate this call and warrant its cover.
Former 3.05-area resistance, since broken, would be expected to hold as new near-term support IF the market has something broader to the bull side in mind.
Stepping back, only a glance at
the daily chart of the mar contract above is needed to see that the trend is
clearly up with a failure below at least 2.834 required
to threaten it. The problem or challenge here is that on an even broader scale
shown in the weekly log active-continuation basis below, the market remains
within the middle-half bowels of the massive five year latera; range between
1.51 and 4.93 where the odds of aimless whipsaw risk are approached as
greater. As we'll address further down, we've made the long-term case for
a massive BASE/reversal environment from last Jun's 1.517 low that could span
quarters and even years and ultimately produce levels above 4.00 as the past
three quarters' technical facts of:
confirmed bullish divergence in weekly momentum and
the market's gross failure to sustain Jun'20's break below Mar'16's 1.611 low
are identical to those that
warned of and accompanied 2016-to-2018's 206% reversal. WITHIN that major
32-MONTH reversal however came an extensive, 14-MONTH, 50% retracement from
Dec'16's 3.90 high to Feb'18's 2.53 low. And- surprise, surprise- this
14-month (B-Wave) correction back down included a dead-of-winter Dec'17/Jan'18
spike to 3.628 before collapsing more than a dollar to Feb'18's 2.53 end to the
correction. This extensive, hair-pulling-out, aimless and
frustrating-to-no-end B-Wave correction is circled in blue in the weekly chart
below. The debate remains as to how long we might remain within the
recent 3.39 - 2.26-range OR f this time will be different and the market is
poised for a launch to 4.00+ straight away.
An admittedly short-term mo failure below 2.834 will threaten a more immediate bullish count and raise the odds of a continued extensive (B-Wave) correction back to the 2.25-to-2.00-area we proposed would contain this correction and present favorable risk/reward buying conditions. In lieu of such sub-2.834 weakness, we won't argue with, dispute or underestimate the clear and present, if intra-range uptrend.
Finally, the monthly log chart
below shows the technical elements from last Jun's 1.517 low that, again, we
believe are identical to those that existed around Mar'16's 1.611 low and ultimately
led to a 32-month, 206% reversal higher. The technical and trading
challenge now remains one of negotiating the middle-half bowels of the massive
multi-year lateral range that remains fertile ground for aimless whipsaw risk
In sum, a neutral/sideline policy remains advised for those outside of the nat gas industry due to the poor risk/reward merits of directional exposure from the middle of the major range. For those imbedded in this industry who HAVE to take or make a directional stand, a cautious bullish policy remains advised with a failure below 2.834 required to threaten or defer this call enough to warrant moving to the sidelines to reduce or remove the risk of a potential relapse to the 2.25-aerewa or lower. In lieu of a relapse below 2.834, further and possibly accelerated gains should not surprise.
Softs - Coffee Looking Robust
Coffee Looking Robust
By: Adam TuiaanaPosted 02/17/2021
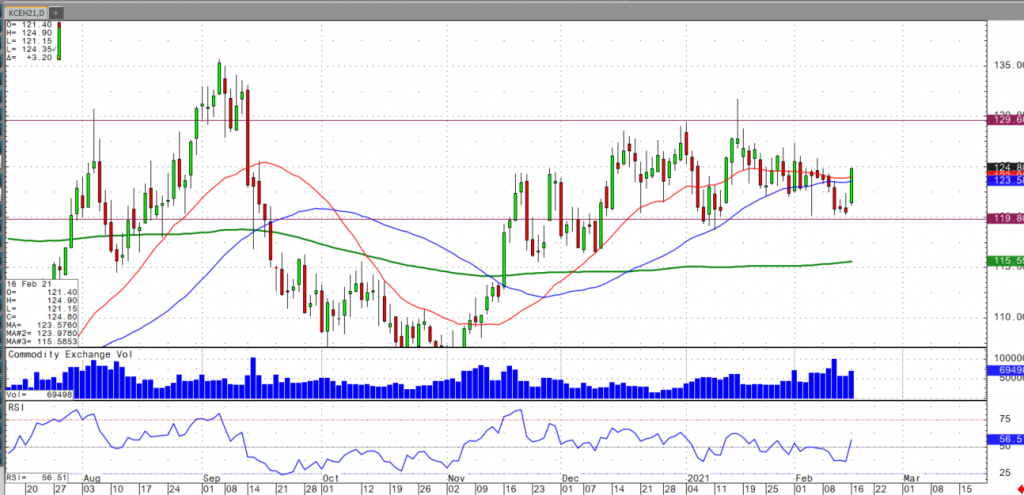
Over the past two trading
sessions, March coffee futures have climbed back to the middle of a
well-defined established since December. March coffee prices have rallied due
to the promise of a “return-to-normal” dining out economy, with many US States
easing their restrictions and producing additional demand in the process.
Vaccines continue distribution at a slow pace, with President Biden promising
that “by the end of July we’ll have 600 million doses, enough to vaccinate
every American.” Clearly this promise has resulted in optimism for those
that require a physical vaccination to return to work and those that simply
want one. Optimism results in demand, which we are now seeing.
The recent rally from February 16th where March coffee
futures went from 1.21 to 1.2490 has prompted additional follow-through buying,
but the market seems to be easing on momentum for the time being, after such a
strong move. The range of 1.20 to 1.25 has been quite comfortable for some
time, and we will likely see strong resistance at the 1.27 level. A break above
1.32 will be needed for a leg higher.
For more frequent commentary, please check out and subscribe to my daily futures market videos on coffee and other commodities.
On
the heels of mid-Sep-to-early-Oct's steeper, accelerated, 3rd-wave-looking
recovery, the past week-and-a-half's boringly lateral chop is first considered
a corrective/consolidative event that warns of a continuation of the uptrend
that preceded it to new highs above 04-Oct's 891.0 high. This count
remains consistent with our broader base/correction/recovery count introduced
in 13-Sep's Technical Blog following that
day's bullish divergence in short-term momentum above 07-Sep's 809.5 minor
corrective high detailed in the hourly chart below.
The
important takeaway from this month's lateral, sleepy price action is the
definition of Wed's 851.5 low as
the end or lower boundary of a suspected 4th-Wave correction. A failure
below 851.5 will confirm a bearish divergence in daily momentum and defer or
threaten a bullish count enough to warrant non-bullish decisions like
long-covers. A failure below 851.5 will not
necessarily negate a broader bullish count, but it will threaten it enough to
warrant defensive measures as the next pertinent technical levels below 851.5 are
13-Sep's prospective minor 1st-Wave high at 813.8 and obviously 08-Sep's 766.0
low. And making non-bullish decisions "down there" is
sub-optimal to say the least. Per such, both short- and longer-term
commercial traders are advised to pare or neutralize bullish exposure on a
failure below 851.5, acknowledging and accepting whipsaw risk- back above 04-Oct's
891.0 high- in exchange for much deeper and sub-optimal nominal risk below
766.0.
On
a broader scale, the daily log scale chart above shows the developing potential
for a bearish divergence in daily momentum that will be considered confirmed
below 851.5. This chart also shows the past month's recovery thus far
stalling in the immediate neighborhood of the (888.0) Fibonacci
minimum 38.2% retrace of Apr-Sep's entire 1128 - 766 decline). COMBINED
with a failure below 851.5, traders
would then need to be concerned with at least a larger-degree correction pf the
past month's rally and possibly a resumption of Apr-Sep's major downtrend.
Until
and unless the market fails below 851.5 however, we would
remind longer-term players of the key elements on which our bullish count is
predicated:
a confirmed bullish divergence in WEEKLY momentum
(below)
amidst
an
historically low 11% reading in out RJO Bullish Sentiment Index and
a
textbook complete and major 5-wave Elliott sequence down from 29-Apr's
1128 high to 08-Sep's 766.0 low.
Thus
far, the market is only a month into correcting a 4-MONTH, 32% drawdown, so
further and possibly protracted gains remain well within the bounds of a major
(suspected 2nd-Wave) correction of Apr-Sep's decline within an even more
massive PEAK/reversal process from 17-May's 1219 high on an active continuation
basis below.
These
issues considered, a bullish policy and exposure remain advised with a failure
below 851.5 required to defer or threaten this call enough to warrant moving to
a neutral/sideline position. In lieu of such weakness, we anticipate a
continuation of the past month's rally to new highs and potentially significant
gains above 891.0.
Agricultural - Grain Futures Update w/Stephen Davis - 02/19/2021
Grain Futures Update w/Stephen Davis - 02/19/2021
By: Stephen DavisPosted 02/19/2021
Stephen Davis discusses the latest news moving the grain markets and how he expects them to move in the coming weeksInterest Rates - Inflation Driving Interest Rates
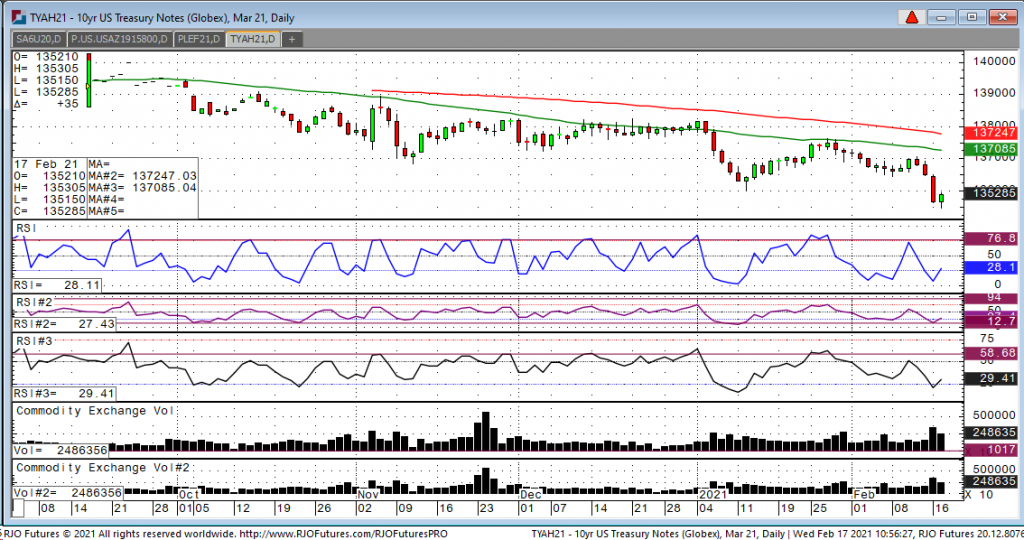
The main driver in the note complex has been the resurgence of inflation. Recently, we have seen many of the commodities make big moves to the upside including grains and oil and the debate now is beginning, is the fed in denial that inflation is beginning to accelerate more rapidly than desired? Many fed speakers have come out recently saying that inflation currently is of no concern, but one must look at many of the markets and the cost of basic needs at the store. Prices are indeed going higher and the fed might be behind the curve. In addition to many of the commodities rallying, constant talk to add additional stimulus also is contributing to the recent inflation surge. Also, this morning we saw retail sales blow away expectations which should have been negative for the notes, but we see the 10’s up 4 ticks on the day. I suspect the market is short traders are covering some positions. Yesterday terms of yields, the 10-year hit 1.31, which is the highest we have been in over a year. A test of the psychological 1.50% is likely to be tested in the near term. Traders should take the sell the market on rallies until proven wrong.
10-Year Note Mar '21 Daily Chart If you have any questions or would like to discuss the markets further, please feel free to contact me at 800-826-2270 or gperlin@rjofutures.com. Equity - Stocks Look to End Week Strong
Stocks Look to End Week Strong
By: Bill Dixon, Senior Market StrategistPosted Feb 19, 2021 10:35AM CT
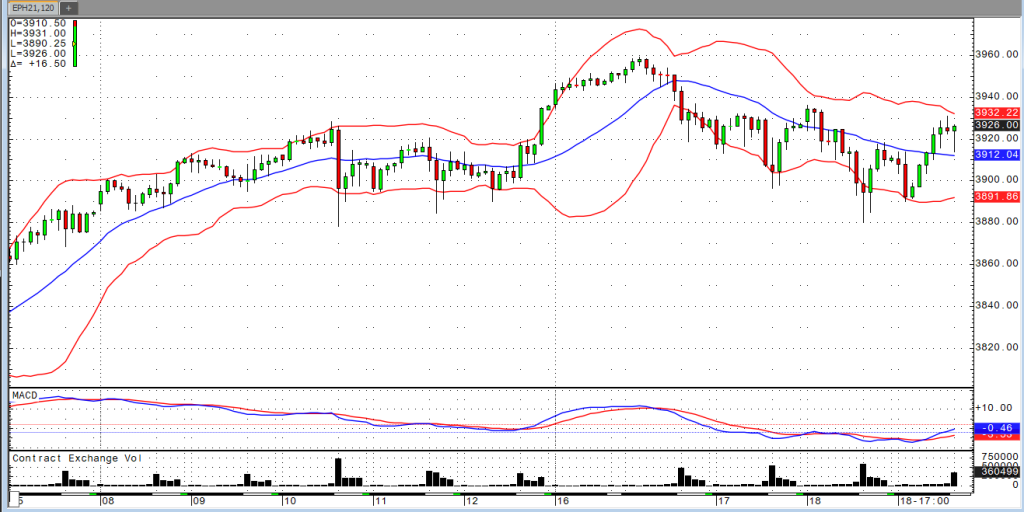
Up until today, each day this week brought us a lower low in the indices. That trend seems unlikely to continue as they’re all making runs towards Wednesday’s highs. Any sign of fear in these markets continues to disappear in short order, and today’s slate of data was supportive of the move higher. The PMI composite data came in strong (58.8 vs. 57.9) along with an upward revision of the prior reading. Manufacturing came out in line. Existing home sales also beat expectations (6.85 vs. 6.6), but we saw a small revision lower from the prior reading. Strong data continues as do intentions to spend away. With that being the case, I’m not sure what it will take to get a meaningful, lasting correction. There is no shortage of reasons to be legitimately concerned about where the indices are trading, but the market seems to be discounting all of them. Something will eventually give, but this has been one heck of a run for dip buyers. “If it ain’t broke…”
E-mini S&P 500 Mar '21 120min Chart
If you have any questions or would like to discuss the markets further, please feel free to contact me at 800-669-5354 or bdixon@rjofutures.com. Economy - S-T Mo Failure Insufficient to End RBOB Correction, But Beware
S-T Mo Failure Insufficient to End RBOB Correction, But Beware
By: RJO Market InsightsPosted 11/08/2022
Posted on Nov 08, 2022, 07:51 by Dave Toth
In Fri's Technical Webcast we identified a
minor corrective low at 2.6328 from Thur as a mini risk parameter the market
needed to sustain gains above to maintain a more immediate bullish count.
The 240-min chart below shows the market's failure overnight below this level,
confirming a bearish divergence in very short-term momentum. This mo
failure defines Fri's 2.8172 high as
one of developing importance and a parameter from which very short-term traders
can objectively base non-bullish decisions like long-covers.
Given
the magnitude of the past three weeks' broader recovery however, this
short-term momentum failure is of an insufficient scale to conclude anything
more than another correction within this broader recovery from 26-Sep's 2.1877
low. Indeed, overnights failure below 2.6328 only allows us to conclude
the end of the portion of the month-and-a-half rally from 31-Oct's 2.4822 next
larger-degree corrective low. 2.4822 is the
risk parameter this market still needs to fail below to break the uptrend from
18-Oct's 2.3526 low while this 2.3526 low
remains intact as the risk parameter this market needs to fail below to break
the month-and-a-half uptrend. From an
intermediate-to-longer-term perspective, this week's setback falls well within
the bounds of another correction ahead of further gains. This is another
excellent example of the importance of technical and trading SCALE and
understanding and matching directional risk exposure to one's personal risk
profile.
The
reason overnight's admittedly minor mo failure might have longer-term
importance is the 2.8172-area from which it stemmed. In
Fri's Technical Blog we also noted the market's engagement of the
2.8076-to-2.8159-area marked by the 61.8% retrace of Jun0-Sewp's 3.2758 -2.1877
decline and the 1.000 progression of Sep-Oct's initial 2.1877 - 2.6185
(suspected a-Wave) rally from 18-Oct's 2.3526 (suspected b-Wave) low. We
remind longer-term players that because of the unique and compelling confluence
of:
early-Aug's bearish divergence in WEEKLY momentum
amidst
historically
extreme bullish sentiment/contrary opinion levels in our RJO Bullish
Sentiment Index
an
arguably complete and massive 5-wave Elliott sequence from Mar'20's 0.4605
low to Jun's 4.3260 high (as labeled in the weekly log active-continuation
chart below) and
the
5-wave impulsive sub-division of Jun-Sep's (suspected initial 1st-Wave) decline
The
recovery attempt from 26-Sep's 2.1877 low is arguably only a 3-wave (Wave-2)
corrective rebuttal to Jun-Sep's decline within a massive, multi-quarter
PEAK/reversal process. Now granted, due to the magnitude of 2020 -2022's
secular bull market, we discussed the prospect for this (2nd-Wave corrective)
recovery to be "extensive" in terms of both price and time. A
"more extensive" correction is typified by a retracement of 61.8% or
more and spanning weeks or even months following a 3-month decline. Per
such, the (suspected corrective) recovery from 26-Sep's 2.1877 low could easily
have further to go, with commensurately larger-degree weakness than that
exhibited this week (i.e., a failure below at least 2.4822) required
to consider the correction complete. Indeed, the daily log chart above
shows the market thus far respecting former 2.6185-area resistance from 10-Oct
as a new support candidate.
These
issues considered, very shorter-term traders have been advised to move to a neutral/sideline
position following overnight's momentum failure below 2.6328, with a recovery
above 2.8172 required to negate this call, reaffirm the recovery and re-expose
potentially significant gains thereafter. For intermediate- and
longer-term players, a bullish policy and exposure remain advised with a
failure below 2.4822 required to threaten this call enough to warrant
neutralizing exposure. We will be watchful for another bearish divergence
in momentum following a recovery attempt that falls short of Fri's 2.8172 high
that would be considered the next reinforcing factor to a count calling that
2.8172 high the prospective end to the month-and-a-half 2nd-Wave
correction. In lieu of such, a resumption of the current rally to
eventual new highs above 2.8172 should not surprise.