RJO FuturesCast

February 26, 2021 | Volume 15, Issue 8

The Markets

Metals - Dip in Platinum Presents Opportunity

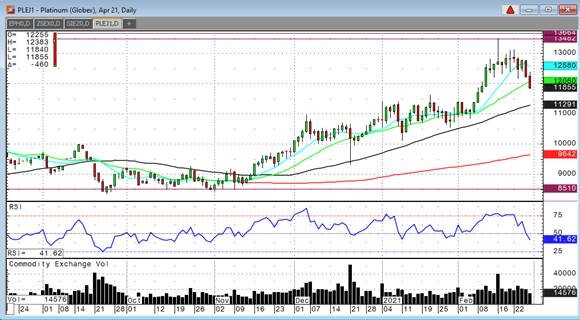
Platinum has been the best performing precious metal over the past four months. We have to pay attention to what’s going on in this metal. Platinum has been beat down versus gold for too long. I want to bring your attention back to November 9th 2020. That was the LOW in platinum. The low in platinum on that day was $851.00 per ounce. April gold low on that same day was $1,859.60 per ounce. The differential on that day was $1,008, gold over platinum. Since then platinum has rallied 63%! Today the differential is at $552. Platinum’s discount to gold is what made it so attractive to money managers and experienced commodity traders that recognized that platinum was severely under-valued at $1,000 under gold. But there’s more to platinum than a “proxy” for gold. Industrial demand has further fueled platinum’s rally. Its use in catalytic converters is widely known and demand for vehicles has increased as signs of the economy growing cannot be ignored. More importantly is future demand for clean energy. Hydrogen power. Hydrogen fuel cell electric vehicles are the future and all the auto makers are getting on board. Platinum will be in much greater demand for those vehicles.

Platinum is still a very good value at $1,200. Metals are already in the beginning of a major bull market. Inflation will be added support after we embrace the fact that interest rates are also rising. Metals are dipping right now because interest rates have risen too fast. Platinum has been ignored for too long. Future demand will drive platinum back towards $2,000. It’s been there before; it won’t be that hard to get back to $2,000.

Platinum Apr '21 Daily Chart
If you have any questions or would like to discuss the markets further, please feel free to contact me at 800-826-4124 or fcholly@rjofutures.com.
Metals - Silver Under Pressure

Silver is under pressure with a potential rise in interest rate hampering real inflation pressure as per the chart below. But as I have written about this in the past with the same chart, I have below. Silver still can blow above $30 provided the buzz for infrastructure spending accelerates to boost the economy. So bears could have trouble hitting silver too hard so to speak. I will be shocked to see silver trade below $22 to $20 range. These sideways markets provide a great deal of option trading opportunities. Please reach out to me to discuss that. Enjoy trading.

If you have any questions or would like to discuss the markets further, please feel free to contact me at 800-367-7290 or etesfaye@rjofutures.com.
Energy - Oil Set for Nearly 20% Monthly Gain

Oil prices fell early Friday as bond prices broke leading to Dollar gains, as well as the expectation of more supply coming online. Despite the dip in price, the market is poised for a monthly gain of nearly 20% amid domestic supply disruptions as will demand optimism surrounding the vaccine. OPEC+ are expected to allow an increase in output at next week’s meeting given the jump in price as well as improving demand prospects. In addition, a bullish development can be found in reports that Exxon Mobil has seen its total reserves reduced by 33% from the price drop as well as some current outages from the recent winter storm in the Gulf. The market remains bullish trend with today’s range seen between 58.43 – 64.15.

Crude Oil Apr '21 Daily Chart
If you have any questions or would like to discuss the markets further, please feel free to contact me at 800-438-4805 or aturro@rjofutures.com.
Softs - Lower Covid-19 Case Numbers Brings Hope to Longer-Term Cocoa Demand Outlook

Cocoa prices saw a move higher this week – with the May contract trading towards 2600. As Covid vaccines continue to be distributed, cases appear to be headed lower. If this pattern continues, look for more areas to lighten up restrictions and this should lead to economic growth. Cocoa specifically has been greatly affected by lockdowns. Chocolate companies continue to report weaker data during the pandemic as consumers shift their income towards necessities.

Looking at the currencies, a weaker Pound and stronger Euro has had little affect on this week’s cocoa rally. Cocoa appears to be trading more off its own fundamental hope and less off the macro picture as we have seen weaker equities this week.

Cocoa producing nations are deciding on whether they should come together to have more control of the supply side of the equation, but many are leery. This could cause issues on many levels – mainly with their local governments.

Technically, cocoa appears to be headed for 2700 in the May contract if vaccines rollouts continue to show that they are helping the public. Next week will be telling for the soft, if equities continue to move lower and currencies continue their volatility will cocoa continue its own trend higher?

Cocoa May '21 Daily Chart
Agricultural - Bullish Canola Count Intact Above Minimum 851.5

Posted on Oct 14, 2022, 07:42 by Dave Toth

On the heels of mid-Sep-to-early-Oct's steeper, accelerated, 3rd-wave-looking recovery, the past week-and-a-half's boringly lateral chop is first considered a corrective/consolidative event that warns of a continuation of the uptrend that preceded it to new highs above 04-Oct's 891.0 high.  This count remains consistent with our broader base/correction/recovery count introduced in 13-Sep's Technical Blog following that day's bullish divergence in short-term momentum above 07-Sep's 809.5 minor corrective high detailed in the hourly chart below.

The important takeaway from this month's lateral, sleepy price action is the definition of Wed's 851.5 low as the end or lower boundary of a suspected 4th-Wave correction.  A failure below 851.5 will confirm a bearish divergence in daily momentum and defer or threaten a bullish count enough to warrant non-bullish decisions like long-covers.  A failure below 851.5 will not necessarily negate a broader bullish count, but it will threaten it enough to warrant defensive measures as the next pertinent technical levels below 851.5 are 13-Sep's prospective minor 1st-Wave high at 813.8 and obviously 08-Sep's 766.0 low.  And making non-bullish decisions "down there" is sub-optimal to say the least.  Per such, both short- and longer-term commercial traders are advised to pare or neutralize bullish exposure on a failure below 851.5, acknowledging and accepting whipsaw risk- back above 04-Oct's 891.0 high- in exchange for much deeper and sub-optimal nominal risk below 766.0.

On a broader scale, the daily log scale chart above shows the developing potential for a bearish divergence in daily momentum that will be considered confirmed below 851.5.  This chart also shows the past month's recovery thus far stalling in the immediate neighborhood of the (888.0) Fibonacci minimum 38.2% retrace of Apr-Sep's entire 1128 - 766 decline).  COMBINED with a failure below 851.5, traders would then need to be concerned with at least a larger-degree correction pf the past month's rally and possibly a resumption of Apr-Sep's major downtrend.

Until and unless the market fails below 851.5 however, we would remind longer-term players of the key elements on which our bullish count is predicated:

  • a confirmed bullish divergence in WEEKLY momentum (below) amidst
  • an historically low 11% reading in out RJO Bullish Sentiment Index and
  • a textbook complete and major 5-wave Elliott sequence down from 29-Apr's 1128 high to 08-Sep's 766.0 low.

Thus far, the market is only a month into correcting a 4-MONTH, 32% drawdown, so further and possibly protracted gains remain well within the bounds of a major (suspected 2nd-Wave) correction of Apr-Sep's decline within an even more massive PEAK/reversal process from 17-May's 1219 high on an active continuation basis below.

These issues considered, a bullish policy and exposure remain advised with a failure below 851.5 required to defer or threaten this call enough to warrant moving to a neutral/sideline position.  In lieu of such weakness, we anticipate a continuation of the past month's rally to new highs and potentially significant gains above 891.0.

Agricultural - Grain Futures Update w/Stephen Davis - 02/26/2021
China is currently upholding their end of the Phase 1 Trade Deal signed last year and is currently buying U.S. grains at an unprecedented rate. Stephen Davis dives into this and comments on how it will impact grains going forward.
Agricultural - Weakness in Live Cattle Market

Even though we’ve seen a decent bounce from yesterday’s session, weakness still remains in the April cattle market. On the cash side of things, the USDA boxed beef cutout was down 8-cents at mid-session yesterday and closed 36-cents lower at $240.39. This was up from $238.85 the previous week. Cash live cattle traded steady with last week in most regions, except Iowa/Minnesota, which was higher. In Iowa/Minnesota 469 head traded at 112.25-117 and an average price of 115.29, up from an average of 114.50 last week. In Kansas, 238 traded at 114 versus an average of 113.99 last week. In Nebraska, 1,929 head traded at 114 versus an average of 113.76 last week. In Texas/Oklahoma, 41 head traded at 114 versus an average of 114 last week.

US beef export sales for the week ending February 18 came in at 8,470 tonnes, down from 22,868 the previous week and the lowest since December 31. Cumulative sales have reached 334,189 tonnes, up from 271,753 a year ago and the highest on record. The five-year average is 214,730 tonnes. The largest buyer this week was South Korea at 3,832 tonnes, closely followed by Japan at 3,098. The next largest buyer was Mexico at 687 tonnes. China cancelled 960. South Korea has the most commitments for 2021 at 95,349 tonnes, followed by Japan at 70,371, China at 43,536, and Hong Kong at 43,228. I would still be looking for this market to trend lower and have a price target range around the next level of support which looks to be around $120. With China cancelling a lot of their orders, this could send the market into further bear territory, on the other hand all we needs is some good fundamental news coming out of the CCP in.

Live Cattle Apr '21 Daily Chart
Equity - Stocks Looking to Rally

U.S. stock futures quickly rallied off their lows this morning after a release of a Federal Reserve inflation gauge that calmed some worries of the rising interest rate. The Fed released their personal consumption index expenditures price index, PCE, showing an increase of 0.3% for the month which was slightly ahead of the expected 0.2%. Conversely, yields on treasuries dropped after this release. The 10- year slipped close to 5 basis points to 1.47% after seeing a high above 1.6% on Thursday. The 10-year, a bond rate used as a benchmark for auto and mortgage loans, is up a surprising 50 basis points since the beginning of the year. Traders will also be looking at Congress today as the Democratic-controlled U.S. House of Representatives looks to pass President Biden’s $1.9 trillion coronavirus aid bill. This would be his first major legislative victory of his presidency.

Support today is 376000 and 37200 with resistance checking in at 389000 and 3980000.

E-mini S&P 500 Mar '21 Daily Chart
If you have any questions or would like to discuss the markets further, please feel free to contact me at 888-861-1656 or jyasak@rjofutures.com.
Economy - S-T Mo Failure Insufficient to End RBOB Correction, But Beware

Posted on Nov 08, 2022, 07:51 by Dave Toth

In Fri's Technical Webcast we identified a minor corrective low at 2.6328 from Thur as a mini risk parameter the market needed to sustain gains above to maintain a more immediate bullish count.  The 240-min chart below shows the market's failure overnight below this level, confirming a bearish divergence in very short-term momentum.  This mo failure defines Fri's 2.8172 high as one of developing importance and a parameter from which very short-term traders can objectively base non-bullish decisions like long-covers.

Given the magnitude of the past three weeks' broader recovery however, this short-term momentum failure is of an insufficient scale to conclude anything more than another correction within this broader recovery from 26-Sep's 2.1877 low.  Indeed, overnights failure below 2.6328 only allows us to conclude the end of the portion of the month-and-a-half rally from 31-Oct's 2.4822 next larger-degree corrective low.  2.4822 is the risk parameter this market still needs to fail below to break the uptrend from 18-Oct's 2.3526 low while this 2.3526 low remains intact as the risk parameter this market needs to fail below to break the month-and-a-half uptrend.  From an intermediate-to-longer-term perspective, this week's setback falls well within the bounds of another correction ahead of further gains.  This is another excellent example of the importance of technical and trading SCALE and understanding and matching directional risk exposure to one's personal risk profile.

The reason overnight's admittedly minor mo failure might have longer-term importance is the 2.8172-area from which it stemmed.  In Fri's Technical Blog we also noted the market's engagement of the 2.8076-to-2.8159-area marked by the 61.8% retrace of Jun0-Sewp's 3.2758 -2.1877 decline and the 1.000 progression of Sep-Oct's initial 2.1877 - 2.6185 (suspected a-Wave) rally from 18-Oct's 2.3526 (suspected b-Wave) low.  We remind longer-term players that because of the unique and compelling confluence of:

  • early-Aug's bearish divergence in WEEKLY momentum amidst
  • historically extreme bullish sentiment/contrary opinion levels in our RJO Bullish Sentiment Index
  • an arguably complete and massive 5-wave Elliott sequence from Mar'20's 0.4605 low to Jun's 4.3260 high (as labeled in the weekly log active-continuation chart below) and
  • the 5-wave impulsive sub-division of Jun-Sep's (suspected initial 1st-Wave) decline

The recovery attempt from 26-Sep's 2.1877 low is arguably only a 3-wave (Wave-2) corrective rebuttal to Jun-Sep's decline within a massive, multi-quarter PEAK/reversal process.  Now granted, due to the magnitude of 2020 -2022's secular bull market, we discussed the prospect for this (2nd-Wave corrective) recovery to be "extensive" in terms of both price and time.  A "more extensive" correction is typified by a retracement of 61.8% or more and spanning weeks or even months following a 3-month decline.  Per such, the (suspected corrective) recovery from 26-Sep's 2.1877 low could easily have further to go, with commensurately larger-degree weakness than that exhibited this week (i.e., a failure below at least 2.4822) required to consider the correction complete.  Indeed, the daily log chart above shows the market thus far respecting former 2.6185-area resistance from 10-Oct as a new support candidate.

These issues considered, very shorter-term traders have been advised to move to a neutral/sideline position following overnight's momentum failure below 2.6328, with a recovery above 2.8172 required to negate this call, reaffirm the recovery and re-expose potentially significant gains thereafter.  For intermediate- and longer-term players, a bullish policy and exposure remain advised with a failure below 2.4822 required to threaten this call enough to warrant neutralizing exposure.  We will be watchful for another bearish divergence in momentum following a recovery attempt that falls short of Fri's 2.8172 high that would be considered the next reinforcing factor to a count calling that 2.8172 high the prospective end to the month-and-a-half 2nd-Wave correction.  In lieu of such, a resumption of the current rally to eventual new highs above 2.8172 should not surprise.

Economy - Futures Market Outlook w/John Caruso - 02/26/2021

Risk happens slowly, and then all at once. This was certainly the case in the bond/interest rates market yesterday. The 10yr yield crept higher overnight to 1.48%, eclipsed the 1.50% mark late morning, and then spiked to 1.61%, wreaking havoc on the bond market, and simultaneously spooking the stock market.  Perhaps the most significant development was the 10yr benchmark yield eclipsing the S&P 500 dividend yield. Why?  In short, it’s a signal of direct competition to the stock market.  It’s a wake-up call to investors that stocks may no longer be the only game in town to capture yield going forward. Believe it or not, there’s plenty of institutional investors/pensions in this world that would be ok with parking a portion of their liquid capital in government bonds at 1.50% vs having to be “all in” on higher risk investments aka stocks to capture yield. But, 1.50% is still a paltry return, and also arguably adjusted for inflation and devalued dollars over a 10yr horizon may be ultimately be a poor investment, which is still a reason we like the short side in bonds (and long side of stocks) and think debt market investors will continue to demand higher yields based upon inflation aka higher commodity price expectations.  Congratulations for those that were on board with this market call with us since Nov/Dec. And it’s likely not over yet.  Sharpen your knives because we’ll be back in on the short side of bonds headed into headline CPI in 2 weeks. 

Stocks- we’re still hunting for long side entries. We’re not even remotely close to positioning for what we think may be coming in the back half of this year, so let’s just put those questions to rest. I have no fundamental nor quantitative reason go there yet. Believe me, I love shorting stocks, and you’ll be the first to know when we make that leap. For now, Growth/Inflation accelerating, and strong earnings accelerations through Q2 remains our call….long stocks, short bonds, long commodities.  Remember, we’re comparing y/y to the government shutdown in Q2 2020. Value stocks will likely continue to outperform, as they were the most affected by the pandemic and shutdown whereas tech was largely considered the “Stay at Home” stocks, and will have a difficult time (dare I say impossible time) beating y/y growth expectations in EPS and Profits – hence the flatlining/weakening chart structures of AAPL and AMZN.  Hope that makes sense.  Wall st is or at least should be chasing the high beta garbage small cap stocks…I mean honestly how much longer can they get away with charging 2% and 20% to buy and hold FAANG stocks?  Anybody can do that, and most do. 

Dollar- bounce…we’ve been expecting one. The dollar is going to move from immediate OS yesterday at the low end of the range, to close to immediate OB. Dollar likes “up rates” and “down stocks” and that’s precisely the formula we have this morning. We’re still largely dollar bears, so we’ll hunt for short opportunities here in coming days/weeks. Dollar remains bearish trend, and bearish in our model in Scenario 2. 

The Fed’s favorite inflation indicator = PCE Index +1.5% vs 1.4% y/y

If you have any questions or would like to discuss the markets further, please feel free to contact me at 800-669-5354 or jcaruso@rjofutures.com.

Coming Up Next Week...

View Futures Calendar