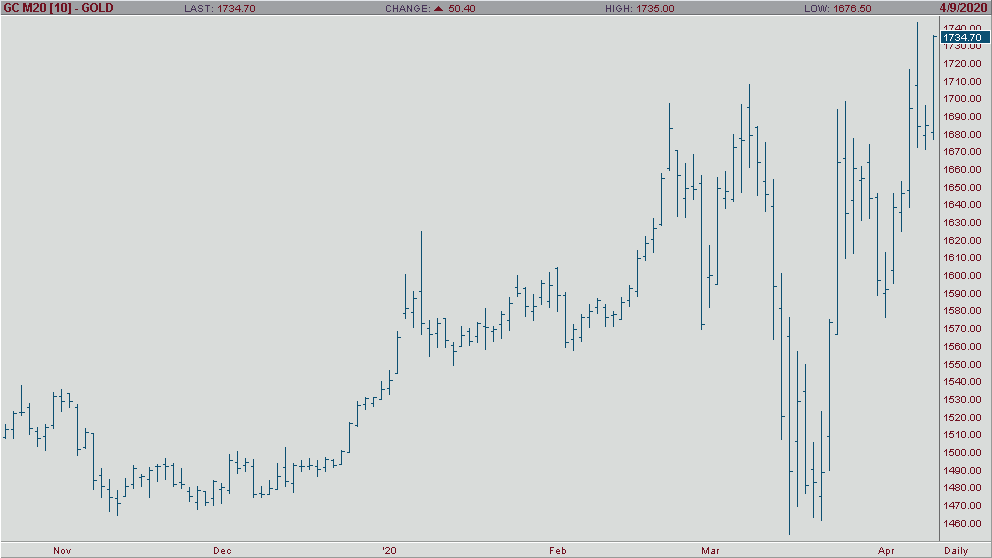
In the early morning trade, after a dismal two days, the
shiny one has rallied hard back above $1,700 an ounce and is now currently
trading at nears session highs of $,1728. This morning’s jobless claims beat
estimates of 5-million coming in at 6.6 million people filling for unemployment
in the last week. Yesterday, the Feds released their minutes from the March
meeting, which basically states that they will leave rates near zero until the
U.S. shows signs of a recovery and should surely help to continue to propel
gold to even higher prices. Furthermore, the gold bulls, should enjoy news of
450,000 gold miners being sent home in South Africa and could take them 3-4
weeks to get production back up and slowing gold production down this month by
more than 20%.
If we take a quick look at the daily June gold chart, you’ll clearly see that during the pull back this week that it held the highs of the week and the bullish trendline along with nearing the highs of the week and flirting with closing at the highs of the week. I’m not sure how many traders/investors alike will want or feel safe going home short gold.
Gold June '20 Daily ChartMetals - Bulls Hold the Edge in Silver
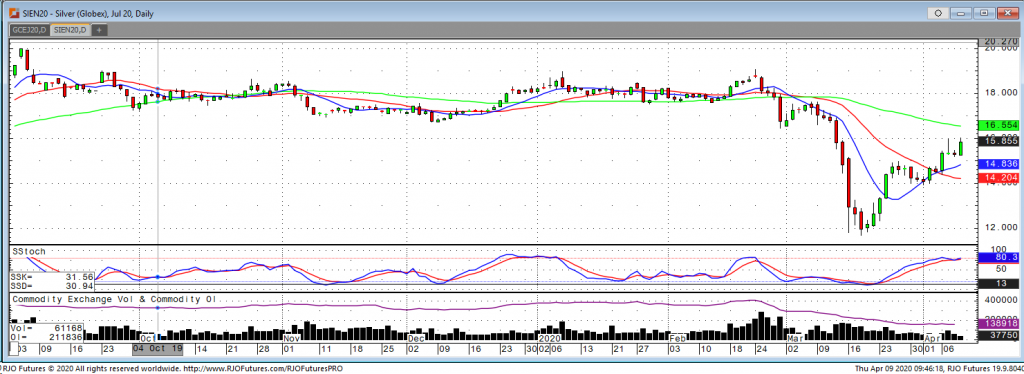
The markets continue to react to signs that COVID-19 might be plateauing in the world, but the ripple effect has and will continue to hurt the economy. The North American session will begin with the weekly initial jobless claims which continue to be on the higher end of estimates. While the silver market may not be showing as impressive gains as gold, the charts are positive and the possibility to see silver trade above $16.00 seems to be something we can’t rule out. The action by U.S. lawmakers to push for additional loans and monetary stimulus has helped the bull case, it should also be noted that silver ETFs added an estimated 8.1 million ounces of holdings bringing net purchases just shy of 50 million ounces.
Silver has been on a bullish uptrend since hitting its low of 11.65 in March. We saw initial resistance at $14.74, which caused Silver to trade in a tight range between $14.00 and $14.74 before breaking out to the upside as selling pressure relieved and buying pressure commenced. A pullback to $14.75 maybe healthy and would also allow people to use this a “load zone” otherwise if we can break $16.00 we could see a leg higher without a pullback.
Silver Jul '20 Daily Chart If you have any questions or would like to discuss the markets further, please feel free to contact me at 800-826-2270 or therrmann@rjofutures.com. Energy - Crude Oil Assessing Production Cuts
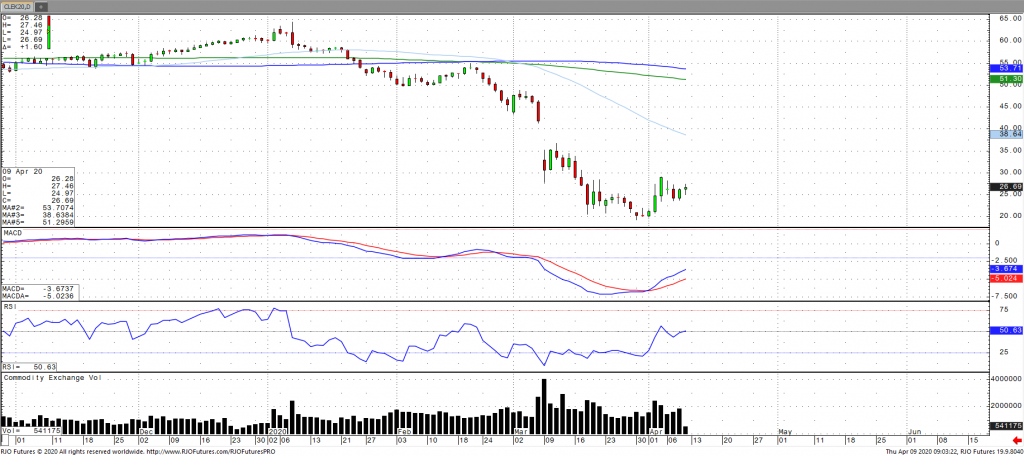
Oil has continued to press higher after surging over 11% yesterday as prices weigh the potential of market driven cuts amid the fallout from the massive demand destruction from the coronavirus. This comes amidst a record build in weekly stockpiles of 15.2 barrels (EIA) as refiners pulled back operations to the lowest since 2011, which was in part offset by the highest production decline since September. Oil has garnered support under the pretense of impending production cuts that would reduce global output by about 10 million barrels a day. However, the agreement has yet to be solidified as Russia remains doubtful of American contributions. In addition, reports are that Moscow and Riyadh are in continued disagreement regarding baseline and volume for the cuts. The world’s largest oil producers will meet Thursday and Friday in an effort to curtail the flood of crude which, seemingly, may not be enough to offset this demand loss. Moreover, energy ministers from the G-20 are set to meet in a video conference on Friday in order to ‘ensure stable energy markets and enable a stronger global economy.’ Again, oil levels may continue to remain imbalanced provided deeper than expected cuts as storage levels would continue to be saturated and eventual production shutdowns needed as distressed producers continue to move physical and spot prices lower. The market remains bearish trend with today’s range seen between 17.62 – 29.92.
Crude Oil May '20 Daily Chart If you have any questions or would like to discuss the markets further, please feel free to contact me at 800-438-4805 or aturro@rjofutures.com. Softs - Coronavirus Still Controls Cocoa Trade, Demand Concerns Deepen
Coronavirus Still Controls Cocoa Trade, Demand Concerns Deepen
By: Peter MoosesPosted 04/08/2020
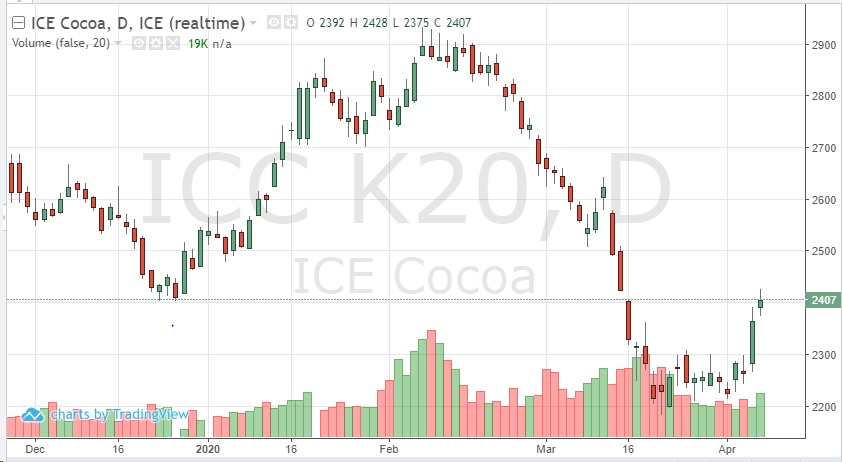
Although
the May cocoa contract appears to have made the turn higher, it may be
short-lived. After a few weeks of consolidation during the recent volatility,
the May futures contract has turned higher trading above 2400. This move has
followed a positive turn in the equities market. As the world continues to
brace for more Coronavirus cases, the market feels as if small positive signs
may be headed our way. Although no one knows how long these recent changes to
everyone’s lifestyle will last, the health industry and government continue to
make efforts to work together and make life safer again. Although we are far away
from being “normal” again, small steps are needed to get there.
Cocoa
does not have its own demand to help this move have any follow-through. There
are many changes to deliveries and ports are closed causing the supply chain to
be affected. Until there is more known about this virus, the softs and food markets
will be trading off day to day news and updates.
Continue to monitor the market closely, if any breaking macro news occurs, it could send cocoa futures in either direction. But technically, the chart is showing traders cocoa wants to break out to the short-term highs we saw just a month ago.
Cocoa May '20 Daily ChartSofts - May Coffee Showing Strong Support
May Coffee Showing Strong Support
By: Adam TuiaanaPosted 04/07/2020
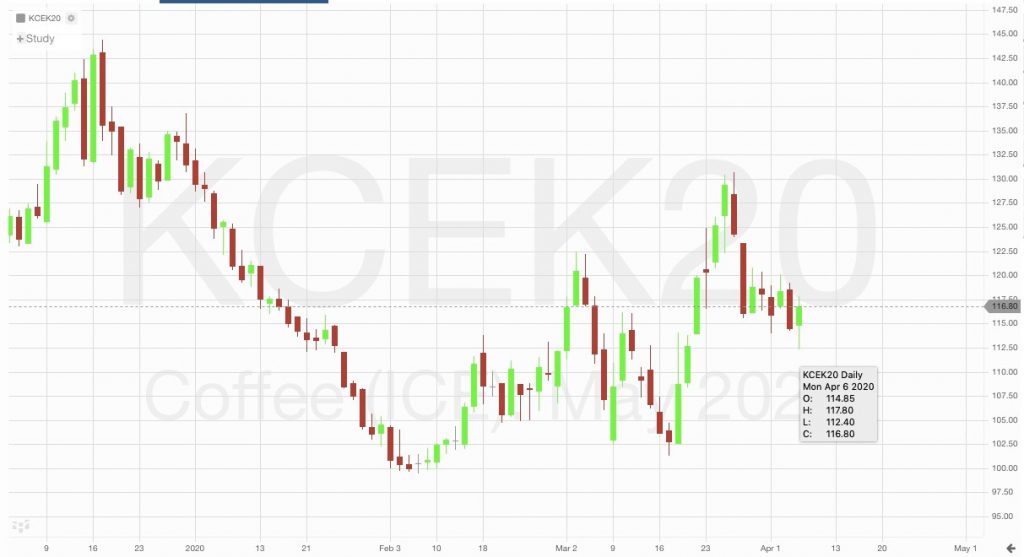
May coffee has been able to hold support above the 116 area, which should be good news for those traders with bullish bias, this recently rally mostly on the back of limited supplies in Brazil, and ongoing issues earlier related to a lack of shipment delays. Our friends at The Hightower Group made a great observation regarding people still have demand but that demand has shifted from people drinking coffee in restaurants, to that of people drinking coffee from home instead. Regarding this shift in demand, The Hightower Group reported that “coffee’s demand outlook has been resilient as stronger supermarket sales have offset lower restaurant and coffee shop sales.”
We continue to see strong levels of volatility as the world continues to battle the COVID-19 virus. Commodities will continue to “price discover” aggressively, as the underlying fundamentals swing back and forth with massive volatility.
On
the heels of mid-Sep-to-early-Oct's steeper, accelerated, 3rd-wave-looking
recovery, the past week-and-a-half's boringly lateral chop is first considered
a corrective/consolidative event that warns of a continuation of the uptrend
that preceded it to new highs above 04-Oct's 891.0 high. This count
remains consistent with our broader base/correction/recovery count introduced
in 13-Sep's Technical Blog following that
day's bullish divergence in short-term momentum above 07-Sep's 809.5 minor
corrective high detailed in the hourly chart below.
The
important takeaway from this month's lateral, sleepy price action is the
definition of Wed's 851.5 low as
the end or lower boundary of a suspected 4th-Wave correction. A failure
below 851.5 will confirm a bearish divergence in daily momentum and defer or
threaten a bullish count enough to warrant non-bullish decisions like
long-covers. A failure below 851.5 will not
necessarily negate a broader bullish count, but it will threaten it enough to
warrant defensive measures as the next pertinent technical levels below 851.5 are
13-Sep's prospective minor 1st-Wave high at 813.8 and obviously 08-Sep's 766.0
low. And making non-bullish decisions "down there" is
sub-optimal to say the least. Per such, both short- and longer-term
commercial traders are advised to pare or neutralize bullish exposure on a
failure below 851.5, acknowledging and accepting whipsaw risk- back above 04-Oct's
891.0 high- in exchange for much deeper and sub-optimal nominal risk below
766.0.
On
a broader scale, the daily log scale chart above shows the developing potential
for a bearish divergence in daily momentum that will be considered confirmed
below 851.5. This chart also shows the past month's recovery thus far
stalling in the immediate neighborhood of the (888.0) Fibonacci
minimum 38.2% retrace of Apr-Sep's entire 1128 - 766 decline). COMBINED
with a failure below 851.5, traders
would then need to be concerned with at least a larger-degree correction pf the
past month's rally and possibly a resumption of Apr-Sep's major downtrend.
Until
and unless the market fails below 851.5 however, we would
remind longer-term players of the key elements on which our bullish count is
predicated:
a confirmed bullish divergence in WEEKLY momentum
(below)
amidst
an
historically low 11% reading in out RJO Bullish Sentiment Index and
a
textbook complete and major 5-wave Elliott sequence down from 29-Apr's
1128 high to 08-Sep's 766.0 low.
Thus
far, the market is only a month into correcting a 4-MONTH, 32% drawdown, so
further and possibly protracted gains remain well within the bounds of a major
(suspected 2nd-Wave) correction of Apr-Sep's decline within an even more
massive PEAK/reversal process from 17-May's 1219 high on an active continuation
basis below.
These
issues considered, a bullish policy and exposure remain advised with a failure
below 851.5 required to defer or threaten this call enough to warrant moving to
a neutral/sideline position. In lieu of such weakness, we anticipate a
continuation of the past month's rally to new highs and potentially significant
gains above 891.0.
Agricultural - Corn Seeing Some Support from Brazil
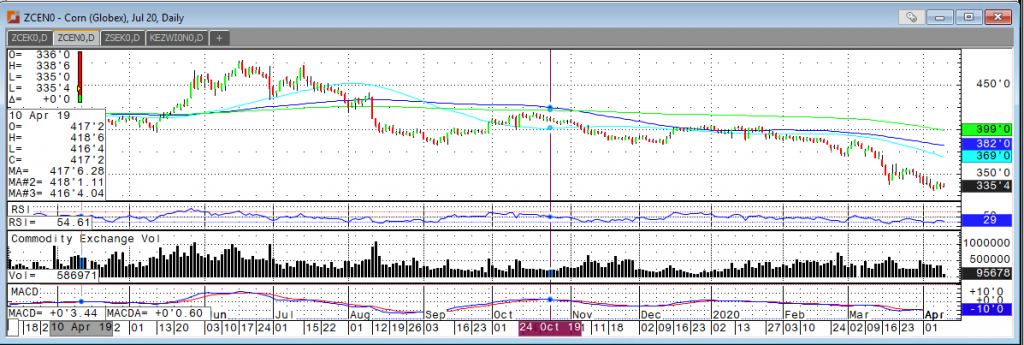
Although the corn market remains in a downtrend, dry
conditions in Brazil’s southern growing region over the next week have
supported corn prices. On top of that, crude oil prices remained stronger
despite the bearish number in the EIA report, this also supported corn as it
leads traders to expect higher ethanol demand. Traders see todays ending stocks
coming in near 2.004 billion bushels as compared with 1.892 billion in
March. Ethanol production for the week
ending April 3rd averaged 672,000 barrels per day. This is down 20% vs. last week and down 32.9%
from last year. Total ethanol production for the week was 4.704 million
barrels, which was the lowest weekly productions reading since May 2009.
China import demand was revised higher to 4 million tonnes, up 1 million from last month and China has already booked more than 1 million tonnes from the U.S. Support for July corn comes in at $3.33 and resistance comes in today at $3.46 and then $3.49.
Corn Jul '20 Daily Chart If you have any questions or would like to discuss the markets further, please feel free to contact me at 800-826-2270 or tcholly@rjofutures.com. Agricultural - Grain Futures Update w/Stephen Davis - 04/09-2020
Grain Futures Update w/Stephen Davis - 04/09-2020
By: Stephen DavisPosted 04/09/2020
RJO Futures Senior Market Strategist, Stephen Davism discusses this weeks moves in the grain futures markets. The coronavirus is heavily impacting worldwide grain demand and it's hard to see where the market will go from hereCurrency - Inflation Will Return When the Dollar Inevitably Breaks
Inflation Will Return When the Dollar Inevitably Breaks
By: Ian BannonPosted 04/09/2020
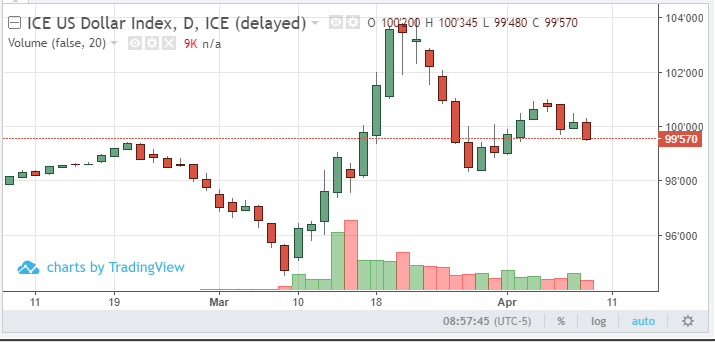
U.S. Dollar Index futures are 57 points lower on Thursday morning as foreign fiat futures are green across the board. Emerging market currencies, like the Mexican peso and Brazilian real, are notable leaders. It is not surprising to see the dollar trending lower, as this morning (and for the last few weeks) the Fed has injected unprecedented levels of liquidity into US economy. Keep an eye out for the Fed minutes being released later today. Which currencies have the most to gain when the greenback inevitably breaks? European currencies are the classic alternative. However, the ECB will be working to debase the euro with high levels of stimulus as well. Emerging market currencies will likely observe relative strength should the dollar weaken enough for inflation to return to the general economy. Higher commodity prices (i.e. inflation) often help to support the domestic currency where those commodities are produced.
USD Jun '20 Daily ChartInterest Rates - Interest Rates Down Amid Stock Rally
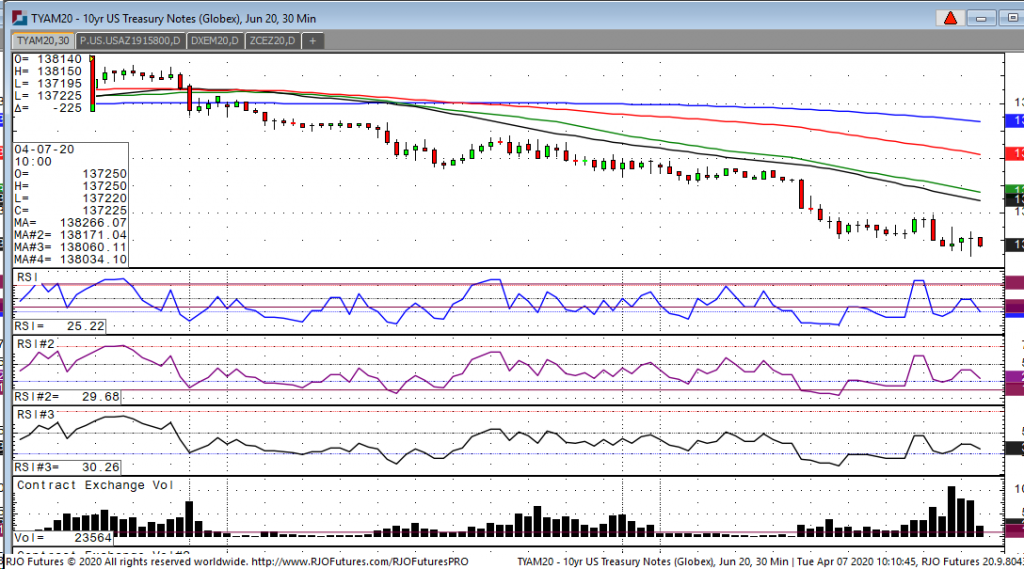
The treasuries have been acting like your typical safe-haven
in the last week as the coronavirus has been spreading and death rates in the U.S.
are continually rising. Yesterday,
however, we saw the rate of new cases fall and that led to some optimism that
this deadly virus might be slowing. Hence, we saw a big rally in the stocks
yesterday and that has continued into today, although stocks are higher this
morning, they are way off the highs. Currently, the ten-year note is down 23 at
137-22, seeing a high made last night at 138-15 and a low this morning at 137-19.
Hopefully the virus is contained, and people are safe as soon as possible.
Traders should be aware that the economy has been damaged from this unfortunate outbreak and must remember that last Thursday we saw 10-million new people file for unemployment. There are going to be long lasting ripples in the economy as most companies have been shut down for a month, so I would not expect the stock market to enter a new bull phase anytime soon. As we move forward, I would expect we see lots of volatility in both treasuries and stock alike, but I would not expect much more in the way of downside in notes, simply because of the immense damage we have seen in the U.S. economy.
10-Year Note Jun '20 30 Min Chart If you have any questions or would like to discuss the markets further, please feel free to contact me at 800-826-2270 or gperlin@rjofutures.com. Equity - Stocks Ripping on News of 2.3 Trillion Dollar Stimulus
Stocks Ripping on News of 2.3 Trillion Dollar Stimulus
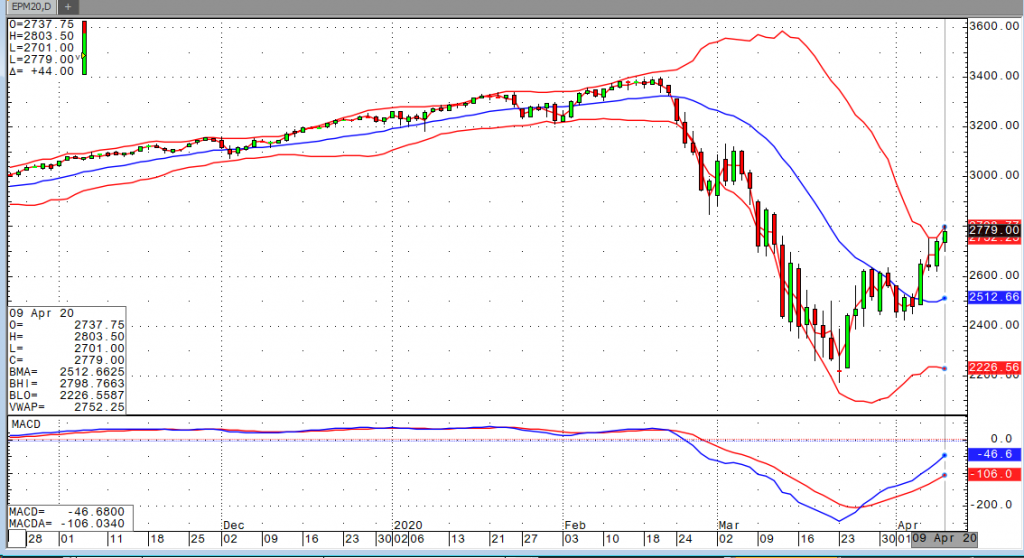
The market looked poised to take a bit of a breather in the early going this morning. The E-mini S&P futures were on their lows just 10-minutes prior to a horrid jobless claims reading of 6.6M. I’m not suggesting that anyone was surprised by that figure, but one would think that such a number would start to apply the brakes on the rally we’ve seen over the past couple weeks. That very well may have been the case, but the Fed came to the rescue yet again with news of a stimulus package totaling up to $2.3 trillion. The markets discounted the jobless claims data and printed new highs for the recovery on the announcement.
The move has taken the E-mini S&P futures above the 50% retracement level of 2785.75 for the June contract. We can argue about the sustainability of this rally given what are likely to be lasting effects of this shutdown. One thing that’s for certain though is that it’s awfully tough to fight the Fed and the kinds of measures they’ve taken. Markets are closed tomorrow. Please continue to be safe, and enjoy your long weekend.
E-mini S&P 500 Jun '20 Daily Chart
If you have any questions or would like to discuss the markets further, please feel free to contact me at 800-669-5354 or bdixon@rjofutures.com. Economy - S-T Mo Failure Insufficient to End RBOB Correction, But Beware
S-T Mo Failure Insufficient to End RBOB Correction, But Beware
By: RJO Market InsightsPosted 11/08/2022
Posted on Nov 08, 2022, 07:51 by Dave Toth
In Fri's Technical Webcast we identified a
minor corrective low at 2.6328 from Thur as a mini risk parameter the market
needed to sustain gains above to maintain a more immediate bullish count.
The 240-min chart below shows the market's failure overnight below this level,
confirming a bearish divergence in very short-term momentum. This mo
failure defines Fri's 2.8172 high as
one of developing importance and a parameter from which very short-term traders
can objectively base non-bullish decisions like long-covers.
Given
the magnitude of the past three weeks' broader recovery however, this
short-term momentum failure is of an insufficient scale to conclude anything
more than another correction within this broader recovery from 26-Sep's 2.1877
low. Indeed, overnights failure below 2.6328 only allows us to conclude
the end of the portion of the month-and-a-half rally from 31-Oct's 2.4822 next
larger-degree corrective low. 2.4822 is the
risk parameter this market still needs to fail below to break the uptrend from
18-Oct's 2.3526 low while this 2.3526 low
remains intact as the risk parameter this market needs to fail below to break
the month-and-a-half uptrend. From an
intermediate-to-longer-term perspective, this week's setback falls well within
the bounds of another correction ahead of further gains. This is another
excellent example of the importance of technical and trading SCALE and
understanding and matching directional risk exposure to one's personal risk
profile.
The
reason overnight's admittedly minor mo failure might have longer-term
importance is the 2.8172-area from which it stemmed. In
Fri's Technical Blog we also noted the market's engagement of the
2.8076-to-2.8159-area marked by the 61.8% retrace of Jun0-Sewp's 3.2758 -2.1877
decline and the 1.000 progression of Sep-Oct's initial 2.1877 - 2.6185
(suspected a-Wave) rally from 18-Oct's 2.3526 (suspected b-Wave) low. We
remind longer-term players that because of the unique and compelling confluence
of:
early-Aug's bearish divergence in WEEKLY momentum
amidst
historically
extreme bullish sentiment/contrary opinion levels in our RJO Bullish
Sentiment Index
an
arguably complete and massive 5-wave Elliott sequence from Mar'20's 0.4605
low to Jun's 4.3260 high (as labeled in the weekly log active-continuation
chart below) and
the
5-wave impulsive sub-division of Jun-Sep's (suspected initial 1st-Wave) decline
The
recovery attempt from 26-Sep's 2.1877 low is arguably only a 3-wave (Wave-2)
corrective rebuttal to Jun-Sep's decline within a massive, multi-quarter
PEAK/reversal process. Now granted, due to the magnitude of 2020 -2022's
secular bull market, we discussed the prospect for this (2nd-Wave corrective)
recovery to be "extensive" in terms of both price and time. A
"more extensive" correction is typified by a retracement of 61.8% or
more and spanning weeks or even months following a 3-month decline. Per
such, the (suspected corrective) recovery from 26-Sep's 2.1877 low could easily
have further to go, with commensurately larger-degree weakness than that
exhibited this week (i.e., a failure below at least 2.4822) required
to consider the correction complete. Indeed, the daily log chart above
shows the market thus far respecting former 2.6185-area resistance from 10-Oct
as a new support candidate.
These
issues considered, very shorter-term traders have been advised to move to a neutral/sideline
position following overnight's momentum failure below 2.6328, with a recovery
above 2.8172 required to negate this call, reaffirm the recovery and re-expose
potentially significant gains thereafter. For intermediate- and
longer-term players, a bullish policy and exposure remain advised with a
failure below 2.4822 required to threaten this call enough to warrant
neutralizing exposure. We will be watchful for another bearish divergence
in momentum following a recovery attempt that falls short of Fri's 2.8172 high
that would be considered the next reinforcing factor to a count calling that
2.8172 high the prospective end to the month-and-a-half 2nd-Wave
correction. In lieu of such, a resumption of the current rally to
eventual new highs above 2.8172 should not surprise.