Looking to diversify your investment portfolio with futures trading, but lack the expertise on your own? Trading Systems and their programs are now listed on our website complete with track records, products traded and minimum account requirements and fees. If you need help navigating the site and viewing the results, give us a call.
New: RJO Futures Special Report on Grains
The USDA Planting Intentions Report is our and RJO Futures has you covered. Our Grains Special report covers all the important facts outlined in the USDA report and explains how they will impact the grains market. It looks like grains may go off here soon so don’t miss out!
The Markets
Metals - Gold Fails to Follow Through
Gold Fails to Follow Through
By: Frank J. Cholly, Senior Market StrategistPosted Apr 9, 2021 8:55AM CT
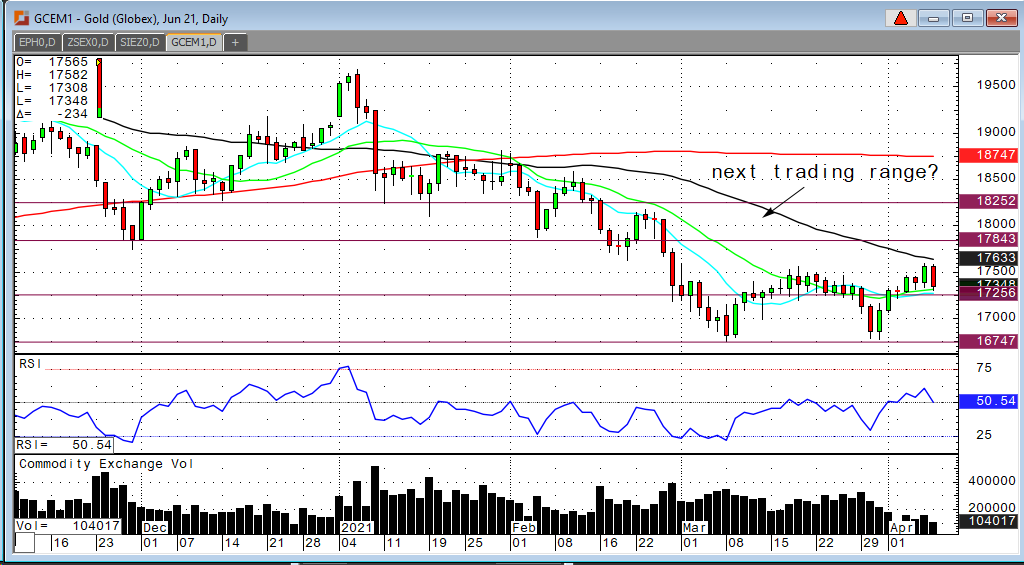
Precious metals dipping after failing to breakout above
$1,760. The market has in my opinion bottomed and will likely challenge
yesterday’s swing high just under $1,760. The 50 DMA comes in at $1,763.30 for
June gold. A close above that level will encourage the bulls to add. Some
inflationary US data would also support. I see the gold market establishing a
“new” trading range between $1,785 and $1,825. Expect gold to hold support
around $1,725.
Platinum also failed to breakout above $1,250 this week.
Good support around $1,190 to $1,200 should hold. The next attempt to take out
$1,250 should quickly lead to $1,275 and possibly $1,300.
I continue to be long term bullish precious metals. I’ve discussed my thoughts on inflation, money supply and rising yields on ten-year notes. I see rates moving much higher and that should also move gold much higher.
Gold Jun '21 Daily Chart If you have any questions or would like to discuss the markets further, please feel free to contact me at 800-826-4124 or fcholly@rjofutures.com. Metals - Silver Struggling
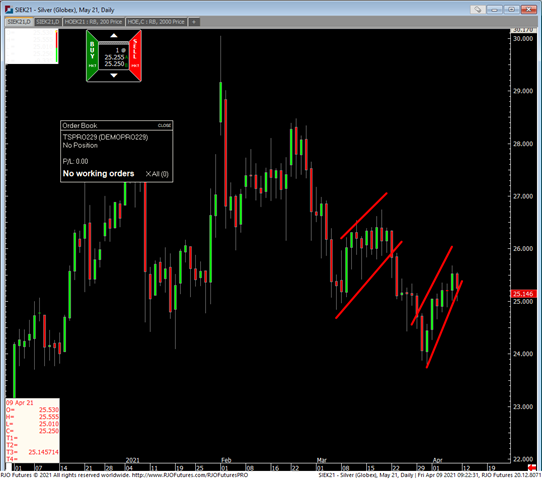
Silver is struggling to hold above $25.00 with even weakness in the dollar this morning. The weak dollar and weak metals are usually not good for silver bulls. The Fed is on the watch for inflation as they are data-dependent in their forward guidance. The most recent dialog from the Fed suggests that inflation concerns are, at least for now, pushed to later part of 2021. The primary focus now is how to quickly ignite the economy as governments are ramping up covid-19 vaccine deadlines. There is of course a concern of variant strains of Covid-19, but faster vaccination initiatives would reduce the overall concern. The faster the vaccination schedules, the better for silver in my view.
From a technical perspective, silver needs to continue to hold above $25.00 to come out of this “ flag” like chart formation that could spell a “wash” to $24.00 or lower if silver fails to hold above $25.00. The upside target could be above $25.50 near terms and a break above $26.00 would probably signal near terms lows are in.
Silver May '21 Daily Chart If you have any questions or would like to discuss the markets further, please feel free to contact me at 800-367-7290 or etesfaye@rjofutures.com. Energy - Oil Poised for Weekly Loss
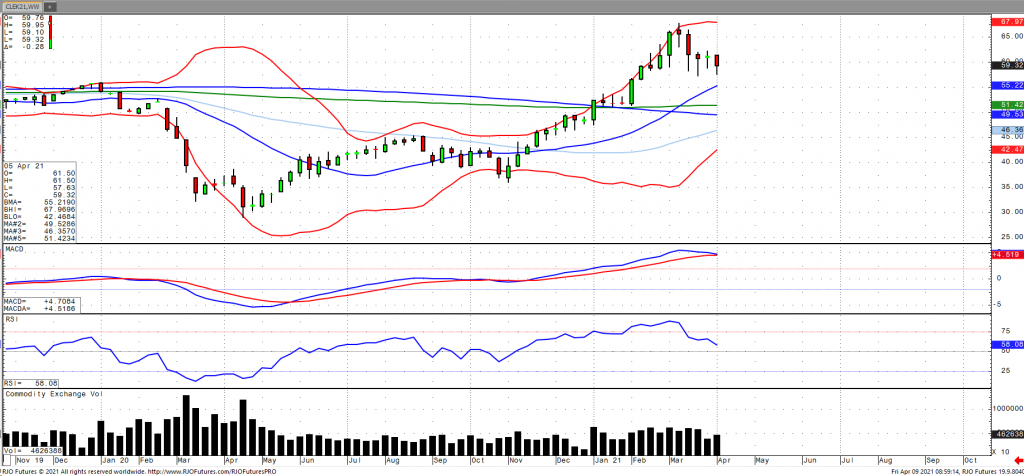
Oil prices are poised for a weekly loss of over 3% as the market assess rising supply amidst reports that OPEC+ will be gradually increasing supplies by 2 million barrels per day from May through July, as well as the subsequent impact on fuel demand from the ongoing pandemic. Global inventories, however, are expected to continue to fall as the demand outlook gradually improves as the global recovery accelerates. While the initial fall in weekly oil stocks fell was supportive, gasoline stocks jumped sharply, ahead of the expected increase in seasonal demand, according to the EIA. This comes amid an increase in the refinery rate of about 25% over the course of the last month. Oil volatility (OVX) continues to fall as the market remains bullish trend with today’s range seen between 58.01 – 63.15.
Crude Oil May '21 Daily Chart If you have any questions or would like to discuss the markets further, please feel free to contact me at 800-438-4805 or aturro@rjofutures.com. Softs - Continues Pressure on Cocoa Prices Due to Covid-19 Restrictions
Continues Pressure on Cocoa Prices Due to Covid-19 Restrictions
By: Peter MoosesPosted 04/09/2021
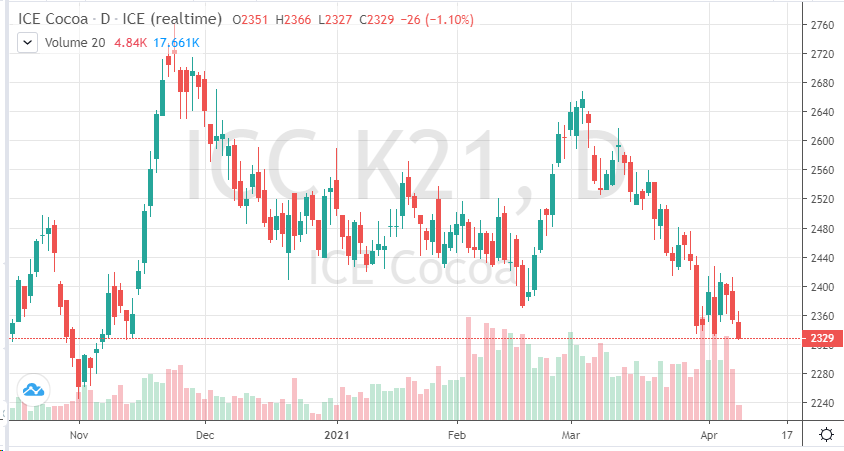
Same story, different day for cocoa futures. Lack of demand continues to pull cocoa prices lower. The chart looks bearish, short-term outlook for demand is bleak. Cocoa futures have found support at lower and lower levels the past week. Although the global vaccine rollout has been somewhat promising, issues overseas has caused concern in the markets. Lockdown measures still in place in some areas as Covid-19 cases rise again continue to hurt a chance of a recovery in cocoa prices. European demand has been weak, chocolate companies continue to report weaker earnings. Continue to monitor prices in the currencies correlated to cocoa, Euro and Pound specifically. For now, traders should follow the technicals. If cocoa finds a bottom on Friday’s trading day, look for a short-term bounce to start the week if the COT data is positive.
On
the heels of mid-Sep-to-early-Oct's steeper, accelerated, 3rd-wave-looking
recovery, the past week-and-a-half's boringly lateral chop is first considered
a corrective/consolidative event that warns of a continuation of the uptrend
that preceded it to new highs above 04-Oct's 891.0 high. This count
remains consistent with our broader base/correction/recovery count introduced
in 13-Sep's Technical Blog following that
day's bullish divergence in short-term momentum above 07-Sep's 809.5 minor
corrective high detailed in the hourly chart below.
The
important takeaway from this month's lateral, sleepy price action is the
definition of Wed's 851.5 low as
the end or lower boundary of a suspected 4th-Wave correction. A failure
below 851.5 will confirm a bearish divergence in daily momentum and defer or
threaten a bullish count enough to warrant non-bullish decisions like
long-covers. A failure below 851.5 will not
necessarily negate a broader bullish count, but it will threaten it enough to
warrant defensive measures as the next pertinent technical levels below 851.5 are
13-Sep's prospective minor 1st-Wave high at 813.8 and obviously 08-Sep's 766.0
low. And making non-bullish decisions "down there" is
sub-optimal to say the least. Per such, both short- and longer-term
commercial traders are advised to pare or neutralize bullish exposure on a
failure below 851.5, acknowledging and accepting whipsaw risk- back above 04-Oct's
891.0 high- in exchange for much deeper and sub-optimal nominal risk below
766.0.
On
a broader scale, the daily log scale chart above shows the developing potential
for a bearish divergence in daily momentum that will be considered confirmed
below 851.5. This chart also shows the past month's recovery thus far
stalling in the immediate neighborhood of the (888.0) Fibonacci
minimum 38.2% retrace of Apr-Sep's entire 1128 - 766 decline). COMBINED
with a failure below 851.5, traders
would then need to be concerned with at least a larger-degree correction pf the
past month's rally and possibly a resumption of Apr-Sep's major downtrend.
Until
and unless the market fails below 851.5 however, we would
remind longer-term players of the key elements on which our bullish count is
predicated:
a confirmed bullish divergence in WEEKLY momentum
(below)
amidst
an
historically low 11% reading in out RJO Bullish Sentiment Index and
a
textbook complete and major 5-wave Elliott sequence down from 29-Apr's
1128 high to 08-Sep's 766.0 low.
Thus
far, the market is only a month into correcting a 4-MONTH, 32% drawdown, so
further and possibly protracted gains remain well within the bounds of a major
(suspected 2nd-Wave) correction of Apr-Sep's decline within an even more
massive PEAK/reversal process from 17-May's 1219 high on an active continuation
basis below.
These
issues considered, a bullish policy and exposure remain advised with a failure
below 851.5 required to defer or threaten this call enough to warrant moving to
a neutral/sideline position. In lieu of such weakness, we anticipate a
continuation of the past month's rally to new highs and potentially significant
gains above 891.0.
Agricultural - Grain Futures Update w/Stephen Davis - 04/09/2021
Grain Futures Update w/Stephen Davis - 04/09/2021
By: Stephen DavisPosted 04/09/2021
Stephen Davis discusses the latest news in the grain markets, including continued fallout from last week's USDA Planting Intentions Report.
Agricultural - Live Cattle Showing Strength
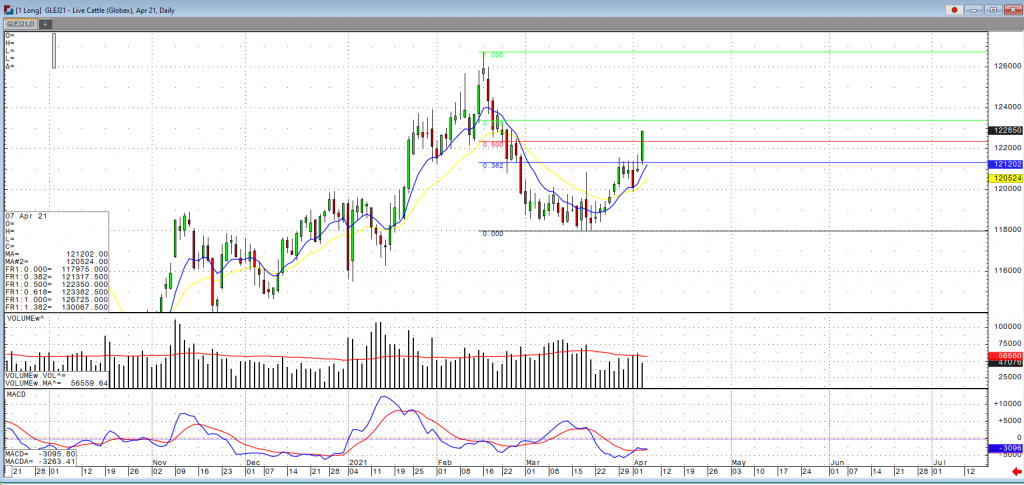
Live Cattle Showing Strength
By: Peter McGinnPosted 04/07/2021
The cattle market is continuing to show signs of strength with cash cattle trending higher this week and last. With what is going on with cash prices, we are starting to Apr cattle trade higher along with the June futures. Traders expect to see the June futures to start forming a top as it has continually reached [and eventually took out] every swing point in the market. Packers have been bidding about $4 higher and those bids are being sold by some feedlots fearing that they might not be able to move cattle next week or get a more competitive bid. Strong boxed beef prices indicate demand is surging as consumers want beef for grilling and restaurants want beef to satisfy customer demand. Packers need to purchase cattle and are hopeful bidding $4.00 higher early may get the job done. The USDA boxed beef cutout was up $3.30 at mid-session yesterday and closed $4.10 higher at $262.77. This was up from $244.83 the previous week and the highest the cutout had been since June 4. Cash live cattle continues to trend higher. In Kansas, 1,187 head traded at $121.00, up from $116.00-$118.00 last week. June cattle traded moderately higher on the session yesterday and posted contract highs for the third session in a row. The USDA estimated cattle slaughter came in at 120,000 head yesterday. This brings the total for the week so far to 225,000 head, down from 239,000 last week but up from 212,000 a year ago.
Live Cattle Apr '19 Daily ChartCurrency - Bitcoin Futures: What You Need to Know!
Bitcoin Futures: What You Need to Know!
By: Adam TuiaanaPosted 04/08/2021
Adam educates viewers on Bitcoin futures, including the full and soon-to-be-traded Micro Bitcoin futures. Adam provides insight to the Bitcoin futures contract specifications, leverage, tick sizes, and much more. CME Micro Bitcoin futures will become tradeable on May 3rd, 2021.Equity - Stocks Looking Flat This Morning
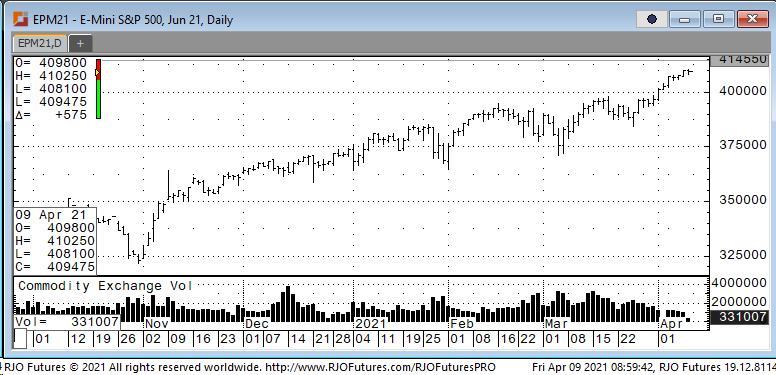
Stock futures are trading flat this morning but are still
poised to record another big weekly gain, continuing its longest winning streak
since October. Early trading saw a
slight increase of 0.1% after setting a 19th all-time high on
Thursday. This would be the third
straight week of gains, a first in six months.
Jerome Powell spoke this week on how the Federal Reserve was looking for
“actual progress’ rather than “forecasts” for progress toward the central banks
employment and inflation goals. He also
reiterated that they would like to see a “string of moths” with a strong job
report before considering a pull back on its current asset purchase policy.
Last week had seen an increase of non-farm payrolls of 916,000 in March, the
fastest growth since August.
Support today is 408000 and 406500 with resistance showing 410500 and 411500.
E-mini S&P 500 Jun '21 Daily Chart If you have any questions or would like to discuss the markets further, please feel free to contact me at 888-861-1656 or jyasak@rjofutures.com. Economy - S-T Mo Failure Insufficient to End RBOB Correction, But Beware
S-T Mo Failure Insufficient to End RBOB Correction, But Beware
By: RJO Market InsightsPosted 11/08/2022
Posted on Nov 08, 2022, 07:51 by Dave Toth
In Fri's Technical Webcast we identified a
minor corrective low at 2.6328 from Thur as a mini risk parameter the market
needed to sustain gains above to maintain a more immediate bullish count.
The 240-min chart below shows the market's failure overnight below this level,
confirming a bearish divergence in very short-term momentum. This mo
failure defines Fri's 2.8172 high as
one of developing importance and a parameter from which very short-term traders
can objectively base non-bullish decisions like long-covers.
Given
the magnitude of the past three weeks' broader recovery however, this
short-term momentum failure is of an insufficient scale to conclude anything
more than another correction within this broader recovery from 26-Sep's 2.1877
low. Indeed, overnights failure below 2.6328 only allows us to conclude
the end of the portion of the month-and-a-half rally from 31-Oct's 2.4822 next
larger-degree corrective low. 2.4822 is the
risk parameter this market still needs to fail below to break the uptrend from
18-Oct's 2.3526 low while this 2.3526 low
remains intact as the risk parameter this market needs to fail below to break
the month-and-a-half uptrend. From an
intermediate-to-longer-term perspective, this week's setback falls well within
the bounds of another correction ahead of further gains. This is another
excellent example of the importance of technical and trading SCALE and
understanding and matching directional risk exposure to one's personal risk
profile.
The
reason overnight's admittedly minor mo failure might have longer-term
importance is the 2.8172-area from which it stemmed. In
Fri's Technical Blog we also noted the market's engagement of the
2.8076-to-2.8159-area marked by the 61.8% retrace of Jun0-Sewp's 3.2758 -2.1877
decline and the 1.000 progression of Sep-Oct's initial 2.1877 - 2.6185
(suspected a-Wave) rally from 18-Oct's 2.3526 (suspected b-Wave) low. We
remind longer-term players that because of the unique and compelling confluence
of:
early-Aug's bearish divergence in WEEKLY momentum
amidst
historically
extreme bullish sentiment/contrary opinion levels in our RJO Bullish
Sentiment Index
an
arguably complete and massive 5-wave Elliott sequence from Mar'20's 0.4605
low to Jun's 4.3260 high (as labeled in the weekly log active-continuation
chart below) and
the
5-wave impulsive sub-division of Jun-Sep's (suspected initial 1st-Wave) decline
The
recovery attempt from 26-Sep's 2.1877 low is arguably only a 3-wave (Wave-2)
corrective rebuttal to Jun-Sep's decline within a massive, multi-quarter
PEAK/reversal process. Now granted, due to the magnitude of 2020 -2022's
secular bull market, we discussed the prospect for this (2nd-Wave corrective)
recovery to be "extensive" in terms of both price and time. A
"more extensive" correction is typified by a retracement of 61.8% or
more and spanning weeks or even months following a 3-month decline. Per
such, the (suspected corrective) recovery from 26-Sep's 2.1877 low could easily
have further to go, with commensurately larger-degree weakness than that
exhibited this week (i.e., a failure below at least 2.4822) required
to consider the correction complete. Indeed, the daily log chart above
shows the market thus far respecting former 2.6185-area resistance from 10-Oct
as a new support candidate.
These
issues considered, very shorter-term traders have been advised to move to a neutral/sideline
position following overnight's momentum failure below 2.6328, with a recovery
above 2.8172 required to negate this call, reaffirm the recovery and re-expose
potentially significant gains thereafter. For intermediate- and
longer-term players, a bullish policy and exposure remain advised with a
failure below 2.4822 required to threaten this call enough to warrant
neutralizing exposure. We will be watchful for another bearish divergence
in momentum following a recovery attempt that falls short of Fri's 2.8172 high
that would be considered the next reinforcing factor to a count calling that
2.8172 high the prospective end to the month-and-a-half 2nd-Wave
correction. In lieu of such, a resumption of the current rally to
eventual new highs above 2.8172 should not surprise.