The USDA Planting Intentions Report is our and RJO Futures has you covered. Our Grains Special report covers all the important facts outlined in the USDA report and explains how they will impact the grains market. It looks like grains may go off here soon so don’t miss out!
The Markets
Metals - Gold Being Lifted by Dollar Weakness
Gold Being Lifted by Dollar Weakness
By: Frank J. Cholly, Senior Market StrategistPosted Apr 16, 2021 8:54AM CT
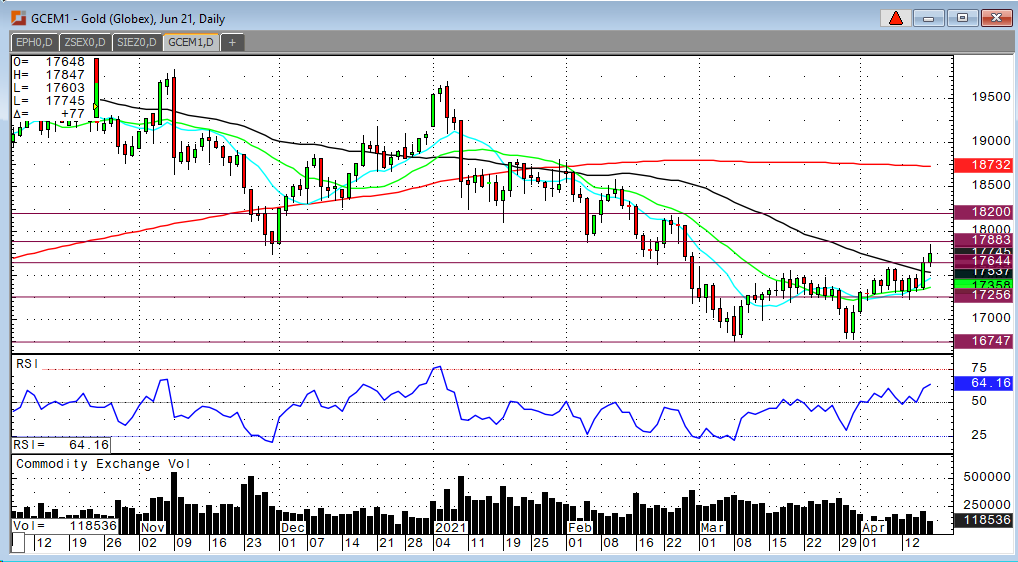
Impressive rally in gold this week takes out key resistance
levels and potentially a very positive weekly close. At the time of this
writing June gold is trading $1,783! The next key level on the way up is $1,788.
A close above $1,788 will encourage the gold bulls and likely drive this rally
towards the $1,820-$1,825 range. I’m confident that gold has bottomed and that
the rally will continue and likely spend some time consolidating in the $1,820
to $1,850 range.
The US dollar has been trending lower for weeks now and that obviously helps support gold prices, however, it wasn’t until the dollar dropped below .9200 that gold was able to breakout and close above $1,760. So, these are two key levels that you must pay attention to. Gold must hold above $1,760 and the dollar needs to stay below .9200.
Platinum has a base in the $1,150 to $1,155 range. The trend is sideways to up. A close above $1,200 in the July platinum is needed to rekindle the rally back towards $1,250. The next test of $1,250 should quickly carry the rally to $1,300.
Gold Jun '21 Daily Chart If you have any questions or would like to discuss the markets further, please feel free to contact me at 800-826-4124 or fcholly@rjofutures.com. Energy - Oil Near 4-Week High
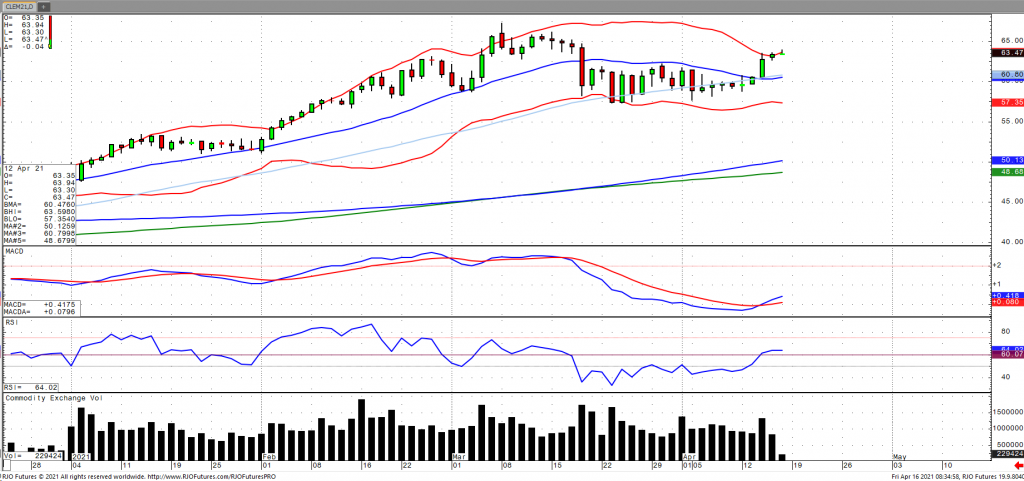
Oil prices are nearing a four-week high as the global demand outlook continues to improve with Chinese daily crude processing jumping 19.7% on the back of strong demand for fuel. Oil inventories fell to the lowest since February and refinery utilization reached the highest since the onset of the pandemic with East Coast stockpiles falling to the lowest in 30 years, according to the EIA. This comes amid an upward revision to the global demand forecast by OPEC as well as a report from the International Energy Agency (IEA) that global supply and demand is set to rebalance in the back half of the year. Oil volatility (OVX) has continued to fall, now down nearly 15% on the week, as the market remains bullish trend with today’s range seen between 58.93 – 64.26.
Crude Oil Jun '21 Daily Chart If you have any questions or would like to discuss the markets further, please feel free to contact me at 800-438-4805 or aturro@rjofutures.com. Softs - Coffee Rebounds on Tight Outlook
Coffee Rebounds on Tight Outlook
By: Adam TuiaanaPosted 04/14/2021
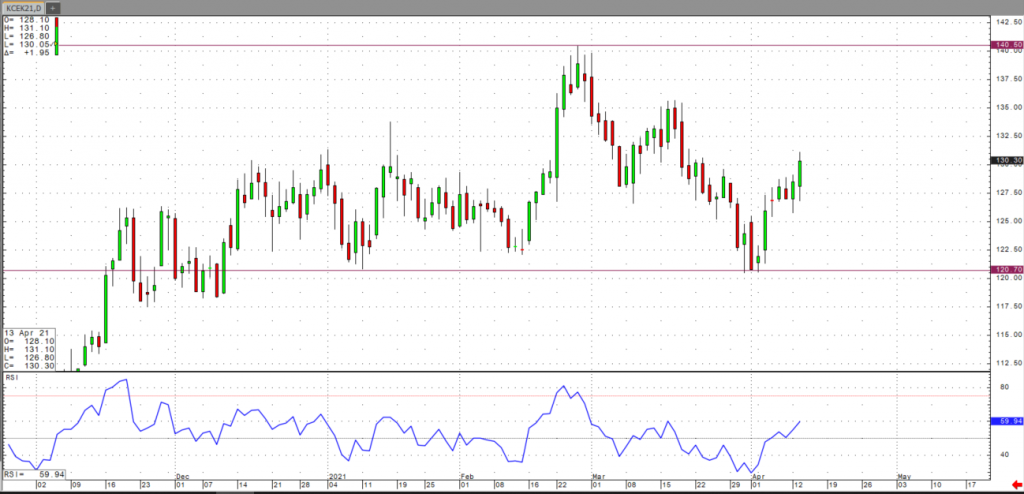
Reports continue to paint the
picture of a very bullish outlook for coffee prices, due to a major production
deficit. Our friends at the Hightower Group have stated that “the bullish
supply outlook for the 2021/22 is highlighted by a likely 30% or larger decline
in Brazil’s output, so seeing Brazil’s March coffee exports fall short of last
years total could indicate that farmers may be starting to hold back on
marketing their remaining supply”. This should pave the way for a revisit to
the 1.40 level in short time.
From a technical perspective, May coffee has is beginning a reversal up H&S pattern with a break above the pattern’s 1.30 neckline. If this pattern follows through to completion, it carries a measuring objective to 1.39. The head of this pattern has found support and clearly taken a bounce from the 200-day moving average, found at the 1.20 level.
For more frequent commentary, please check out and subscribe to my daily futures market videos on coffee and other commodities.
On
the heels of mid-Sep-to-early-Oct's steeper, accelerated, 3rd-wave-looking
recovery, the past week-and-a-half's boringly lateral chop is first considered
a corrective/consolidative event that warns of a continuation of the uptrend
that preceded it to new highs above 04-Oct's 891.0 high. This count
remains consistent with our broader base/correction/recovery count introduced
in 13-Sep's Technical Blog following that
day's bullish divergence in short-term momentum above 07-Sep's 809.5 minor
corrective high detailed in the hourly chart below.
The
important takeaway from this month's lateral, sleepy price action is the
definition of Wed's 851.5 low as
the end or lower boundary of a suspected 4th-Wave correction. A failure
below 851.5 will confirm a bearish divergence in daily momentum and defer or
threaten a bullish count enough to warrant non-bullish decisions like
long-covers. A failure below 851.5 will not
necessarily negate a broader bullish count, but it will threaten it enough to
warrant defensive measures as the next pertinent technical levels below 851.5 are
13-Sep's prospective minor 1st-Wave high at 813.8 and obviously 08-Sep's 766.0
low. And making non-bullish decisions "down there" is
sub-optimal to say the least. Per such, both short- and longer-term
commercial traders are advised to pare or neutralize bullish exposure on a
failure below 851.5, acknowledging and accepting whipsaw risk- back above 04-Oct's
891.0 high- in exchange for much deeper and sub-optimal nominal risk below
766.0.
On
a broader scale, the daily log scale chart above shows the developing potential
for a bearish divergence in daily momentum that will be considered confirmed
below 851.5. This chart also shows the past month's recovery thus far
stalling in the immediate neighborhood of the (888.0) Fibonacci
minimum 38.2% retrace of Apr-Sep's entire 1128 - 766 decline). COMBINED
with a failure below 851.5, traders
would then need to be concerned with at least a larger-degree correction pf the
past month's rally and possibly a resumption of Apr-Sep's major downtrend.
Until
and unless the market fails below 851.5 however, we would
remind longer-term players of the key elements on which our bullish count is
predicated:
a confirmed bullish divergence in WEEKLY momentum
(below)
amidst
an
historically low 11% reading in out RJO Bullish Sentiment Index and
a
textbook complete and major 5-wave Elliott sequence down from 29-Apr's
1128 high to 08-Sep's 766.0 low.
Thus
far, the market is only a month into correcting a 4-MONTH, 32% drawdown, so
further and possibly protracted gains remain well within the bounds of a major
(suspected 2nd-Wave) correction of Apr-Sep's decline within an even more
massive PEAK/reversal process from 17-May's 1219 high on an active continuation
basis below.
These
issues considered, a bullish policy and exposure remain advised with a failure
below 851.5 required to defer or threaten this call enough to warrant moving to
a neutral/sideline position. In lieu of such weakness, we anticipate a
continuation of the past month's rally to new highs and potentially significant
gains above 891.0.
Agricultural - Grain Futures Update w/Stephen Davis - 04/16/2021
Grain Futures Update w/Stephen Davis - 04/16/2021
By: Stephen DavisPosted 04/16/2021
Stephen Davis discusses the latest news moving the grain markets including some interesting weather patterns that are impactin grains in the Mid-West.Currency - Bitcoin Futures Update w/Adam Tuiaana - 04/13/2021
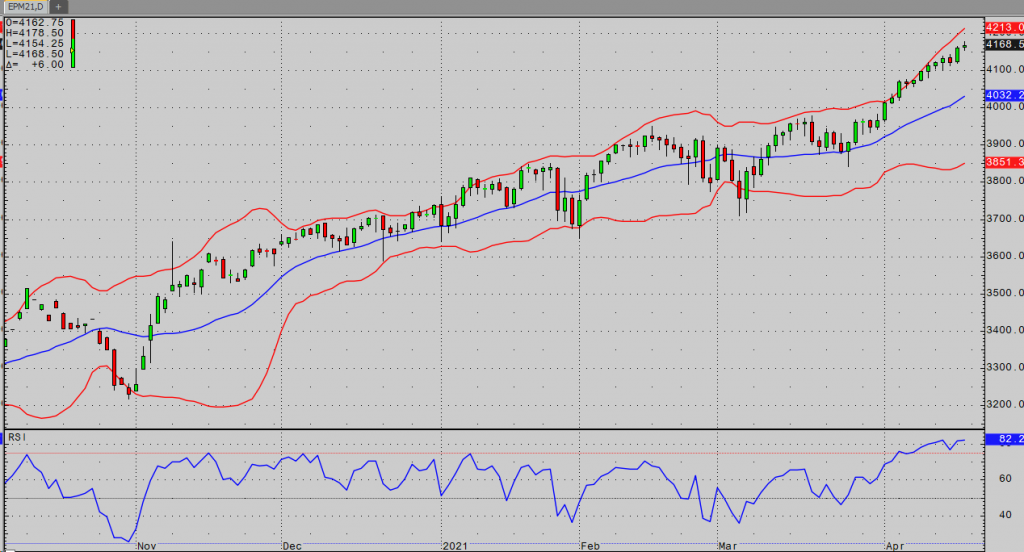
Stocks continue their charge higher. We saw new all-time highs in the Nasdaq, S&P, and Dow, while the Russell is still a bit under five percent from its 3/15 high. This recent run higher has been impressive to say the least. The S&P put in its most recent low on 3/25. Since then, the market has gained nearly 9% off that low. The rally included a twelve-session run of higher lows on the daily chart. That streak was broken on Tuesday, but we also saw a new ATH close that afternoon. For the same time period, the Dow has rallied 6.8% from its low, and the Nasdaq is up 11.5%.
Data continues to be encouraging. Retails sales and jobless claims yesterday were impressive. Consumer sentiment missed the lofty expectation of 89.0 this morning, but the 86.5 reading is still an improvement from the 84.9 reading we saw in March. Housing data remains strong and should continue to be as weather improves. The Fed has very little concern about the early warning signs of inflation and will continue to be accommodative. Stimulus money is seemingly everywhere, and Americans are getting vaccinated at high rates. While corona virus cases haven’t declined to the levels many would have hoped for just yet, they’re likely to do so. Consumers also saved 1.7 trillion dollars not traveling, going to restaurants, etc. As they continue to feel safer, you can bet they’ll be looking to put some of that to use. While there are also a great deal of reasons to be concerned about these levels we are seeing (and continue to build upon), the market seems to have little concern for them in the short-term.
E-mini S&P 500 Daily Chart If you have any questions or would like to discuss the markets further, please feel free to contact me at 800-669-5354 or bdixon@rjofutures.com. Economy - S-T Mo Failure Insufficient to End RBOB Correction, But Beware
S-T Mo Failure Insufficient to End RBOB Correction, But Beware
By: RJO Market InsightsPosted 11/08/2022
Posted on Nov 08, 2022, 07:51 by Dave Toth
In Fri's Technical Webcast we identified a
minor corrective low at 2.6328 from Thur as a mini risk parameter the market
needed to sustain gains above to maintain a more immediate bullish count.
The 240-min chart below shows the market's failure overnight below this level,
confirming a bearish divergence in very short-term momentum. This mo
failure defines Fri's 2.8172 high as
one of developing importance and a parameter from which very short-term traders
can objectively base non-bullish decisions like long-covers.
Given
the magnitude of the past three weeks' broader recovery however, this
short-term momentum failure is of an insufficient scale to conclude anything
more than another correction within this broader recovery from 26-Sep's 2.1877
low. Indeed, overnights failure below 2.6328 only allows us to conclude
the end of the portion of the month-and-a-half rally from 31-Oct's 2.4822 next
larger-degree corrective low. 2.4822 is the
risk parameter this market still needs to fail below to break the uptrend from
18-Oct's 2.3526 low while this 2.3526 low
remains intact as the risk parameter this market needs to fail below to break
the month-and-a-half uptrend. From an
intermediate-to-longer-term perspective, this week's setback falls well within
the bounds of another correction ahead of further gains. This is another
excellent example of the importance of technical and trading SCALE and
understanding and matching directional risk exposure to one's personal risk
profile.
The
reason overnight's admittedly minor mo failure might have longer-term
importance is the 2.8172-area from which it stemmed. In
Fri's Technical Blog we also noted the market's engagement of the
2.8076-to-2.8159-area marked by the 61.8% retrace of Jun0-Sewp's 3.2758 -2.1877
decline and the 1.000 progression of Sep-Oct's initial 2.1877 - 2.6185
(suspected a-Wave) rally from 18-Oct's 2.3526 (suspected b-Wave) low. We
remind longer-term players that because of the unique and compelling confluence
of:
early-Aug's bearish divergence in WEEKLY momentum
amidst
historically
extreme bullish sentiment/contrary opinion levels in our RJO Bullish
Sentiment Index
an
arguably complete and massive 5-wave Elliott sequence from Mar'20's 0.4605
low to Jun's 4.3260 high (as labeled in the weekly log active-continuation
chart below) and
the
5-wave impulsive sub-division of Jun-Sep's (suspected initial 1st-Wave) decline
The
recovery attempt from 26-Sep's 2.1877 low is arguably only a 3-wave (Wave-2)
corrective rebuttal to Jun-Sep's decline within a massive, multi-quarter
PEAK/reversal process. Now granted, due to the magnitude of 2020 -2022's
secular bull market, we discussed the prospect for this (2nd-Wave corrective)
recovery to be "extensive" in terms of both price and time. A
"more extensive" correction is typified by a retracement of 61.8% or
more and spanning weeks or even months following a 3-month decline. Per
such, the (suspected corrective) recovery from 26-Sep's 2.1877 low could easily
have further to go, with commensurately larger-degree weakness than that
exhibited this week (i.e., a failure below at least 2.4822) required
to consider the correction complete. Indeed, the daily log chart above
shows the market thus far respecting former 2.6185-area resistance from 10-Oct
as a new support candidate.
These
issues considered, very shorter-term traders have been advised to move to a neutral/sideline
position following overnight's momentum failure below 2.6328, with a recovery
above 2.8172 required to negate this call, reaffirm the recovery and re-expose
potentially significant gains thereafter. For intermediate- and
longer-term players, a bullish policy and exposure remain advised with a
failure below 2.4822 required to threaten this call enough to warrant
neutralizing exposure. We will be watchful for another bearish divergence
in momentum following a recovery attempt that falls short of Fri's 2.8172 high
that would be considered the next reinforcing factor to a count calling that
2.8172 high the prospective end to the month-and-a-half 2nd-Wave
correction. In lieu of such, a resumption of the current rally to
eventual new highs above 2.8172 should not surprise.
Economy - Macro Now w/Alexander Turro - 04/12/2021
Macro Now w/Alexander Turro - 04/12/2021
By: Alex Turro, Senior Market StrategistPosted Apr 12, 2021 12:28PM CT
Alexander Turro discusses the latest news surrounding the macro markets as we begin to gear up for summer. If you have any questions or would like to discuss the markets further, please feel free to contact me at 800-438-4805 or aturro@rjofutures.com.