Looking to diversify your investment portfolio with futures trading, but lack the expertise on your own? Trading Systems and their programs are now listed on our website complete with track records, products traded and minimum account requirements and fees. If you need help navigating the site and viewing the results, give us a call.
New: E-mini S&P 500 Investor Kit
Historically, the E-mini S&P 500 is one of the most popular and widely traded futures contracts around the world. The reason behind its popularity lies within the leverage it affords the trader, and when you couple that with its accessibility and ease to trade it makes the contract viable to virtually any trader. The S&P 500 hits new highs seemingly every day and now is the perfect time to add it to your portfolio. Complete with actionable trading strategies our E-mini S&P 500 Investor kit is here to help all traders, regardless of experience!
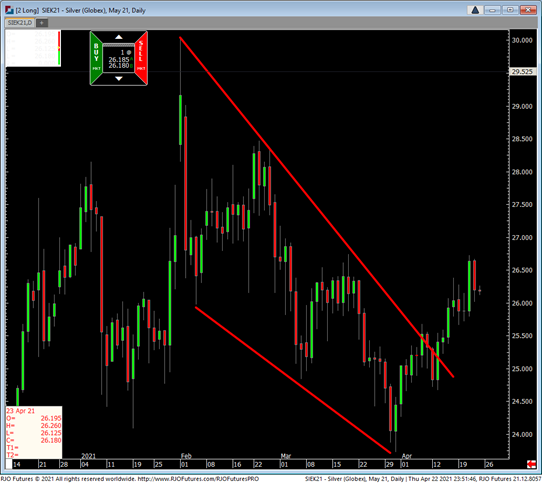
The silver market is poised to run higher. It has spent numerous days holding bases around and above $25.00. As I have written about it before, Silver would likely see $30.00 before low $20’s. in my opinion, the silver market is look for an aggressive punch to the upside. As you might know, when silver moves, it moves big in my view!!!. Of course time is everything, the longer the market hangs around these levels, the better chance it will pop. The new jobless claim this week is encouraging but inflation pressure will keep silver bears on their edge. Not sure if you have been paying attention but commodities are heating up. To think that inflation pressure is not around the corner is naïve. For now, a break below $25.60 could trigger a wash to $24.70. A break above $26.70 will trigger a run to high $28.00.
Silver May '21 Daily Chart If you have any questions or would like to discuss the markets further, please feel free to contact me at 800-367-7290 or etesfaye@rjofutures.com. Energy - Fuel Demand in Focus
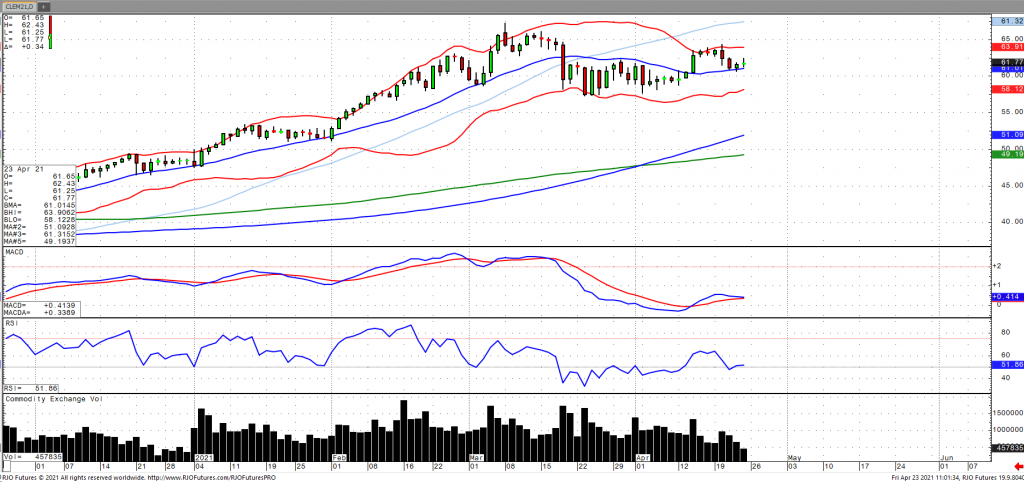
Oil prices are edging higher on Friday but are poised to end the week with losses as the continued improvement in fuel demand and subsequent economic recovery remain in focus. This comes amid easing restrictions and lockdowns in Europe but enhanced measures in India and Japan, the third and fourth world’s largest oil importers. Key Chinese port oil stockpiles came in at an 11-week low, which may have helped buoy sentiment. The market may be looking ahead to next weeks OPEC+ ‘technical meeting’ to reassess the previously agreed upon production increases. The market remains bullish trend with today’s range seen between 60.01 – 65.19.
Crude Oil Jun '21 Daily Chart If you have any questions or would like to discuss the markets further, please feel free to contact me at 800-438-4805 or aturro@rjofutures.com. Softs - Short-Term Cocoa Recovery Halted by Demand Issues
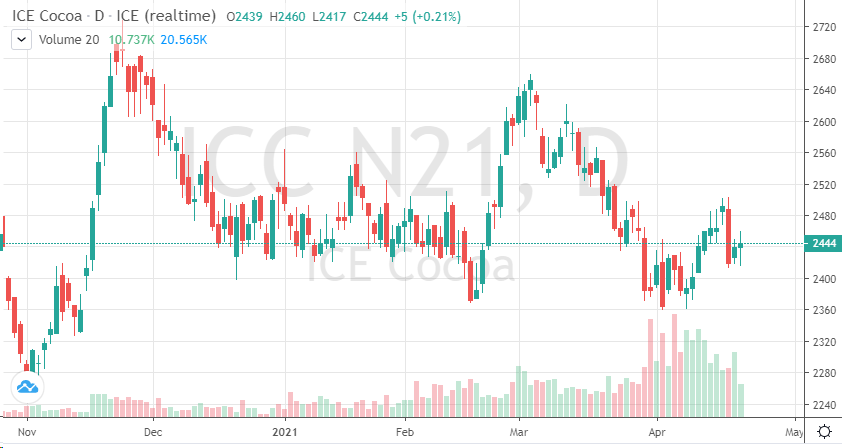
Short-Term Cocoa Recovery Halted by Demand Issues
By: Peter MoosesPosted 04/23/2021
As
traders turned their focus to the July cocoa contract, we saw prices fall
sharply earlier this week. After the steady decline we saw in prices throughout
March, April appeared to be forming somewhat of a recovery as equities moved
higher. The continued vaccine rollout paired with reopenings gave the food
markets some sense of hope for a recovery in demand.
The
problems with potential vaccine side effects have people hesitant to get
vaccinated, refusing the vaccine or waiting for more information to be released
during this live trial. Until herd immunity is reached, we won’t truly have an
idea if an end to this pandemic is in sight. For now, traders should continue
to monitor the equity markets, currencies and macro reports being released to
gage how far into the “recovery” we are.
Cocoa futures rely heavily on supply and demand news, so until demand increases or there is a real issue with production, look for trading to continue to look like this – sideways followed by short-term dramatic moves as news breaks. Traders who are anticipating a longer-term recovery and want exposure to the market should continue to look at buying calls in further out months.
On
the heels of mid-Sep-to-early-Oct's steeper, accelerated, 3rd-wave-looking
recovery, the past week-and-a-half's boringly lateral chop is first considered
a corrective/consolidative event that warns of a continuation of the uptrend
that preceded it to new highs above 04-Oct's 891.0 high. This count
remains consistent with our broader base/correction/recovery count introduced
in 13-Sep's Technical Blog following that
day's bullish divergence in short-term momentum above 07-Sep's 809.5 minor
corrective high detailed in the hourly chart below.
The
important takeaway from this month's lateral, sleepy price action is the
definition of Wed's 851.5 low as
the end or lower boundary of a suspected 4th-Wave correction. A failure
below 851.5 will confirm a bearish divergence in daily momentum and defer or
threaten a bullish count enough to warrant non-bullish decisions like
long-covers. A failure below 851.5 will not
necessarily negate a broader bullish count, but it will threaten it enough to
warrant defensive measures as the next pertinent technical levels below 851.5 are
13-Sep's prospective minor 1st-Wave high at 813.8 and obviously 08-Sep's 766.0
low. And making non-bullish decisions "down there" is
sub-optimal to say the least. Per such, both short- and longer-term
commercial traders are advised to pare or neutralize bullish exposure on a
failure below 851.5, acknowledging and accepting whipsaw risk- back above 04-Oct's
891.0 high- in exchange for much deeper and sub-optimal nominal risk below
766.0.
On
a broader scale, the daily log scale chart above shows the developing potential
for a bearish divergence in daily momentum that will be considered confirmed
below 851.5. This chart also shows the past month's recovery thus far
stalling in the immediate neighborhood of the (888.0) Fibonacci
minimum 38.2% retrace of Apr-Sep's entire 1128 - 766 decline). COMBINED
with a failure below 851.5, traders
would then need to be concerned with at least a larger-degree correction pf the
past month's rally and possibly a resumption of Apr-Sep's major downtrend.
Until
and unless the market fails below 851.5 however, we would
remind longer-term players of the key elements on which our bullish count is
predicated:
a confirmed bullish divergence in WEEKLY momentum
(below)
amidst
an
historically low 11% reading in out RJO Bullish Sentiment Index and
a
textbook complete and major 5-wave Elliott sequence down from 29-Apr's
1128 high to 08-Sep's 766.0 low.
Thus
far, the market is only a month into correcting a 4-MONTH, 32% drawdown, so
further and possibly protracted gains remain well within the bounds of a major
(suspected 2nd-Wave) correction of Apr-Sep's decline within an even more
massive PEAK/reversal process from 17-May's 1219 high on an active continuation
basis below.
These
issues considered, a bullish policy and exposure remain advised with a failure
below 851.5 required to defer or threaten this call enough to warrant moving to
a neutral/sideline position. In lieu of such weakness, we anticipate a
continuation of the past month's rally to new highs and potentially significant
gains above 891.0.
Agricultural - Grain Futures Update w/Stephen Davis - 04/23/2021
Grain Futures Update w/Stephen Davis - 04/23/2021
By: Stephen DavisPosted 04/23/2021
Stephen Davis discusses the latest news moving the grain markets including all the factors that contributed to the busy week we just had.Currency - Is That It for Bitcoin?
Is That It for Bitcoin?
By: RJO Market InsightsPosted 04/23/2021
Today's continued slide below 25-Mar's 50595 next larger-degree corrective low in the Apr contract confirms a bigger level of weakness and vulnerability and reinforces our shorter-term bearish count discussed in Mon's Technical Blog following that day's short-term momentum failure below 07-Apr's 55675 corrective low. This continued slide leaves yesterday's 55645 high in its wake as the latest smaller-degree corrective high this market is now minimally required to recoup to arrest what is at least an intermediate-term downtrend and possibly just the start of a more protracted correction or reversal lower. Per such, this 55645 level serves as our new short-term risk parameter from which traders can objectively rebase and manage non-bullish decisions like long-covers and cautious bearish punts. This short-term risk parameter is thus "trailed" down from 14-ASpr's 65520 high as a direct result of this continued weakness.
The
developing weakness is easy to see in the daily chart of the contract above,
where today's break below 25-Mart's 50360 larger-degree corrective low confirms
a bearish divergence in daily momentum that raises the odds that 14-Apr's 65520 high
might be one of a larger scale and the start of a major correction or reversal
lower. Given the magnitude of the secular bull trend however, there's one
remaining level- 26-Ferb's 44555 low in
the then-prompt mar contract that long-term bulls can still require a failure
below to, in fact, break the major bull trend and warrant a move to the
sidelines. Regardless, it is clear that the past TWO MONTHS' waning
upside momentum is coming home to roost and threatening one of the great bull
runs we've seen in many years.
This said and relative to that secular advance, even the past few days' setback still falls well within the bounds of a mere correction within the still-arguable major bull trend. But if this is the case, this market has now defined two distinct levels at 55645 and 65520 that the bull must recover above to threaten or mitigate a broader peak/reversal threat and re-expose the secular uptrend. Until and unless such strength is shown, and especially if the market weakens further below 44555, traders and investors should not now be surprised by further and potentially protracted losses ahead.
The
daily (above) and weekly (below) log scale charts of the underlying Bitcoin
Real Time Index takes the sometimes vague monthly futures contracts
"roll" out of the equation and provides the purest indication of this
market. The clear momentum failure a least threatens the bull and warns
of a more protracted correction lower, and possibly a more extensive
reversal. While the depth of either a correction or reversal is indeterminable
at this juncture, the levels this index must recoup to threaten or negate a
bearish count are not. These bear risk parameters are specific and
objective at yesterday's 55469 high from
a short-term perspective and 14-Apr's 64858 from a
long-term perspective. Until and unless these levels are recouped, at
least the intermediate-term trend is confirmed as down, and possibly the new
major trend. Indeed, even a Fibonacci minimum 23.6% retrace of Mar'20 -
Apr's 21's 3901 - 64858 rally doesn't cut across until the 33400-area.
These issues considered, shorter-term traders have already been advised to move to a neutral/sideline position following Mon's sub-55675 failure. Longer-term institutional players are likewise advised to move to the sidelines to circumvent the depths unknown of a correction or reversal lower that could be major in scope. We will be watchful for a relapse-stemming bullish divergence in short-term momentum to define a more reliable low and support from which the risk of a resumed bullish policy can only then be objectively based and managed. In lieu of such a mo failure, further and possibly protracted losses should not surprise.
Equity - U.S. Stock Futures Higher Despite Tax Concerns
Early stock futures
trading is suggesting a recovery, ending a down week in the market after
Thursday’s report that President Biden is proposing a hike in the capital-gains
tax rate to 39.6% from 20% for people making over $1 million a year. This week saw choppy results as traders dealt
with concerns on the new wave of Covid-19 infections with some optimism from
promising economic data. The jobless
claim number hit its lowest point since the pandemic, a strong sign that the
labor market in the U.S. is improving.
The number of claims for jobless benefits dropped to 547,000 last week,
making it a 39,000-lower revision from the week prior. Bitcoin also plunged on the Biden tax news of
the increase after a wave of selloffs that pushed the crypto below $50,000 for
the first time since March. News from
India and Turkey that they are working on banning the trading and ownership of
crypto also helped with the downward pressure.
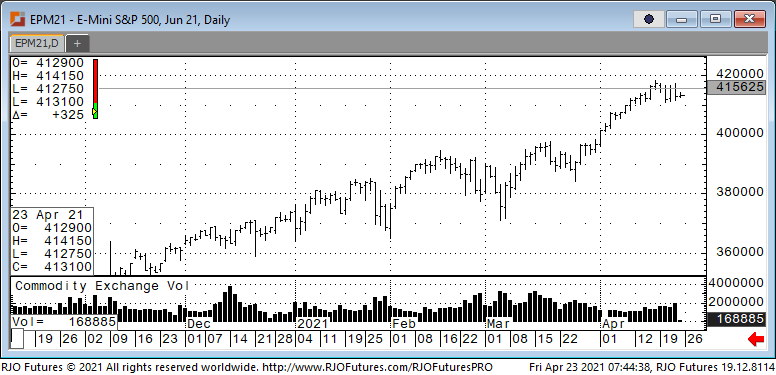
Support today is 410000 and 408000 with resistance showing 416000 and 419500.
E-mini S&P 500 Jun '21 Daily Chart If you have any questions or would like to discuss the markets further, please feel free to contact me at 888-861-1656 or jyasak@rjofutures.com. Economy - S-T Mo Failure Insufficient to End RBOB Correction, But Beware
S-T Mo Failure Insufficient to End RBOB Correction, But Beware
By: RJO Market InsightsPosted 11/08/2022
Posted on Nov 08, 2022, 07:51 by Dave Toth
In Fri's Technical Webcast we identified a
minor corrective low at 2.6328 from Thur as a mini risk parameter the market
needed to sustain gains above to maintain a more immediate bullish count.
The 240-min chart below shows the market's failure overnight below this level,
confirming a bearish divergence in very short-term momentum. This mo
failure defines Fri's 2.8172 high as
one of developing importance and a parameter from which very short-term traders
can objectively base non-bullish decisions like long-covers.
Given
the magnitude of the past three weeks' broader recovery however, this
short-term momentum failure is of an insufficient scale to conclude anything
more than another correction within this broader recovery from 26-Sep's 2.1877
low. Indeed, overnights failure below 2.6328 only allows us to conclude
the end of the portion of the month-and-a-half rally from 31-Oct's 2.4822 next
larger-degree corrective low. 2.4822 is the
risk parameter this market still needs to fail below to break the uptrend from
18-Oct's 2.3526 low while this 2.3526 low
remains intact as the risk parameter this market needs to fail below to break
the month-and-a-half uptrend. From an
intermediate-to-longer-term perspective, this week's setback falls well within
the bounds of another correction ahead of further gains. This is another
excellent example of the importance of technical and trading SCALE and
understanding and matching directional risk exposure to one's personal risk
profile.
The
reason overnight's admittedly minor mo failure might have longer-term
importance is the 2.8172-area from which it stemmed. In
Fri's Technical Blog we also noted the market's engagement of the
2.8076-to-2.8159-area marked by the 61.8% retrace of Jun0-Sewp's 3.2758 -2.1877
decline and the 1.000 progression of Sep-Oct's initial 2.1877 - 2.6185
(suspected a-Wave) rally from 18-Oct's 2.3526 (suspected b-Wave) low. We
remind longer-term players that because of the unique and compelling confluence
of:
early-Aug's bearish divergence in WEEKLY momentum
amidst
historically
extreme bullish sentiment/contrary opinion levels in our RJO Bullish
Sentiment Index
an
arguably complete and massive 5-wave Elliott sequence from Mar'20's 0.4605
low to Jun's 4.3260 high (as labeled in the weekly log active-continuation
chart below) and
the
5-wave impulsive sub-division of Jun-Sep's (suspected initial 1st-Wave) decline
The
recovery attempt from 26-Sep's 2.1877 low is arguably only a 3-wave (Wave-2)
corrective rebuttal to Jun-Sep's decline within a massive, multi-quarter
PEAK/reversal process. Now granted, due to the magnitude of 2020 -2022's
secular bull market, we discussed the prospect for this (2nd-Wave corrective)
recovery to be "extensive" in terms of both price and time. A
"more extensive" correction is typified by a retracement of 61.8% or
more and spanning weeks or even months following a 3-month decline. Per
such, the (suspected corrective) recovery from 26-Sep's 2.1877 low could easily
have further to go, with commensurately larger-degree weakness than that
exhibited this week (i.e., a failure below at least 2.4822) required
to consider the correction complete. Indeed, the daily log chart above
shows the market thus far respecting former 2.6185-area resistance from 10-Oct
as a new support candidate.
These
issues considered, very shorter-term traders have been advised to move to a neutral/sideline
position following overnight's momentum failure below 2.6328, with a recovery
above 2.8172 required to negate this call, reaffirm the recovery and re-expose
potentially significant gains thereafter. For intermediate- and
longer-term players, a bullish policy and exposure remain advised with a
failure below 2.4822 required to threaten this call enough to warrant
neutralizing exposure. We will be watchful for another bearish divergence
in momentum following a recovery attempt that falls short of Fri's 2.8172 high
that would be considered the next reinforcing factor to a count calling that
2.8172 high the prospective end to the month-and-a-half 2nd-Wave
correction. In lieu of such, a resumption of the current rally to
eventual new highs above 2.8172 should not surprise.
By: John Caruso, Senior Market StrategistPosted Apr 22, 2021 9:25AM CT
John Caruso discusses the latest news moving the futures markets this morning including a jobless claims number that has fallen to the lowest its been at since the beginning of the pandemic. If you have any questions or would like to discuss the markets further, please feel free to contact me at 800-669-5354 or jcaruso@rjofutures.com.