Metals - Will Today's Unemployment Data Help Gold Bulls?
Will Today's Unemployment Data Help Gold Bulls?
By: Nicholas DeGeorgePosted 05/08/2020
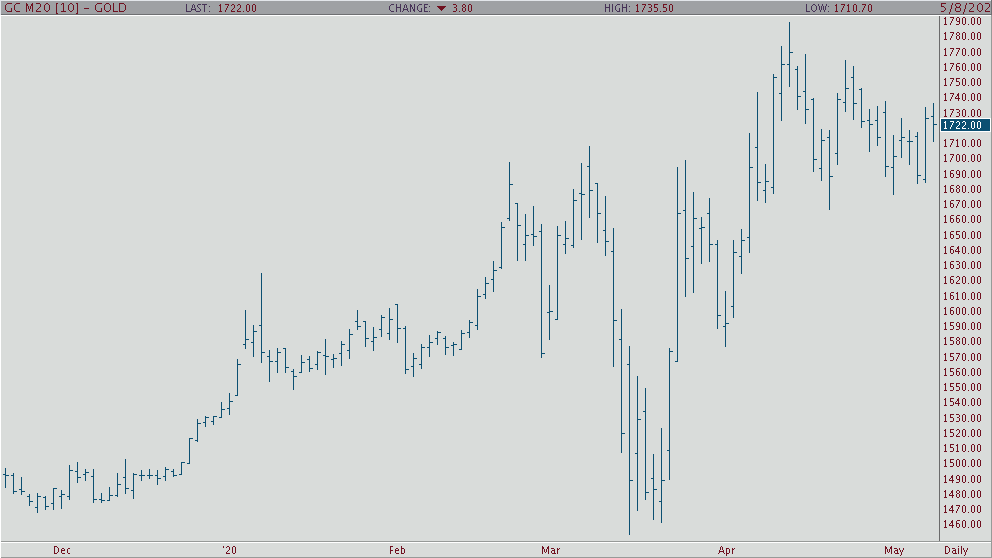
In the early morning trade, gold has given back all its
overnight gains and is currently trading in the red at $1,715 an ounce. Before
the April non-farm payroll data came out, gold was trading in the $1,730 range
and was prone to break out and even test last month’s high of $1,788.8. As I
mentioned above, today’s monthly non-farm payroll numbers came out and showed
just how paralyzed the U.S. economy is with data showing 20.5 million layoffs
in April and the overall unemployment rate is now at 14.7%, which is at its
highest level since record keeping began in 1948. To put things in perspective
for you, today’s number just erased more than a decade of job growth and are
more than double what the U.S. saw in the 2008 financial crisis.
If we look at the daily June gold chart below, you’ll clearly see how gold held the $1,700 handle this week, which is a big victory for the gold bulls. Furthermore, gold is still trading in an uptrend and with today’s unemployment data and speculation on more fed & government stimulus one could say gives the gold bulls another long-term advantage to see higher prices.
Gold Jun '20 Daily ChartMetals - Silver Battling Jobs Report
The silver markets continue consolidation as risk aversion
proves to be the main keynote. Traders in the North American session will be
battling a difficult jobs report, and while silver has a significant
manufacturing component the charts show a bit of risk on view. The bull camp
still very much so seems to be in control here and if the dollar continues its
pullback we may see silver test the upper range in its consolidation stage.
There has been continued talks on capitol hill by U.S. lawmakers to push for
even more stimulus which if done could very well help the bulls here as well.
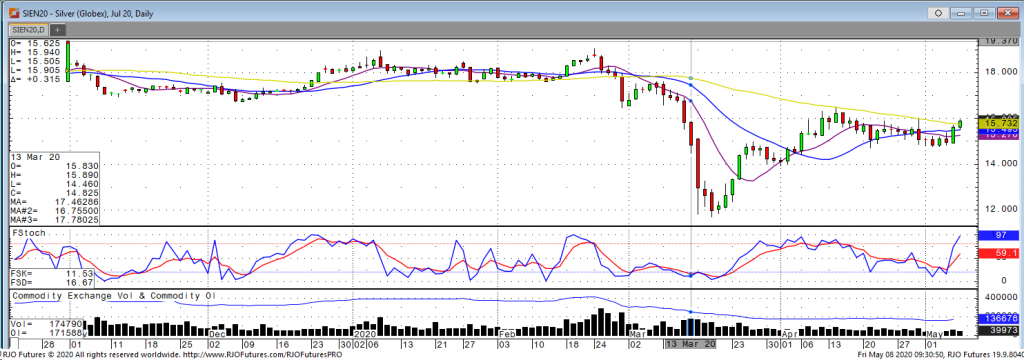
Silver holds support at the lower range of its consolidation of $14.74 where buyers have continued to step in. The daily stochastics have crossed over which should be bullish and will help in silvers test of resistance at the $15.72 and $16.00 dollar levels. We would like to see this level break for a potential continuation of the trend and would serve as caution for the bears. The next area of resistance remains at $16.33.
Silver Jul '20 Daily Chart If you have any questions or would like to discuss the markets further, please feel free to contact me at 800-826-2270 or therrmann@rjofutures.com. Energy - Expanded Volatility in Crude Oil
Expanded Volatility in Crude Oil
By: Alex Turro, Senior Market StrategistPosted May 8, 2020 9:53AM CT
Oil prices have temporarily pared yesterday’s losses following a five-session rally as the overwhelming supply glut has outweighed any recovering fuel demand. This has come amidst a restarting of OPEC+ production cuts and the reopening of economic activity in some states and countries. Saudi Arabia has led with OPEC+ cuts of 9.7 million barrels per day that had begun on May 1 with possible additional measures at the next upcoming meeting on June 10. Adding in the non-OPEC production cuts the total is likely nearing 15 million barrels per day and getting closer to the 20 million barrels per day announced at the initial OPEC/G20 meeting.
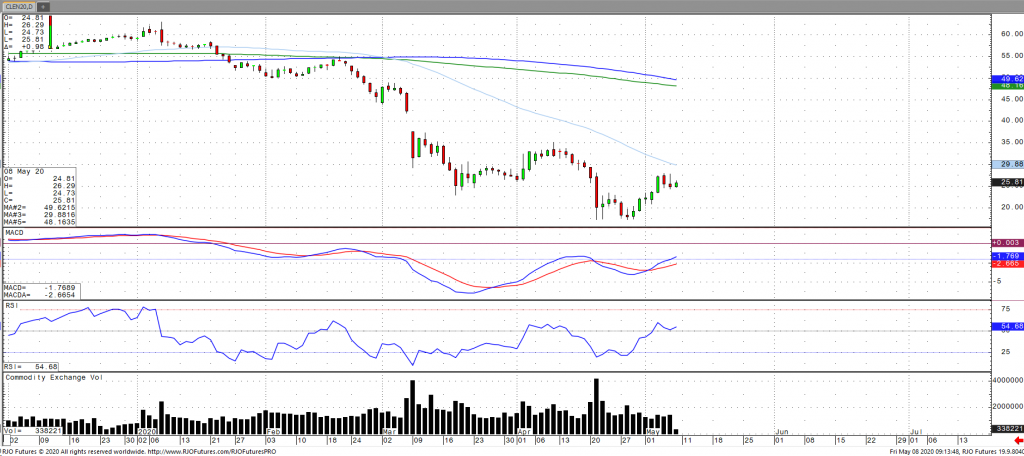
April may have been a bottom regarding demand with production cuts continuing to progress. Further OPEC action may be needed at the June meeting with the possibly of extending to the highest level of cuts at 9.7 million barrels per day for the rest of the year (instead of current plans to reduce cuts to 7.7 million barrels per day in July). Although negative territory is unlikely in the June contract, further weakness in the near term is suspected as the June contract heads closer to expiration due to limited cushing storage and inventories near full capacity as well physical delivery at the end of the month. In addition, oil volatility (OVX) remains highly elevated with the market remaining bearish trend with today’s range seen between 9.46 – 28.73.
Crude Oil 'Jul 20 Daily Chart If you have any questions or would like to discuss the markets further, please feel free to contact me at 800-438-4805 or aturro@rjofutures.com. Softs - Cocoa Demand: Can We Only Go Up From Here?
Cocoa Demand: Can We Only Go Up From Here?
By: Peter MoosesPosted 05/08/2020
As
cocoa futures continue to be range bound and ending some recent trading days
nearly unchanged, traders will focus on the demand of soft. It is hard to
anticipate where prices will be in the coming days, weeks, months or even years
as there is too much unknown globally. The demand of cocoa has been weak for a
while and there is little current news that could help a push higher in the
short-term. The hope is Q3 and 4 will show some recovery in commodities and the
equity markets.
For
now, expect consolidation, followed by volatility and a repeat of that cycle.
The equity market and currencies will be factors in the day to day trade of
cocoa. Supply and demand will continue to take a back seat as most areas of the
world have taken a step back from purchasing many commodities.
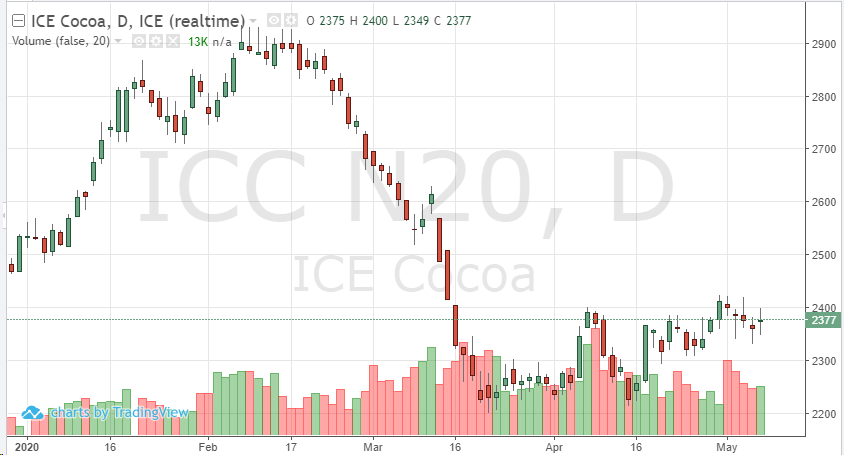
Technically, the July contract continues to hit resistance around 2415, support appears around 2310.
Cocoa Jul '20 Daily ChartSofts - Large Brazilian Crop and Weak Demand for Coffee
Large Brazilian Crop and Weak Demand for Coffee
By: Adam TuiaanaPosted 05/06/2020
While major populations prepare to come back to
work, the current weak demand and forecasted questionable demand continue to
add pressure to July coffee prices. In addition, there has been news of an
extremely large crop forecasted from the largest producer of coffee, Brazil.
Our friends at The Hightower Group have reported that “coffee has been pressured by a potentially record high Brazilian crop,
and sluggish producer currencies as it has been as it has been unable to lift
decisively clear off of its 2020 lows.”
Fresh bullish news in the way of recovering demand will be needed to support coffee prices in the long term, and we should continue to see some volatile swings the near term while we continue to wait out any potential vaccine for COVID-19.
From a technical perspective, traders may note that there is a potential head and shoulder reversal pattern to the downside (see daily chart attached). While these massive swings in coffee prices continue, with questionable demand on the horizon, many traders may benefit from staying in cash for the time being.
On
the heels of mid-Sep-to-early-Oct's steeper, accelerated, 3rd-wave-looking
recovery, the past week-and-a-half's boringly lateral chop is first considered
a corrective/consolidative event that warns of a continuation of the uptrend
that preceded it to new highs above 04-Oct's 891.0 high. This count
remains consistent with our broader base/correction/recovery count introduced
in 13-Sep's Technical Blog following that
day's bullish divergence in short-term momentum above 07-Sep's 809.5 minor
corrective high detailed in the hourly chart below.
The
important takeaway from this month's lateral, sleepy price action is the
definition of Wed's 851.5 low as
the end or lower boundary of a suspected 4th-Wave correction. A failure
below 851.5 will confirm a bearish divergence in daily momentum and defer or
threaten a bullish count enough to warrant non-bullish decisions like
long-covers. A failure below 851.5 will not
necessarily negate a broader bullish count, but it will threaten it enough to
warrant defensive measures as the next pertinent technical levels below 851.5 are
13-Sep's prospective minor 1st-Wave high at 813.8 and obviously 08-Sep's 766.0
low. And making non-bullish decisions "down there" is
sub-optimal to say the least. Per such, both short- and longer-term
commercial traders are advised to pare or neutralize bullish exposure on a
failure below 851.5, acknowledging and accepting whipsaw risk- back above 04-Oct's
891.0 high- in exchange for much deeper and sub-optimal nominal risk below
766.0.
On
a broader scale, the daily log scale chart above shows the developing potential
for a bearish divergence in daily momentum that will be considered confirmed
below 851.5. This chart also shows the past month's recovery thus far
stalling in the immediate neighborhood of the (888.0) Fibonacci
minimum 38.2% retrace of Apr-Sep's entire 1128 - 766 decline). COMBINED
with a failure below 851.5, traders
would then need to be concerned with at least a larger-degree correction pf the
past month's rally and possibly a resumption of Apr-Sep's major downtrend.
Until
and unless the market fails below 851.5 however, we would
remind longer-term players of the key elements on which our bullish count is
predicated:
a confirmed bullish divergence in WEEKLY momentum
(below)
amidst
an
historically low 11% reading in out RJO Bullish Sentiment Index and
a
textbook complete and major 5-wave Elliott sequence down from 29-Apr's
1128 high to 08-Sep's 766.0 low.
Thus
far, the market is only a month into correcting a 4-MONTH, 32% drawdown, so
further and possibly protracted gains remain well within the bounds of a major
(suspected 2nd-Wave) correction of Apr-Sep's decline within an even more
massive PEAK/reversal process from 17-May's 1219 high on an active continuation
basis below.
These
issues considered, a bullish policy and exposure remain advised with a failure
below 851.5 required to defer or threaten this call enough to warrant moving to
a neutral/sideline position. In lieu of such weakness, we anticipate a
continuation of the past month's rally to new highs and potentially significant
gains above 891.0.
Agricultural - Grain Futures Update w/Stephen Davis - 05/08/2020
Grain Futures Update w/Stephen Davis - 05/08/2020
By: Stephen DavisPosted 05/08/2020
This week we saw China buy U.S. soybeans, and Mexico buy U.S. corn which is great news for grain exports. We also have a crop report due out next week and we expect to see corn be 70% planted.
Agricultural - China Becoming Active in the Corn Market
China Becoming Active in the Corn Market
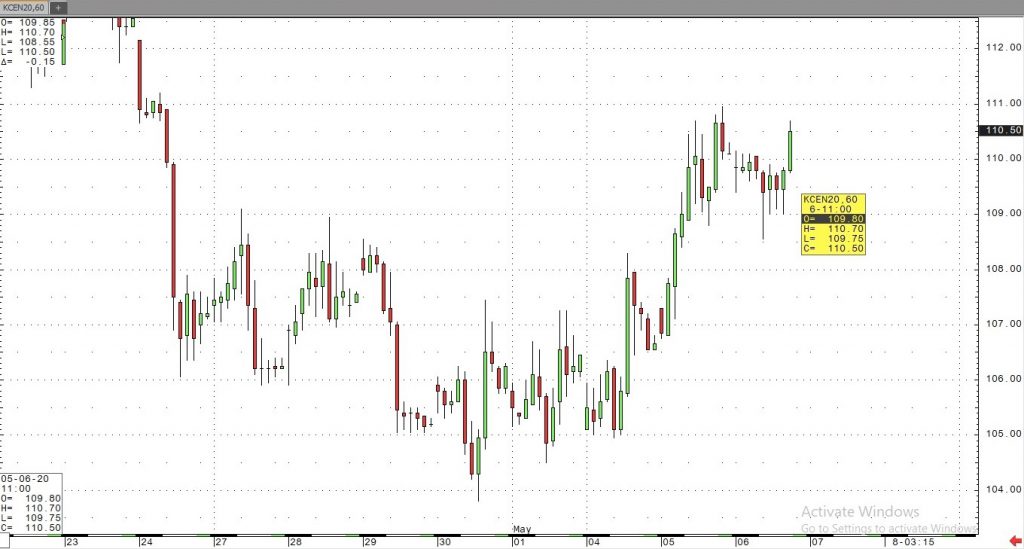
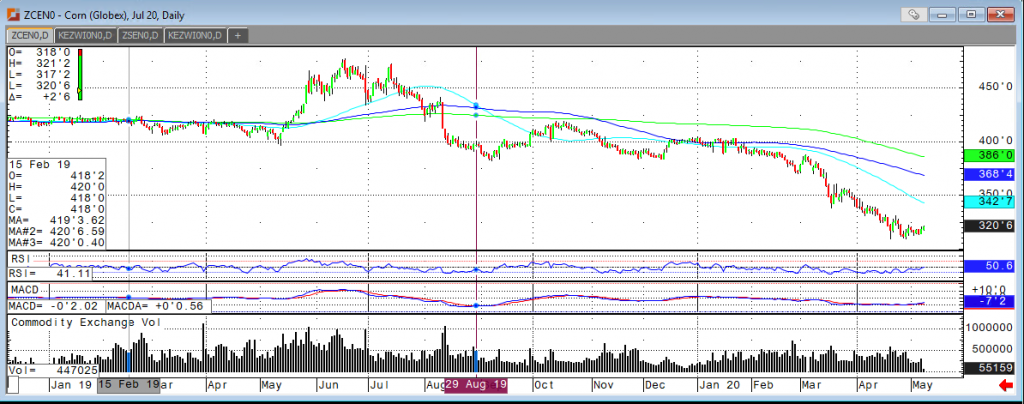
By: Tony Cholly, Senior Market StrategistPosted May 8, 2020 9:10AM CT
It will not take much in the way of positive news to see a significant short covering rally, and this demand news may be the news that is needed to spark this. The USDA reported a sale of 686,000 tonnes of corn to China. The demand news coupled with parts of the Midwest potentially getting frost this weekend are looked at as bullish. Corn that was planted early is at risk of getting damaged from this late frost. Stronger energy prices are also something that is being supportive for corn today, with thoughts that ethanol demand will also begin to see an uptick in the near future. All of this being said, if there ends up being no frost, we will still have a very large amount of acres getting planted and expecting massive yields too. This bounce may be a temporary one if we don’t get more weather issues. Resistance comes in at 321 and 324 with support at 314 and 311.
Corn Jul '20 Daily Chart If you have any questions or would like to discuss the markets further, please feel free to contact me at 800-826-2270 or tcholly@rjofutures.com. Currency - Dollar Index Fails at Critical Level
Dollar Index Fails at Critical Level
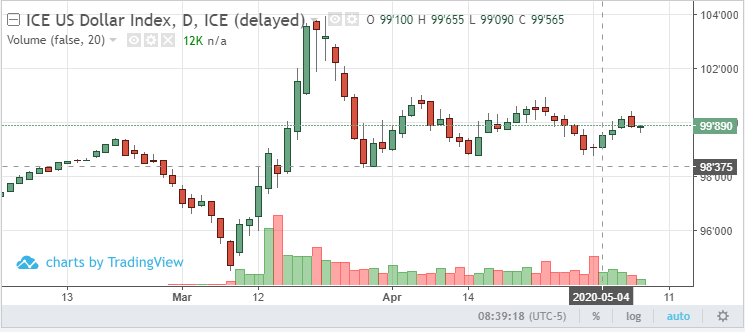
By: Ian BannonPosted 05/08/2020
U.S. dollar futures are virtually unchanged Friday morning after April non-farm payrolls decreased by 20.5 million jobs, raising the unemployment rate to nearly 15%, the worst level since the Great Depression. This number was largely priced into markets already, and the report beat expectations by about 1 million jobs. Greenback futures failed to press through the previous swing high at 100.97, which could be a sign that the dollar rally is coming to an end. Inevitably, the unprecedented levels of liquidity being injected by the Fed will debase the USD and inflation will return to the U.S. economy. As the world moves to put the coronavirus pandemic behind us, uncertainty will subside, and the safe-haven qualities of the dollar will take a back seat. Foreign currency futures will thrive in this environment, most notably the euro and emerging market currencies.
USD Jun '20 Daily ChartInterest Rates - Interest Rates Down After Negative ADP Number
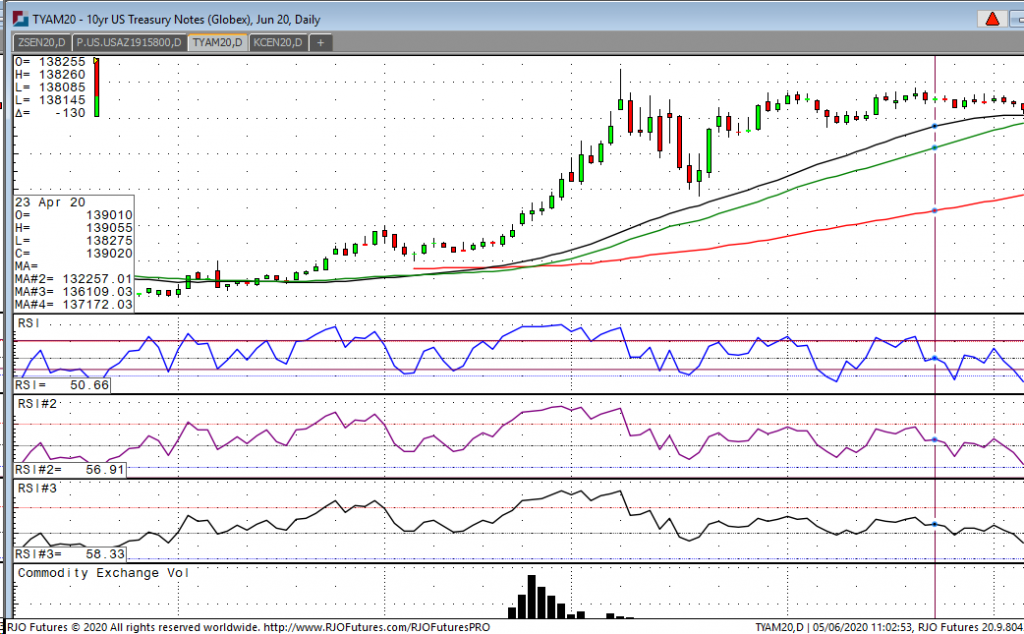
Looking at the June 10-year note this morning, we are currently trading 138-15 which is down 12.5 ticks on the day. We have a high 138-26 and a low of 138085. Economic news this morning showed that the monthly ADP number that came out negative, which the street was expecting, but nevertheless a negative print has not been seen in the markets for many years. What’s very interesting is the fact that treasuries are lower after a bad number, which in my opinion, does not bode well for the entire treasury complex. When markets don’t act the way they should, traders should be very focused on a possible turning point and the probability of lower prices lies ahead. Another important development that I have been seeing in the last week or so is many of the meat producing plants have been closed due the coronavirus. This has skyrocketed the price of meat and other products that many families consume. That will no doubt cause inflation for at the grocery stores. If that happens, you could see interest rates start to go much higher than the Fed would like them to, and with 30 million or so unemployed, that will cause a monster problem for families and the fed alike. Look for the June 10-year to go lower and potentially consider selling rallies.
10-Yr Note June '20 Daily Chart If you have any questions or would like to discuss the markets further, please feel free to contact me at 800-826-2270 or gperlin@rjofutures.com. Equity - Horrendous Jobs Number Has Stocks off Early Highs
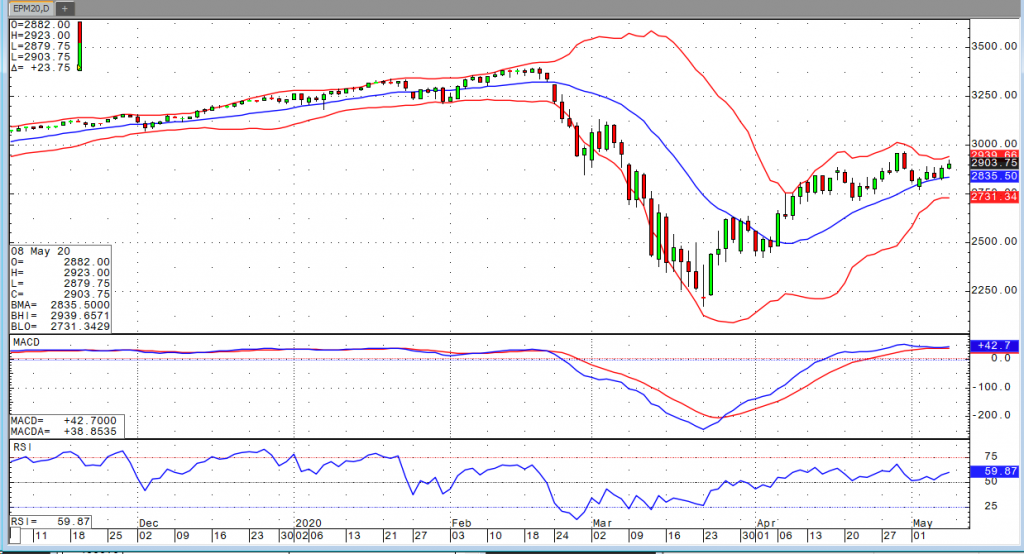
Horrendous Jobs Number Has Stocks off Early Highs
By: Bill Dixon, Senior Market StrategistPosted May 8, 2020 9:05AM CT
The non-farm payroll data this morning showed a loss of another 20.5M jobs. That is a huge number, but the market continues to discount the bad jobs data as if it is just a temporary phenomenon. The indices were trading at their highest levels since 4/30 leading up to the news (the Nasdaq actually achieved levels unseen since late February). The number did lead to some profit taking/outright selling, but I think you have to be impressed by the market’s ability to hang in there. Who would have thought the Dow would still be up 250 following a number like that? Sentiment continues to be bearish, and I think that needs to approach more neutral/bullish levels before we see any kind of major correction. Even then, I believe the lows are in. The Fed is throwing everything they can at this market. We can argue about how effective their actions will ultimately prove to be, but the market certainly seems appreciative thus far.
E-mini S&P 500 Jun '20 Daily Chart If you have any questions or would like to discuss the markets further, please feel free to contact me at 800-669-5354 or bdixon@rjofutures.com. Economy - S-T Mo Failure Insufficient to End RBOB Correction, But Beware
S-T Mo Failure Insufficient to End RBOB Correction, But Beware
By: RJO Market InsightsPosted 11/08/2022
Posted on Nov 08, 2022, 07:51 by Dave Toth
In Fri's Technical Webcast we identified a
minor corrective low at 2.6328 from Thur as a mini risk parameter the market
needed to sustain gains above to maintain a more immediate bullish count.
The 240-min chart below shows the market's failure overnight below this level,
confirming a bearish divergence in very short-term momentum. This mo
failure defines Fri's 2.8172 high as
one of developing importance and a parameter from which very short-term traders
can objectively base non-bullish decisions like long-covers.
Given
the magnitude of the past three weeks' broader recovery however, this
short-term momentum failure is of an insufficient scale to conclude anything
more than another correction within this broader recovery from 26-Sep's 2.1877
low. Indeed, overnights failure below 2.6328 only allows us to conclude
the end of the portion of the month-and-a-half rally from 31-Oct's 2.4822 next
larger-degree corrective low. 2.4822 is the
risk parameter this market still needs to fail below to break the uptrend from
18-Oct's 2.3526 low while this 2.3526 low
remains intact as the risk parameter this market needs to fail below to break
the month-and-a-half uptrend. From an
intermediate-to-longer-term perspective, this week's setback falls well within
the bounds of another correction ahead of further gains. This is another
excellent example of the importance of technical and trading SCALE and
understanding and matching directional risk exposure to one's personal risk
profile.
The
reason overnight's admittedly minor mo failure might have longer-term
importance is the 2.8172-area from which it stemmed. In
Fri's Technical Blog we also noted the market's engagement of the
2.8076-to-2.8159-area marked by the 61.8% retrace of Jun0-Sewp's 3.2758 -2.1877
decline and the 1.000 progression of Sep-Oct's initial 2.1877 - 2.6185
(suspected a-Wave) rally from 18-Oct's 2.3526 (suspected b-Wave) low. We
remind longer-term players that because of the unique and compelling confluence
of:
early-Aug's bearish divergence in WEEKLY momentum
amidst
historically
extreme bullish sentiment/contrary opinion levels in our RJO Bullish
Sentiment Index
an
arguably complete and massive 5-wave Elliott sequence from Mar'20's 0.4605
low to Jun's 4.3260 high (as labeled in the weekly log active-continuation
chart below) and
the
5-wave impulsive sub-division of Jun-Sep's (suspected initial 1st-Wave) decline
The
recovery attempt from 26-Sep's 2.1877 low is arguably only a 3-wave (Wave-2)
corrective rebuttal to Jun-Sep's decline within a massive, multi-quarter
PEAK/reversal process. Now granted, due to the magnitude of 2020 -2022's
secular bull market, we discussed the prospect for this (2nd-Wave corrective)
recovery to be "extensive" in terms of both price and time. A
"more extensive" correction is typified by a retracement of 61.8% or
more and spanning weeks or even months following a 3-month decline. Per
such, the (suspected corrective) recovery from 26-Sep's 2.1877 low could easily
have further to go, with commensurately larger-degree weakness than that
exhibited this week (i.e., a failure below at least 2.4822) required
to consider the correction complete. Indeed, the daily log chart above
shows the market thus far respecting former 2.6185-area resistance from 10-Oct
as a new support candidate.
These
issues considered, very shorter-term traders have been advised to move to a neutral/sideline
position following overnight's momentum failure below 2.6328, with a recovery
above 2.8172 required to negate this call, reaffirm the recovery and re-expose
potentially significant gains thereafter. For intermediate- and
longer-term players, a bullish policy and exposure remain advised with a
failure below 2.4822 required to threaten this call enough to warrant
neutralizing exposure. We will be watchful for another bearish divergence
in momentum following a recovery attempt that falls short of Fri's 2.8172 high
that would be considered the next reinforcing factor to a count calling that
2.8172 high the prospective end to the month-and-a-half 2nd-Wave
correction. In lieu of such, a resumption of the current rally to
eventual new highs above 2.8172 should not surprise.