Discover how options are priced and learn to read option quotes
How to trade rising and falling markets using options
The Markets
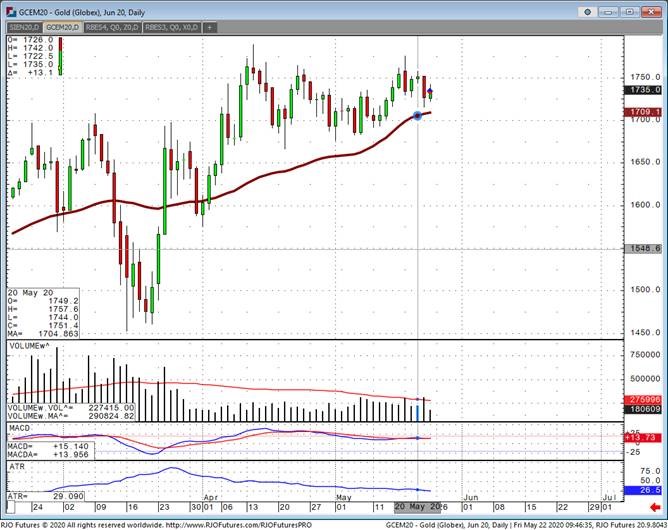
Metals - Gold Continues to Struggle
Gold Continues to Struggle
By: Joshua GravesPosted 05/22/2020
June gold futures have once again, showed strength over the past week pushing just short of the contract high of 1789 back in March, only to fall back toward 1735 as of this morning. It’s difficult to say whether we will be able to make new highs given the stock market strength, and the endless sideways price action over the past few months. One could just look at the chart of June gold and conclude on a daily chart gold is a buy around 1675, and a sell around 1750 and it’s been that simple. Gold ETF’s continue to expand their physical for the 20th straight week, unrest in Hong Kong with China’s recent crackdown, and explosive federal government spending are all reasons to be long gold.
The technicals though, again, seem to have the edge here as we saw strong above average volume yesterday and a solid close lower. Today we have minor strength but likely an inside day in the end. The April 22nd and May 1st spike lows in gold are a clue to where the near-term bottom is, which is around 1675. The same could be seen around 1750. Volume is a big clue when coupled with price action to see what’s really going on in gold (or any market for that). Traders right now need to position themselves for a neutral to moderately bullish outlook, and custom strategies based on your market bias and risk tolerance can be created by contacting me directly.
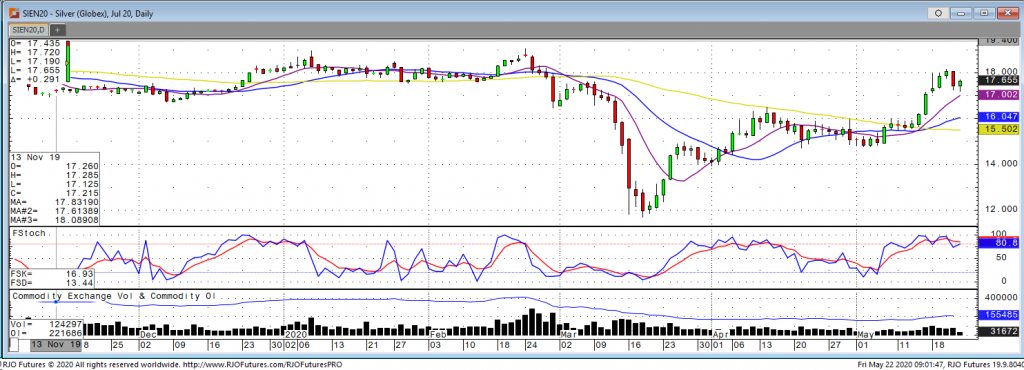
Gold Jun '20 Daily ChartMetals - Silver Hitting Highs
Silver futures hit the highest price since mid-February this
week touting an impressive rally from April lows, powered in part by investors
moving towards safe haven assets and fiscal spending. Silver typically lags as
a precious metal behind gold and for this reason tends to be more volatile, its
use in an industrial setting makes it primed to be sensitive to the global
economy. We have seen traders continue to be bullish on silver as extremely low
interest rates and countries re-opening their economy as made the metal
more attractive. Silver making another high while broader market uncertainties
still exist and continues to trade at a discount to other metals should be
supportive to prices. Traders will be watching in the coming months for signs
of inflation and monetary overspending.
July silver has resistance at $17.95, if we seem some early pressure into the session we will need to see Silver hold $17.45, otherwise we may see a move lower. Profit targets for July Silver remain at $18.20 on the upside and $17.15 to the downside. Momentum indicators point to a short term pullback which will need to be watch when trading towards these areas of support and resistance on the July contract.
Silver Jul '20 Daily Chart If you have any questions or would like to discuss the markets further, please feel free to contact me at 800-826-2270 or therrmann@rjofutures.com. Energy - Oil Jumps on Output Cuts and Demand Outlook
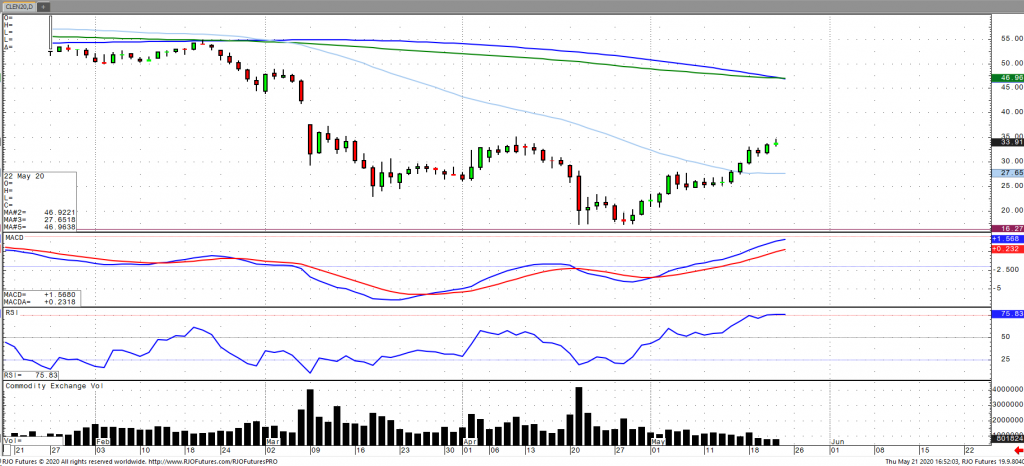
Oil Jumps on Output Cuts and Demand Outlook
By: Alex Turro, Senior Market StrategistPosted May 22, 2020 7:44AM CT
Oil for July delivery has continued to forge higher highs amidst reports of favorable Chinese demand prospects as the Chinese National Petroleum Company forecasted a 2% year over year increase in imports as well as an increase in consumption of 1% to 2%. This has been coupled with reports that Asian-Pacific refinery run rates are increasing due to an uptick in product demand. In addition, EIA crude stocks fell 4.982 million barrels with reports of a decline of US crude oil stocks of nearly 16 million barrels since May. OPEC and allies have agreed to cut by a record of 9.7 million barrels per day from May 1 with reports that oil exports have been cut by about 6 million barrels thus far. Notwithstanding, oil volatility (OVX) remains highly elevated with the market remaining bearish trend and signaling immediate term overbought with today’s range coming in between 22.61 – 36.77.
Crude Oil Jul '20 Daily Chart If you have any questions or would like to discuss the markets further, please feel free to contact me at 800-438-4805 or aturro@rjofutures.com. Softs - Cocoa Futures Finding Support as Economies Re-open
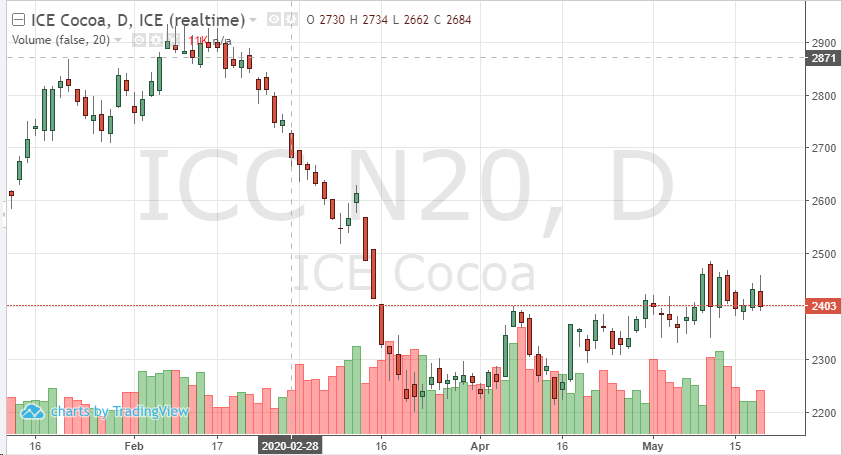
Cocoa Futures Finding Support as Economies Re-open
By: Peter MoosesPosted 05/21/2020
Looking
at the July cocoa chart, traders could see the contract has found support. The
move higher has been a grind, but prices above 2400 may be here to stay in the
short-term. Technically, the chart is showing resistance has been broken and a
new consolidation range has been found. A close above 2440 is needed to have
the momentum continue.
Fundamentally,
production levels have been lowered due to crop issues. Rainfall has been
scarce after output was already affected by dryer than normal conditions
earlier this year. Traders have been waiting for a pullback in supply to help
boost prices. The bulls have also anticipated the demand in cocoa to gain
ground and it appears to be moving that direction. As parts of the world
re-opens and the global equity markets try to recover losses from the past few
months, the “food” commodities are following the trend. Cocoa demand should
grow as more locations find the new “norm.”
Traders should have patience and look at key technical levels and supply and demand indicators to decide which path to take on trades.
Cocoa Jul '20 Daily ChartSofts - Coffee Prices and Re-opening the Economy
Coffee Prices and Re-opening the Economy
By: Adam TuiaanaPosted 05/20/2020
The coffee market continues to trade in a volatile swing range, with prices battling between the July futures range of 105 to 112. While the markets continue to gauge the delicate process of all U.S. states now slowly re-opening, the verdict is still out on what demand for coffee will be. We know that the at home consumption has not been able to take up the slack left by the absence of the restaurant business, and it seems logical that it will be some time until people congregate in such a way that the level of demand returns to where it was. Businesses still must adhere to social distancing policies, which result in less customers walking through the door, waiting in lines, etc.
On the supply side, we still have a potentially huge Brazilian crop on the horizon that has likely kept the bulls at bay. Our friends at The Hightower Group have reported that “a very large Brazilian crop have kept prices from sustaining upside momentum”. Although these factors have been able to add pressure to coffee prices, the recent rally of U.S. stocks will assist in lending these prices some level of support, at least for now. Fresh bullish news in the way of recovering demand will be needed to support coffee prices in the long term, and we should continue to see some volatile swings the near term while we continue to wait out any potential vaccine for COVID-19.
On
the heels of mid-Sep-to-early-Oct's steeper, accelerated, 3rd-wave-looking
recovery, the past week-and-a-half's boringly lateral chop is first considered
a corrective/consolidative event that warns of a continuation of the uptrend
that preceded it to new highs above 04-Oct's 891.0 high. This count
remains consistent with our broader base/correction/recovery count introduced
in 13-Sep's Technical Blog following that
day's bullish divergence in short-term momentum above 07-Sep's 809.5 minor
corrective high detailed in the hourly chart below.
The
important takeaway from this month's lateral, sleepy price action is the
definition of Wed's 851.5 low as
the end or lower boundary of a suspected 4th-Wave correction. A failure
below 851.5 will confirm a bearish divergence in daily momentum and defer or
threaten a bullish count enough to warrant non-bullish decisions like
long-covers. A failure below 851.5 will not
necessarily negate a broader bullish count, but it will threaten it enough to
warrant defensive measures as the next pertinent technical levels below 851.5 are
13-Sep's prospective minor 1st-Wave high at 813.8 and obviously 08-Sep's 766.0
low. And making non-bullish decisions "down there" is
sub-optimal to say the least. Per such, both short- and longer-term
commercial traders are advised to pare or neutralize bullish exposure on a
failure below 851.5, acknowledging and accepting whipsaw risk- back above 04-Oct's
891.0 high- in exchange for much deeper and sub-optimal nominal risk below
766.0.
On
a broader scale, the daily log scale chart above shows the developing potential
for a bearish divergence in daily momentum that will be considered confirmed
below 851.5. This chart also shows the past month's recovery thus far
stalling in the immediate neighborhood of the (888.0) Fibonacci
minimum 38.2% retrace of Apr-Sep's entire 1128 - 766 decline). COMBINED
with a failure below 851.5, traders
would then need to be concerned with at least a larger-degree correction pf the
past month's rally and possibly a resumption of Apr-Sep's major downtrend.
Until
and unless the market fails below 851.5 however, we would
remind longer-term players of the key elements on which our bullish count is
predicated:
a confirmed bullish divergence in WEEKLY momentum
(below)
amidst
an
historically low 11% reading in out RJO Bullish Sentiment Index and
a
textbook complete and major 5-wave Elliott sequence down from 29-Apr's
1128 high to 08-Sep's 766.0 low.
Thus
far, the market is only a month into correcting a 4-MONTH, 32% drawdown, so
further and possibly protracted gains remain well within the bounds of a major
(suspected 2nd-Wave) correction of Apr-Sep's decline within an even more
massive PEAK/reversal process from 17-May's 1219 high on an active continuation
basis below.
These
issues considered, a bullish policy and exposure remain advised with a failure
below 851.5 required to defer or threaten this call enough to warrant moving to
a neutral/sideline position. In lieu of such weakness, we anticipate a
continuation of the past month's rally to new highs and potentially significant
gains above 891.0.
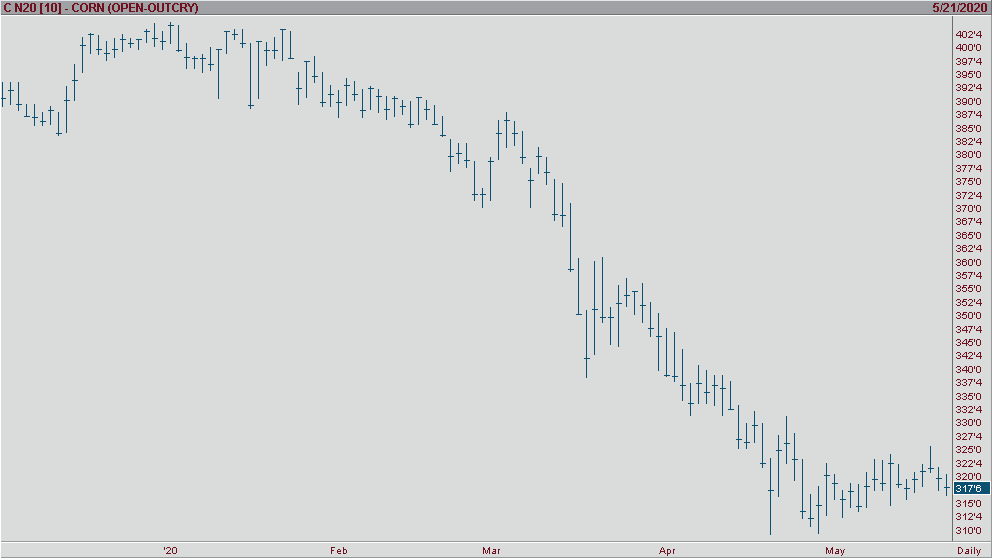
Agricultural - Corn in Consolidation
Corn in Consolidation
By: Aleksandar CuricPosted 05/22/2020
Corn futures continue in a consolidation trading sideways waiting for a catalyst to push the contracts to a new low or high. The re-opening of the global economy should be positive for the corn market in the months to come, since fuel demand should see an increase. Although a shortage of corn is not expected in the new season, corn contracts sitting at a five-year low and traders expecting seasonality patterns to push and support higher prices should be evident. According to the latest EIA data ethanol stocks in the U.S. have begun to decline. This is a consequence of the weakening of isolation measures that we originally put on in cities across the globe. Traders see that corn is generally positive technically with good support in the area its consolidating at and may see an upward correction in the near term.
July corn has price support at 315 ¾ and a break of this should see a move to 314, momentum studies should be watched as this will help traders identify oversold levels at this support. A break of resistance at 319 ¾ should accelerate a move to test 322. Traders will watch for short covering to move past these levels of resistance and an end to the consolidation that we have seen.
Stephen Davis discusses the latest news in the grain markets. This week we saw China buy U.S. soy and cotton, as economies open up we are slowly starting to see some normalcy.
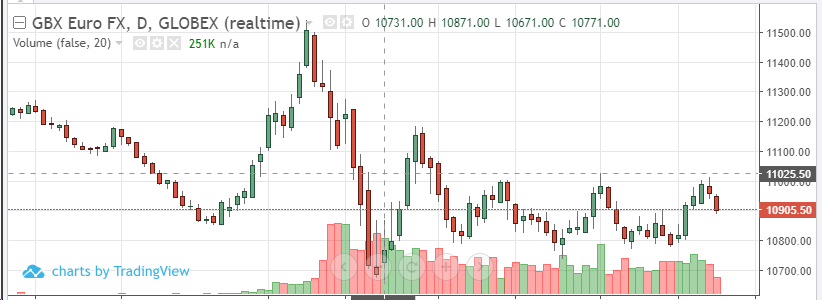
Currency - Dollar Rangebound as Investors Sentiment Waivers
Dollar Rangebound as Investors Sentiment Waivers
By: Ian BannonPosted 05/22/2020
U.S. dollar futures are roughly 40 points higher Friday morning as foreign fiat futures trade in the red. The greenback has moved sideways for two months, fluctuating between 98 and 101 as optimism levels waver. For the bulls to regain control, look for a close above 101. This will likely occur if weakness takes control of the equity markets again next month. The other side of the dollar trade is the euro. Earlier this week, the euro ran into resistance at the 38.2% Fib retracement level for the third time in two months. Once again, the currency sold off from the 1.10 level. The fundamental story supports non-dollar currencies over the intermediate/long-term. Technical cycles point to strength in the euro over the summer months. Look for a close above 1.1028 followed by a run to 50% retracement at 1.1110. Any positive vaccine news is likely dollar bearish. Watch for strength in equities to support foreign currencies as well.
Euro Jun '20 Daily ChartEquity - Stocks Recover from Overnight Weakness
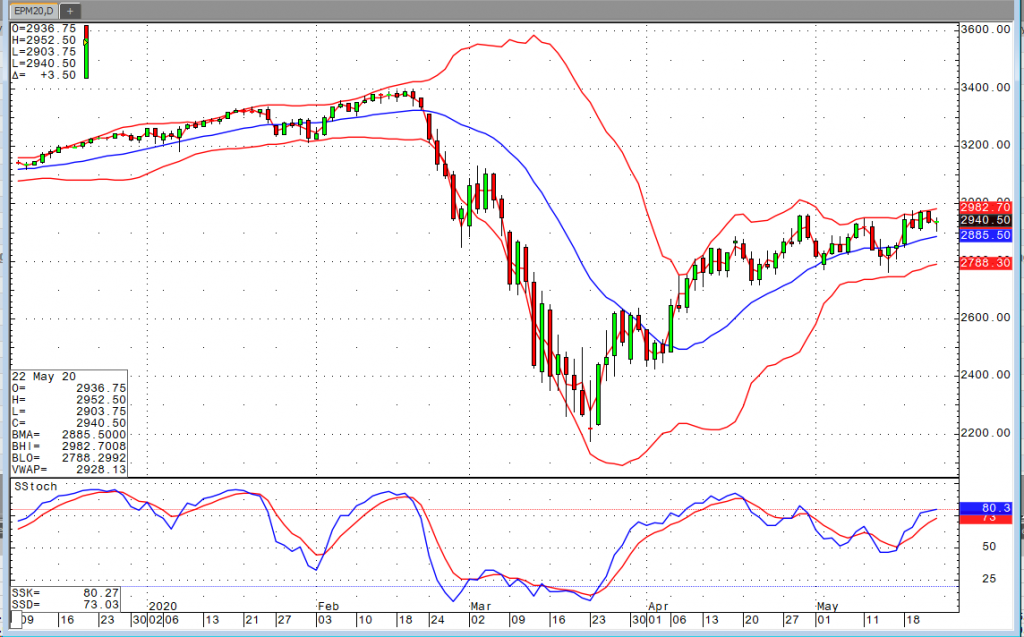
Stocks Recover from Overnight Weakness
By: Bill Dixon, Senior Market StrategistPosted May 22, 2020 9:39AM CT
Weakness in Asian markets drove the indices down considerably last night. Concerns over tensions between China and the United States and China and Hong Kong were the main reasons behind the selloffs. While the Hang Seng losses reached over 5.5%, the domestic equity markets have bounced back nicely. The S&P, Nasdaq, and Russell are all considerably off their lows and briefly found themselves back in positive territory. The Dow remained slightly negative but more than 200 off its overnight low. The recovery is pretty impressive as the weakness easily could have spurred significant profit taking ahead of the long weekend. The market continues to discount much of the horrid economic data, and with reopenings on the rise, those figures should improve. The re-opening process could also lead to a spike in deaths and infections as a result of increased COVID exposure, but there seems to be some reasons for optimism out of states that are already a bit further along in the process.
Technically speaking, the mini S&P continues to struggle with the 200 DMA. Yesterday’s action marks yet another rejection at the 2960 level. The upside momentum is tapering off a bit, and we seem to have established a bit of a sideways to higher channel over the past several weeks. If we’re able to test the lower end around 2800-, I would probably consider looking at ways to speculate further upside.
E-mini S&P 500 Jun '20 Daily Chart If you have any questions or would like to discuss the markets further, please feel free to contact me at 800-669-5354 or bdixon@rjofutures.com. Equity - Interest Rates Taking Cues From Stocks
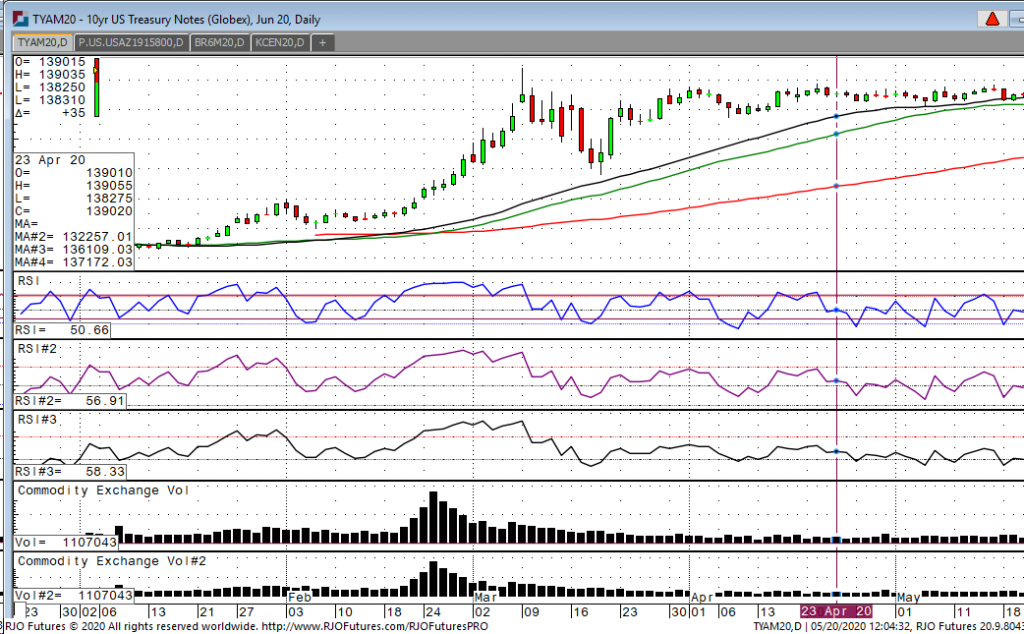
Looking at the June 10-year note, we have a range today of 139.05-138.25 and currently sit at 13829. Economic news today is light as treasuries are taking their cue from stocks which are currently very strong today, but off their highs. Later this afternoon we have the FOMC minutes, which are minutes of the last policy statement. Traders should be on guard for any verbiage or mention of negative rates as that will sure be a market mover.
Looking at technicals in the June 10-year note, the market is behaving rather nicely as the short-term trend points to higher levels, but traders should key off the 40-day moving average which currently sits at 138.245 which coincidently is right near the low of today. If we can stay above that number on a closing basis, look for the market to grind a bit higher. If that level gives way, we could see a push down to 138-16. I want traders and investors alike to be cognizant of all the money the Fed has been printing since the pandemic has started. The amount has been off the charts and the effect will cause a spike in inflation. This is the last thing the fed wants as 30+ million Americans are out of work, but the Fed would rather see consumers start to spend and get the economy up and running then worry about inflation. But don’t look now, we could see a real spike in the near term so be on guard.
10-yr Note Jul '20 Daily Chart If you have any questions or would like to discuss the markets further, please feel free to contact me at 800-826-2270 or gperlin@rjofutures.com. Economy - S-T Mo Failure Insufficient to End RBOB Correction, But Beware
S-T Mo Failure Insufficient to End RBOB Correction, But Beware
By: RJO Market InsightsPosted 11/08/2022
Posted on Nov 08, 2022, 07:51 by Dave Toth
In Fri's Technical Webcast we identified a
minor corrective low at 2.6328 from Thur as a mini risk parameter the market
needed to sustain gains above to maintain a more immediate bullish count.
The 240-min chart below shows the market's failure overnight below this level,
confirming a bearish divergence in very short-term momentum. This mo
failure defines Fri's 2.8172 high as
one of developing importance and a parameter from which very short-term traders
can objectively base non-bullish decisions like long-covers.
Given
the magnitude of the past three weeks' broader recovery however, this
short-term momentum failure is of an insufficient scale to conclude anything
more than another correction within this broader recovery from 26-Sep's 2.1877
low. Indeed, overnights failure below 2.6328 only allows us to conclude
the end of the portion of the month-and-a-half rally from 31-Oct's 2.4822 next
larger-degree corrective low. 2.4822 is the
risk parameter this market still needs to fail below to break the uptrend from
18-Oct's 2.3526 low while this 2.3526 low
remains intact as the risk parameter this market needs to fail below to break
the month-and-a-half uptrend. From an
intermediate-to-longer-term perspective, this week's setback falls well within
the bounds of another correction ahead of further gains. This is another
excellent example of the importance of technical and trading SCALE and
understanding and matching directional risk exposure to one's personal risk
profile.
The
reason overnight's admittedly minor mo failure might have longer-term
importance is the 2.8172-area from which it stemmed. In
Fri's Technical Blog we also noted the market's engagement of the
2.8076-to-2.8159-area marked by the 61.8% retrace of Jun0-Sewp's 3.2758 -2.1877
decline and the 1.000 progression of Sep-Oct's initial 2.1877 - 2.6185
(suspected a-Wave) rally from 18-Oct's 2.3526 (suspected b-Wave) low. We
remind longer-term players that because of the unique and compelling confluence
of:
early-Aug's bearish divergence in WEEKLY momentum
amidst
historically
extreme bullish sentiment/contrary opinion levels in our RJO Bullish
Sentiment Index
an
arguably complete and massive 5-wave Elliott sequence from Mar'20's 0.4605
low to Jun's 4.3260 high (as labeled in the weekly log active-continuation
chart below) and
the
5-wave impulsive sub-division of Jun-Sep's (suspected initial 1st-Wave) decline
The
recovery attempt from 26-Sep's 2.1877 low is arguably only a 3-wave (Wave-2)
corrective rebuttal to Jun-Sep's decline within a massive, multi-quarter
PEAK/reversal process. Now granted, due to the magnitude of 2020 -2022's
secular bull market, we discussed the prospect for this (2nd-Wave corrective)
recovery to be "extensive" in terms of both price and time. A
"more extensive" correction is typified by a retracement of 61.8% or
more and spanning weeks or even months following a 3-month decline. Per
such, the (suspected corrective) recovery from 26-Sep's 2.1877 low could easily
have further to go, with commensurately larger-degree weakness than that
exhibited this week (i.e., a failure below at least 2.4822) required
to consider the correction complete. Indeed, the daily log chart above
shows the market thus far respecting former 2.6185-area resistance from 10-Oct
as a new support candidate.
These
issues considered, very shorter-term traders have been advised to move to a neutral/sideline
position following overnight's momentum failure below 2.6328, with a recovery
above 2.8172 required to negate this call, reaffirm the recovery and re-expose
potentially significant gains thereafter. For intermediate- and
longer-term players, a bullish policy and exposure remain advised with a
failure below 2.4822 required to threaten this call enough to warrant
neutralizing exposure. We will be watchful for another bearish divergence
in momentum following a recovery attempt that falls short of Fri's 2.8172 high
that would be considered the next reinforcing factor to a count calling that
2.8172 high the prospective end to the month-and-a-half 2nd-Wave
correction. In lieu of such, a resumption of the current rally to
eventual new highs above 2.8172 should not surprise.