The difference between historical & implied volatility
How to spot regimes of high and low volatility
Which option strategies to apply and when
How to read price action to support your option trades
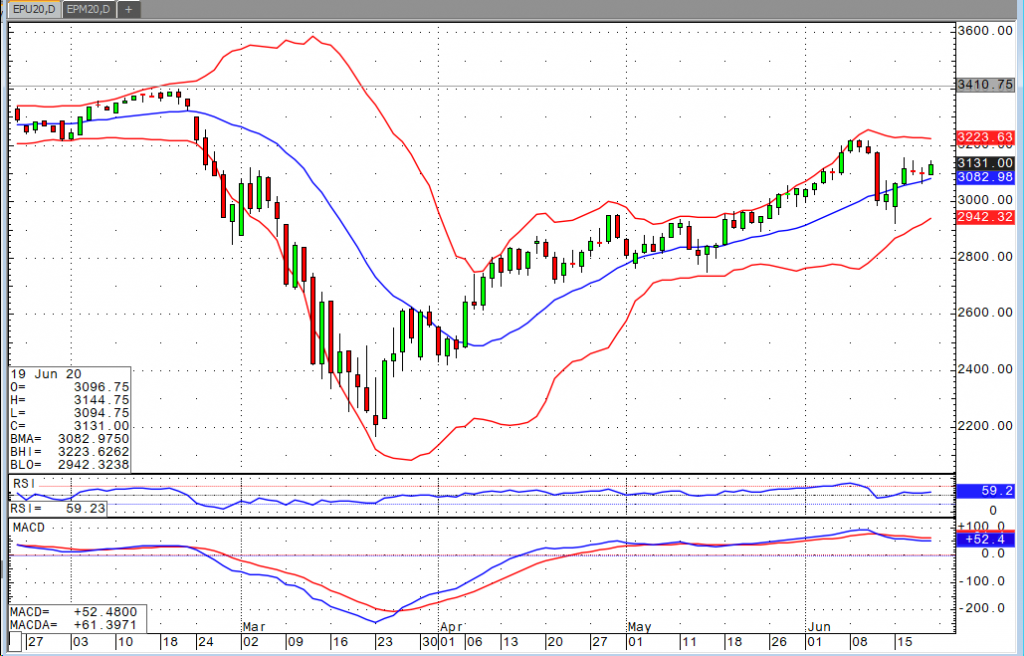
The Markets
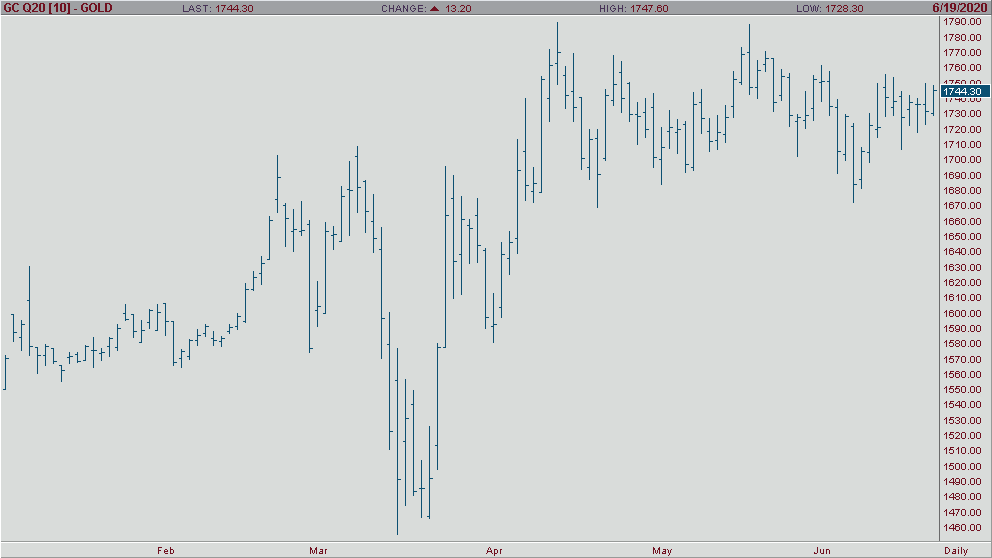
Metals - Will Gold Test $1,800 to $2,000 an Ounce
Will Gold Test $1,800 to $2,000 an Ounce
By: Nicholas DeGeorgePosted 06/19/2020
In the early morning trade, the shiny one is up towards the
weekly highs again and trying to break out and above the $1,755 resistance
level. While Morgan Stanley announced that investors might scale back in buying
gold for “fear based” reasons as the economy continues to recover from the
Coronavirus lockdowns; however, they also extended their prices up between
$1,800 to $2,000 a troy ounce which may have helped gold pop off its overnight
lows. Also, with Coronavirus cases spiking in the South west like Florida it
could keep many “fear based” investors/traders alike to stay long gold. Lastly,
after over 40 million Americans were just laid off in the past few months and
the amount of stimulus that was used along with the amount of US debt added to
try and stimulate the US economy, one can’t help to think these are reasonable
gold price speculations.
If you look at a daily August gold chart, you’ll clearly see that gold is still in a strong uptrend as long as it stay above this week’s low and if so, are prone to rally and test those levels mention above.
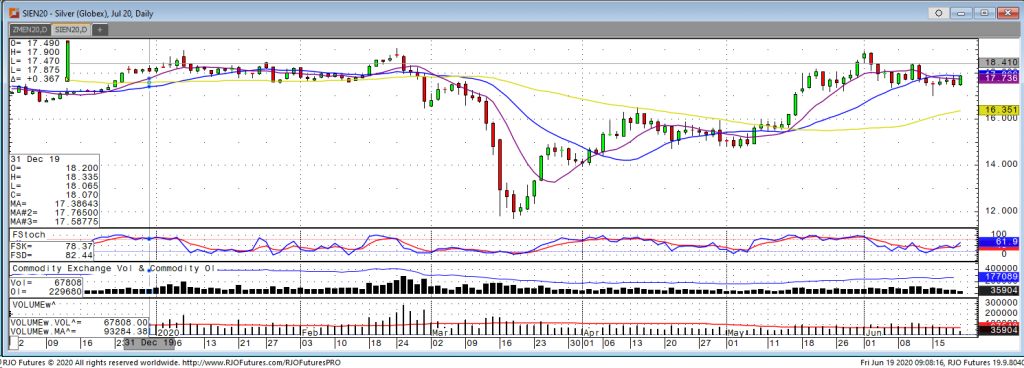
Gold Aug '20 Daily ChartMetals - Silver Under Pressure
Silver has been under pressure after a strong rally and
looks to be taking a breather. The precious metals market as a whole has
benefited from the uncertainty due to the pandemic and the feds ‘Range of
tools’ that have been in play. In the long-term, we can expect the market to
possibly be even more resilient than gold due to its spec positioning and real
rates on U.S. economic growth. Funds may take larger positions as the CME
reduced its futures margin by nearly $1000, more than 30 million remain
unemployed and this leaves a solid foundation of safe haven support which may
also help fuel traders to get involved in an attempt for another leg higher.
This fear-based demand should help weigh on economic optimism and in the short
term silver and other precious metals will continue to have much volatility,
lots of fluctuations, and be dependent on COVID cases and the feds assessment
of its full range of tools.
July silver is set-up somewhat in a neutral zone which may cause price fluctuations. Silver has support at $17.50 and again at $17.75, these levels have been bought up in the past by traders. These levels will need to be held in order to see a re-test of the $17.90 and $18.00 dollar levels. A close in-between may cause further defensive posture within the metal.
Silver Jul '20 Daily Chart If you have any questions or would like to discuss the markets further, please feel free to contact me at 800-826-2270 or therrmann@rjofutures.com. Energy - Oil Leading Reflation Ramp Up
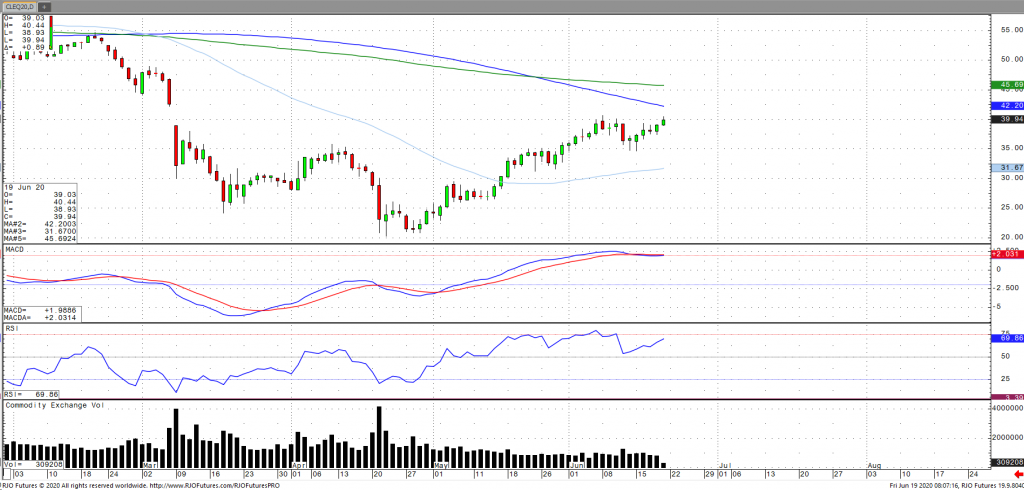
Oil Leading Reflation Ramp Up
By: Alex Turro, Senior Market StrategistPosted Jun 19, 2020 8:49AM CT
Oil has continued to extend higher leading the reflation ramp up, hovering just above $40 a barrel as the market attempts to digest supply and demand prospects. Renewed concerns regarding an uptick in corona cases in Beijing and parts of the US have weighed on sentiment as well as recent reports that Indian crude oil imports fell to its lowest since 2014 last month. This has been buffered by a record output cut by OPEC plus cutting nearly 10 million barrels a day or nearly 10% of output since May 1. OPEC’s joint ministerial monitoring stated on Thursday that compliance was near 87% for the month of May, reiterating cuts are continuing through July with noncompliant countries retroactively responsible for any missed targets. Weekly inventories for US stockpiles rose for the second consecutive week, however, inventories of gasoline and distillates fell, indicating improving demand. To note, Brent moved into backwardation on Thursday for the first time since March, which typically indicates tightening supply and increasing storage withdrawal. Oil volatility (OVX) remains highly elevated with the market now transitioning to neutral trend with today’s range seen between 35.67 – 41.25.
Crude Oil Aug '20 Daily Chart If you have any questions or would like to discuss the markets further, please feel free to contact me at 800-438-4805 or aturro@rjofutures.com. Softs - Coronavirus Continues to Weaken Demand for Cocoa/Chocolate
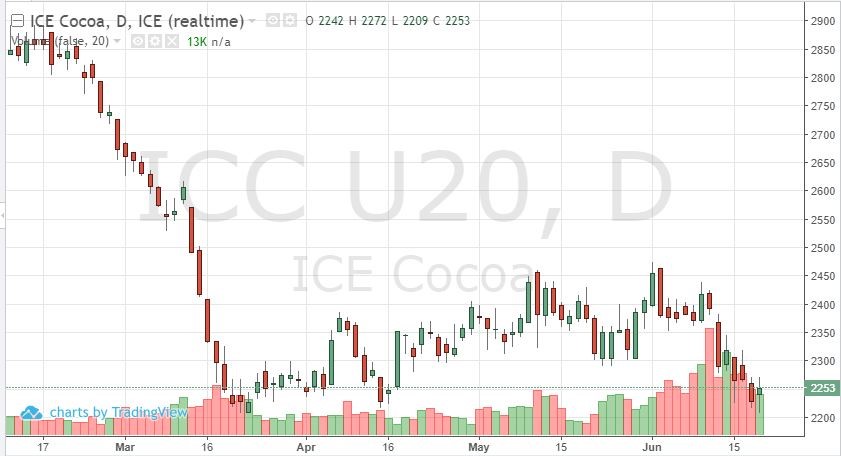
Coronavirus Continues to Weaken Demand for Cocoa/Chocolate
By: Peter MoosesPosted 06/19/2020
Cocoa futures have been one of the commodities has that been
a good indicator of where people are at as far as getting back to “normal.”
Chocolate companies have suffered as lockdowns and closures have slowed demand
for cocoa. As “entertainment” activities are no longer part of everyone’s
routine, goods like chocolate are not being sold at big venues (concerts,
sporting events, shows) and people have moved their expenses from luxury
purchases to necessities with all the unknowns in our current world.
Before this recent move lower, September cocoa had
consolidated and been somewhat range bound as states and countries attempted to
reopen. As cases of covid-19 start to climb in certain areas that have
reopened, the markets are starting to move lower again, reflecting the current
mindset of consumers. It appears this could be a longer-term trend in cocoa, possible
6 months to a year out.
Technically, the bottom appears to be around 2210, this will be tested in the coming weeks if no changes occur to the demand for cocoa.
Cocoa Sep '20 Daily ChartSofts - Coffee Shops and Social Distancing
Coffee Shops and Social Distancing
By: Adam TuiaanaPosted 06/17/2020
The slow but sure re-opening of the world economy
has the prices of September coffee futures quite confused at the minute. You
have a strong stock market bouncing back due to reopening and continued massive
support from the Fed, weighed directly against the promise of continued new
COVID 19 cases that have the US and China slowing things down until we can see
a clear impact. As many prepare to return to work, shopping and dining outside
of their homes, the current weak demand must show some promise for September
coffee prices to find support. Many restaurants and coffee shops that have
managed to remain solvent (quite remarkably), while complying with social
distancing guidelines will continue to suffer until they can enjoy doing
business at 100% capacity. Until then,
with a sizeable Brazilian crop on the horizon and continued uncertainty of
demand, coffee prices will likely continue lower.
From a technical perspective, a clear and violent violation of the 105 level to the downside (see daily chart attached) may see a pull back to that level before a continued selloff. While these massive swings in coffee prices continue, with questionable demand on the horizon, many traders may benefit from either being short or staying in cash for the time being.
On
the heels of mid-Sep-to-early-Oct's steeper, accelerated, 3rd-wave-looking
recovery, the past week-and-a-half's boringly lateral chop is first considered
a corrective/consolidative event that warns of a continuation of the uptrend
that preceded it to new highs above 04-Oct's 891.0 high. This count
remains consistent with our broader base/correction/recovery count introduced
in 13-Sep's Technical Blog following that
day's bullish divergence in short-term momentum above 07-Sep's 809.5 minor
corrective high detailed in the hourly chart below.
The
important takeaway from this month's lateral, sleepy price action is the
definition of Wed's 851.5 low as
the end or lower boundary of a suspected 4th-Wave correction. A failure
below 851.5 will confirm a bearish divergence in daily momentum and defer or
threaten a bullish count enough to warrant non-bullish decisions like
long-covers. A failure below 851.5 will not
necessarily negate a broader bullish count, but it will threaten it enough to
warrant defensive measures as the next pertinent technical levels below 851.5 are
13-Sep's prospective minor 1st-Wave high at 813.8 and obviously 08-Sep's 766.0
low. And making non-bullish decisions "down there" is
sub-optimal to say the least. Per such, both short- and longer-term
commercial traders are advised to pare or neutralize bullish exposure on a
failure below 851.5, acknowledging and accepting whipsaw risk- back above 04-Oct's
891.0 high- in exchange for much deeper and sub-optimal nominal risk below
766.0.
On
a broader scale, the daily log scale chart above shows the developing potential
for a bearish divergence in daily momentum that will be considered confirmed
below 851.5. This chart also shows the past month's recovery thus far
stalling in the immediate neighborhood of the (888.0) Fibonacci
minimum 38.2% retrace of Apr-Sep's entire 1128 - 766 decline). COMBINED
with a failure below 851.5, traders
would then need to be concerned with at least a larger-degree correction pf the
past month's rally and possibly a resumption of Apr-Sep's major downtrend.
Until
and unless the market fails below 851.5 however, we would
remind longer-term players of the key elements on which our bullish count is
predicated:
a confirmed bullish divergence in WEEKLY momentum
(below)
amidst
an
historically low 11% reading in out RJO Bullish Sentiment Index and
a
textbook complete and major 5-wave Elliott sequence down from 29-Apr's
1128 high to 08-Sep's 766.0 low.
Thus
far, the market is only a month into correcting a 4-MONTH, 32% drawdown, so
further and possibly protracted gains remain well within the bounds of a major
(suspected 2nd-Wave) correction of Apr-Sep's decline within an even more
massive PEAK/reversal process from 17-May's 1219 high on an active continuation
basis below.
These
issues considered, a bullish policy and exposure remain advised with a failure
below 851.5 required to defer or threaten this call enough to warrant moving to
a neutral/sideline position. In lieu of such weakness, we anticipate a
continuation of the past month's rally to new highs and potentially significant
gains above 891.0.
Agricultural - Corn Treads On
Corn Treads On
By: Tony Cholly, Senior Market StrategistPosted Jun 19, 2020 9:37AM CT
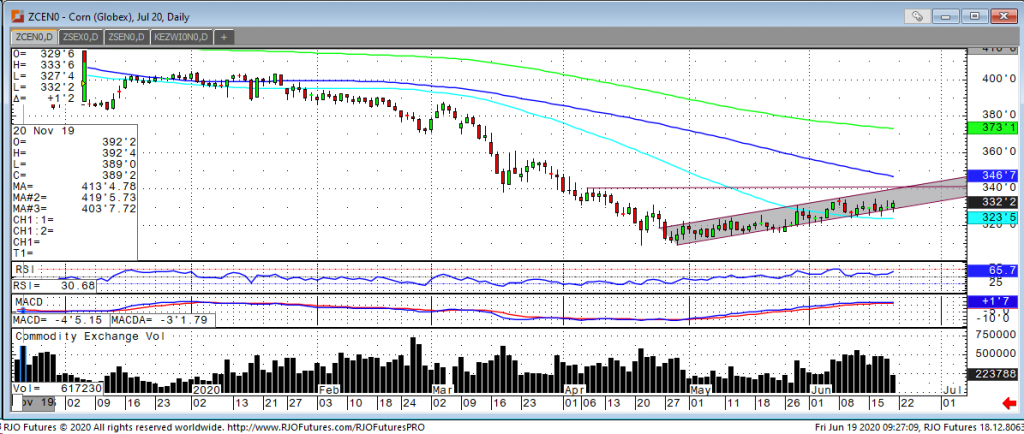
Corn futures rose slightly in the North American session,
the commodity was sent to Mexico as the top international destination. Although
shipments to China have slowed, they still totaled 2.6 million bushels, one of
the highest weekly export volumes. Despite this uptick China still remains
sluggish with purchases that were agreed to with Phase 1 commitments. It should
also be noted that the lack of significant weather has been seen as a bearish
force for the corn market. According to recent data, traders are holding over
300,000 net short contracts. The downside will be limited until there is more
certainty with reports on upcoming crops. Eventually, traders will be watching
to see if the higher prices in china could help support U.S. prices if there is
more active buying.
July corn has been in an overall uptrend making higher highs and higher lows within the price action of the contract. The contract has significant support at the $322 level as well as the $325 level. The contract will need to hold these levels to see another leg higher and re-test of the $333 resistance. A break of this level may spark some short covering and a test of $335 may be next up.
Corn Jul '20 Daily Chart If you have any questions or would like to discuss the markets further, please feel free to contact me at 800-826-2270 or tcholly@rjofutures.com. Agricultural - Grain Futures Update w/Stephen Davis - 06/19/2020
Grain Futures Update w/Stephen Davis - 06/19/2020
By: Stephen DavisPosted 06/19/2020
Stephen Davis discusses this week's movement in the grain markets. We are anxiously awaiting the June 30th acreage report as it will heavily dictate the outlook of the grain market.Currency - U.S. Dollar Index Observes Upside Correction
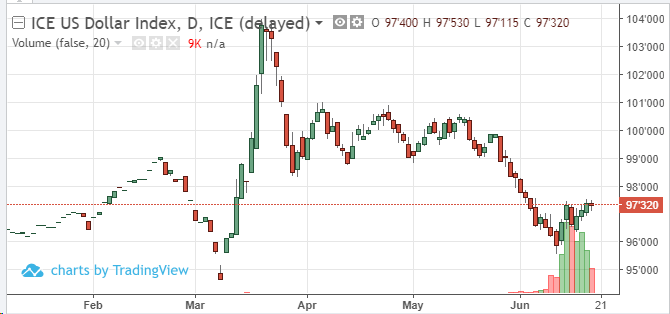
U.S. Dollar Index Observes Upside Correction
By: Ian BannonPosted 06/19/2020
September U.S. dollar futures are mildly red this morning, down about 10 points from the open. Upward price action over the last 8 sessions is not surprising following the landslide move lower. During the worst of the pandemic, the greenback was rangebound between 98 and 101. The index will likely find resistance at the low end of that channel going forward. The story hasn’t changed. The Fed’s “do whatever it takes” attitude has continued to provide market liquidity, which will weaken the U.S. currency unless it takes on a safe-haven characteristic. When risk sentiment is positive, the dollar will continue to have a negative bias. However, this upside correction may continue through the 98 level. When the dollar inevitably breaks down, the European currencies (most notably the Euro) are likely to catch big moves to the upside. Emerging markets currencies are likely to perform as well, especially if we see commodity prices move higher. Often, a currency is supported when the commodities produced in that country see price inflation.
USD Sep '20 Daily Chart
Interest Rates - All Eyes on September 10-year Note
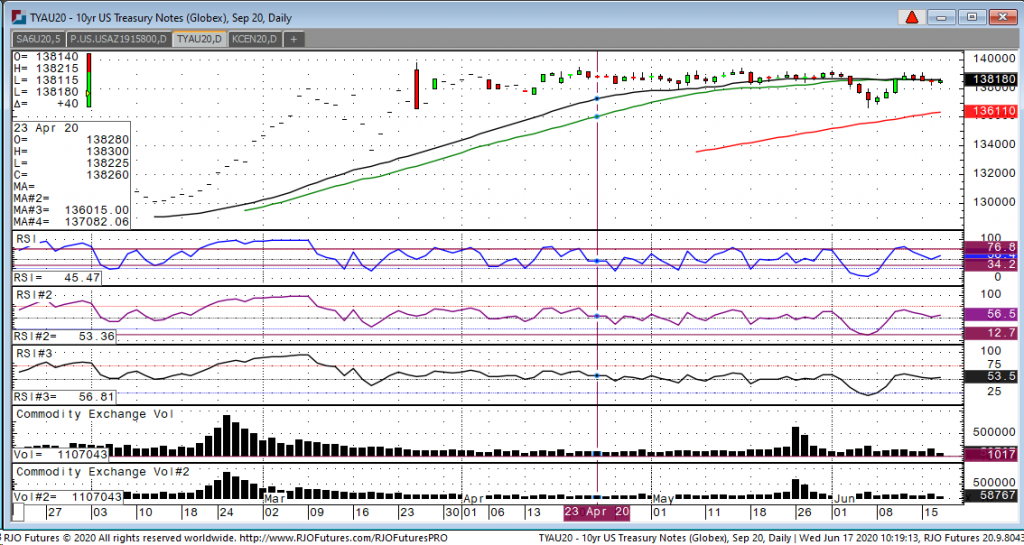
The September 10-year note recovered after last week’s failure of support, although bonds have recovered to an area of credible levels. The feds strategy of avoiding inflation expectations slipping has proved to be a bullish factor. Another thing traders will be watching for is continued bullishness in the rollout of massive fiscal stimulus programs worldwide. The guidance that was given at the latest FOMC meeting further indicates more market volatility in the near future, as their forecasting of the trajectory of the economy and federal funds rate tend to be an indicator of this. The focus moving forward will be the September 10-year note and how it will trade given the feds ‘Range of Tools’ in play to counter the pandemic. The feds report came two days after the central bank kept its benchmark at a record low through 2022.
10-year, September contract has support 138’150 that it has bounced off before in the short term. If this level fails we can see a quick re-test of 138’120 which has been greater support in the past. If these levels hold we may get a test of resistance at 138’200, a break of this we may test a greater point of resistance at 138’225.
10-yr Note Sep '20 Daily Chart If you have any questions or would like to discuss the markets further, please feel free to contact me at 800-826-2270 or gperlin@rjofutures.com. Equity - Stocks Ripping in Early Going
Stocks Ripping in Early Going
By: Bill Dixon, Senior Market StrategistPosted Jun 19, 2020 9:10AM CT
All four indices are up decisively to kick things off this morning. The S&P, Dow, Nasdaq, and Russell are all up over one percent in the wake of the open. News of a secret meeting between China and the U.S. in Hawaii to discuss trade has been received as a positive development and is driving markets higher. On the flip side of the China news, cases of coronavirus continue to spike as states reopen and availability of testing increases. The cases number seems to be a point of contention for market participants. Some see the spike in positive tests as an extremely bearish development. If reopening local economies is going to lead to more people getting sick, then perhaps the lockdowns should continue. On the other hand, some seem not to care too much about the number of positive tests as much as they do about hospitalizations and death counts. I’m not entirely sure who is right, but the market seems to be more worried about the latter.
E-mini S&P 500 Sep '20 Daily Chart If you have any questions or would like to discuss the markets further, please feel free to contact me at 800-669-5354 or bdixon@rjofutures.com. Economy - S-T Mo Failure Insufficient to End RBOB Correction, But Beware
S-T Mo Failure Insufficient to End RBOB Correction, But Beware
By: RJO Market InsightsPosted 11/08/2022
Posted on Nov 08, 2022, 07:51 by Dave Toth
In Fri's Technical Webcast we identified a
minor corrective low at 2.6328 from Thur as a mini risk parameter the market
needed to sustain gains above to maintain a more immediate bullish count.
The 240-min chart below shows the market's failure overnight below this level,
confirming a bearish divergence in very short-term momentum. This mo
failure defines Fri's 2.8172 high as
one of developing importance and a parameter from which very short-term traders
can objectively base non-bullish decisions like long-covers.
Given
the magnitude of the past three weeks' broader recovery however, this
short-term momentum failure is of an insufficient scale to conclude anything
more than another correction within this broader recovery from 26-Sep's 2.1877
low. Indeed, overnights failure below 2.6328 only allows us to conclude
the end of the portion of the month-and-a-half rally from 31-Oct's 2.4822 next
larger-degree corrective low. 2.4822 is the
risk parameter this market still needs to fail below to break the uptrend from
18-Oct's 2.3526 low while this 2.3526 low
remains intact as the risk parameter this market needs to fail below to break
the month-and-a-half uptrend. From an
intermediate-to-longer-term perspective, this week's setback falls well within
the bounds of another correction ahead of further gains. This is another
excellent example of the importance of technical and trading SCALE and
understanding and matching directional risk exposure to one's personal risk
profile.
The
reason overnight's admittedly minor mo failure might have longer-term
importance is the 2.8172-area from which it stemmed. In
Fri's Technical Blog we also noted the market's engagement of the
2.8076-to-2.8159-area marked by the 61.8% retrace of Jun0-Sewp's 3.2758 -2.1877
decline and the 1.000 progression of Sep-Oct's initial 2.1877 - 2.6185
(suspected a-Wave) rally from 18-Oct's 2.3526 (suspected b-Wave) low. We
remind longer-term players that because of the unique and compelling confluence
of:
early-Aug's bearish divergence in WEEKLY momentum
amidst
historically
extreme bullish sentiment/contrary opinion levels in our RJO Bullish
Sentiment Index
an
arguably complete and massive 5-wave Elliott sequence from Mar'20's 0.4605
low to Jun's 4.3260 high (as labeled in the weekly log active-continuation
chart below) and
the
5-wave impulsive sub-division of Jun-Sep's (suspected initial 1st-Wave) decline
The
recovery attempt from 26-Sep's 2.1877 low is arguably only a 3-wave (Wave-2)
corrective rebuttal to Jun-Sep's decline within a massive, multi-quarter
PEAK/reversal process. Now granted, due to the magnitude of 2020 -2022's
secular bull market, we discussed the prospect for this (2nd-Wave corrective)
recovery to be "extensive" in terms of both price and time. A
"more extensive" correction is typified by a retracement of 61.8% or
more and spanning weeks or even months following a 3-month decline. Per
such, the (suspected corrective) recovery from 26-Sep's 2.1877 low could easily
have further to go, with commensurately larger-degree weakness than that
exhibited this week (i.e., a failure below at least 2.4822) required
to consider the correction complete. Indeed, the daily log chart above
shows the market thus far respecting former 2.6185-area resistance from 10-Oct
as a new support candidate.
These
issues considered, very shorter-term traders have been advised to move to a neutral/sideline
position following overnight's momentum failure below 2.6328, with a recovery
above 2.8172 required to negate this call, reaffirm the recovery and re-expose
potentially significant gains thereafter. For intermediate- and
longer-term players, a bullish policy and exposure remain advised with a
failure below 2.4822 required to threaten this call enough to warrant
neutralizing exposure. We will be watchful for another bearish divergence
in momentum following a recovery attempt that falls short of Fri's 2.8172 high
that would be considered the next reinforcing factor to a count calling that
2.8172 high the prospective end to the month-and-a-half 2nd-Wave
correction. In lieu of such, a resumption of the current rally to
eventual new highs above 2.8172 should not surprise.