Profits and Losses: How they both impact on you mentally;
How experienced traders shift their mental approach to overcome their trading obstacles;
How to protect your emotional capital;
The 7 steps to achieving a better trading psychology.
The Markets
Metals - The Great American Comeback or Too Soon?
The Great American Comeback or Too Soon?
By: Nicholas DeGeorgePosted 07/02/2020
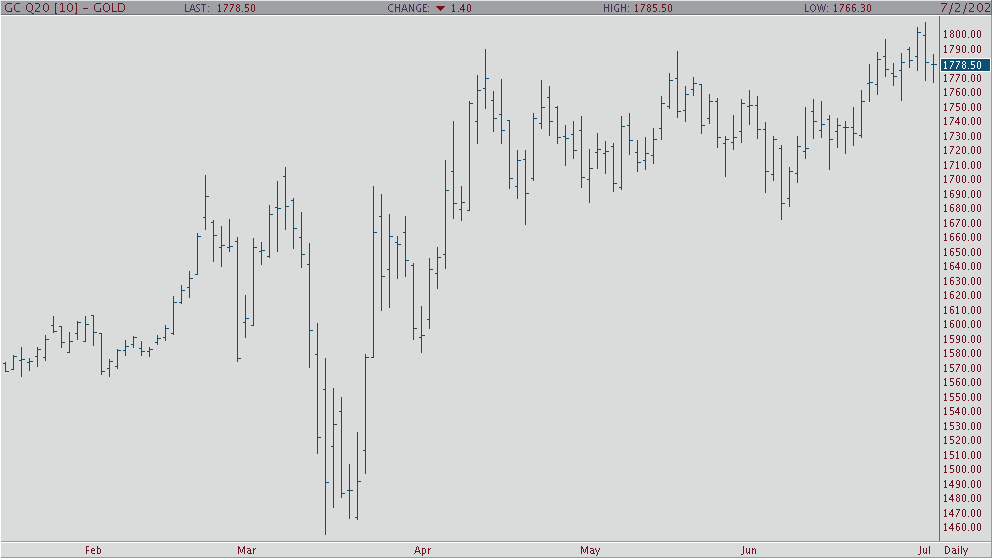
In the early morning trade, gold has pulled back from this
week’s high after finally breaking above $1,800 an ounce, but is currents
trading at $1,767 an ounce. Yesterday, gold started to sell off from its high
largely due to positive news that Pfizer and a biotech company out of Germany
have made a promising drug for the Coronavirus, which Dr. Fauci stated could be
available to the public later this year. Furthermore, gold continued its sell
off this morning due to the very positive jobs number with unemployment falling
to 11.1% in June with employers rehiring 4.8 million American, which is the
highest record EVER recorded. Are we on the cusp of The Great American
Comeback? If this trend continues-we sure are. Happy Fourth of July weekend to
all!
If you look at the daily August gold chart, you’ll clearly see that gold broke below a long term up trend and now is open to a possible sell off back down to the low $1,700s unless it rallies back today. If it can hold, look for gold to rally back to $1,800 an ounce.
Gold Aug '20 Daily ChartMetals - Silver Consolidation Continues
September silver has traded adjacent to the strength in
gold, and the second wave of the virus could very well add more support in the
contract. Prices have rallied significantly from March, so a consolidation at
these levels would be warranted. That being said, safe haven demand remains
steady, and interest rates in this environment make this fundamentally sound
and attractive to traders and investors alike. It should be noted that
inflation data will also be closely watched as a key fundamental, the more that
the Federal Reserve acts to prevent other market declines through fiscal
policies we will see undermining and destruction longer term in other market
prices.
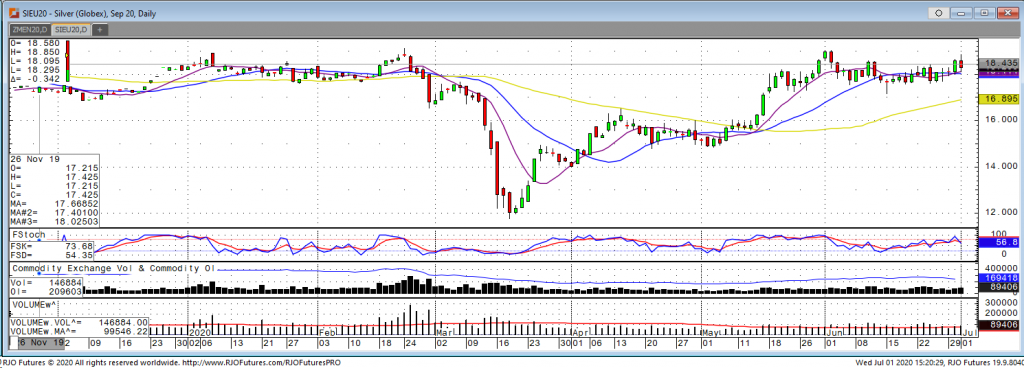
September silver is undergoing consolidation and the $18.00-dollar level remains in focus as a key level of support for bulls. If this level fails to hold, consolidation may not be intact, and a test of the $17.80 level will be tested. In order to see the contract trade at the $19.00-dollar level and beyond we will need to test $18.70 and $18.90.
Silver Sep '20 Daily Chart If you have any questions or would like to discuss the markets further, please feel free to contact me at 800-826-2270 or therrmann@rjofutures.com. Energy - Oil Continues Its Climb
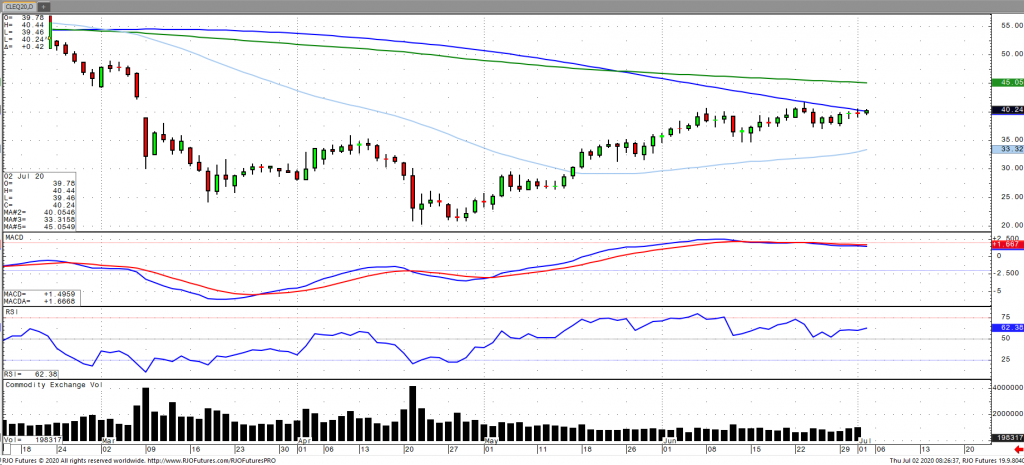
WTI crude registered its highest quarterly performance of more than 91% and is trading at its highest level since early March but is still down over 34% from the start of the year as the market assess enhanced demand prospects, despite recent reports of lowered Chinese imports as well as ongoing fears of corona lockdown in the U.S. This comes amidst data showing U.S. crude stockpiles fell more than expected from a record high last week as refiners increase production and imports ease. Prices have been buoyed by recovering fuel demand and supply cuts from OPEC plus, with some focus on the upcoming U.S. holiday driving activity as well as how expeditiously U.S. producers revive shut in production as U.S. companies and OPEC producers start to increase output due to higher prices. Oil has now transitioned to bullish trend as the reflation ramp up continues with today’s range seen between 36.92 – 41.22.
Crude Oil Aug '20 Daily Chart If you have any questions or would like to discuss the markets further, please feel free to contact me at 800-438-4805 or aturro@rjofutures.com. Softs - Increase in Covid Cases/Decrease in Demand for Cocoa
Increase in Covid Cases/Decrease in Demand for Cocoa
By: Peter MoosesPosted 07/01/2020
As
the world, especially in the United States, sees an increase in Covid cases
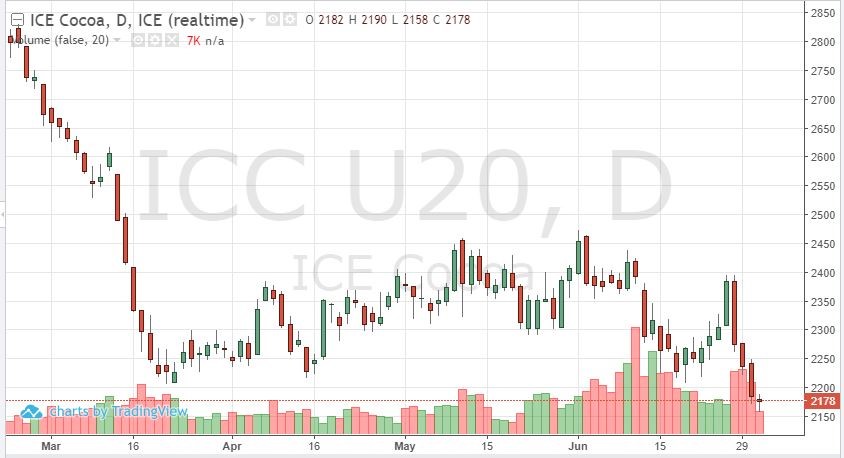
some commodity prices are weakening. Cocoa had a small rally but failed to
trade and hold above 2400 in the September contract. As the old lows were
tested the past few sessions, on Tuesday 2200 was broken. Demand has been a
long-term issue for cocoa even before the virus spread but now that less cocoa
is needed for consumption the bottom could be unknown. Will 2000 be the next
downside target? If more re-openings are paused, indoor restaurant seating
remains closed and sporting events are delayed any further “food” commodities
could continue to take a big hit.
Food
companies remain positive that the markets will turn around, demand will
return, and things will go to a new “normal” once the pandemic is under some
control. But for the time being, it appears we are a long way from that.
Bearish traders may want to look at long puts in the front months. Traders who anticipate a recovery will want to look further out, 2021 options for example, to have exposure once the softs recover.
Cocoa Sep '20 Daily ChartSofts - Coffee Demand in Question
Coffee Demand in Question
By: Adam TuiaanaPosted 06/30/2020
As several States begin to shut down after just
re-opening due to the spread of COVID 19, we can expect yet another challenge
on the demand side for September coffee. This new shutdown will be weighed
against recent reports that temperatures in key growing areas of Brazil are
colder than normal, thus possibly delaying and affecting the upcoming crop
while frost damage becomes a real possibility.
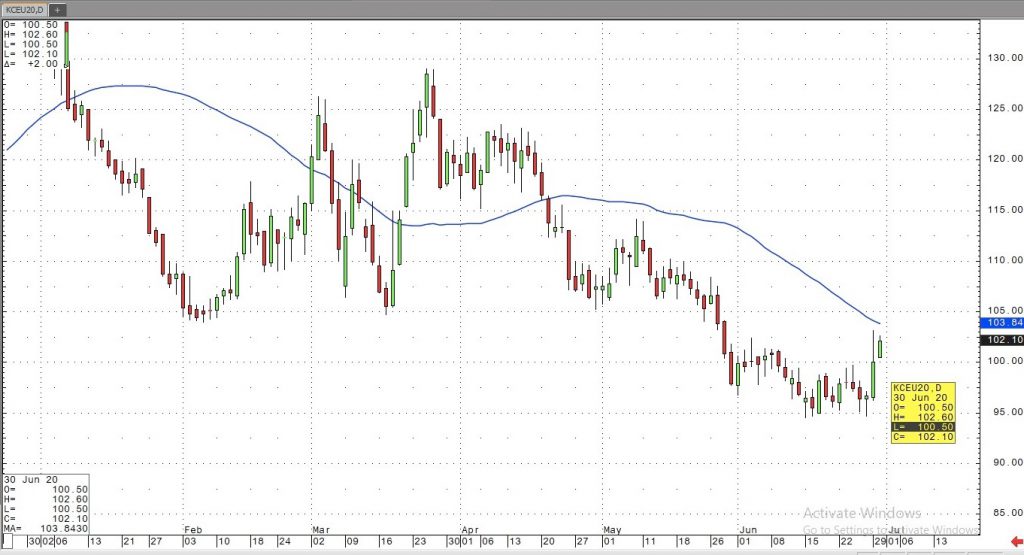
September coffee futures recently broke out of consolidation due to the
reported temperatures in Brazil, and coffee prices have been able to hold
support at the 95 level.
From a technical perspective, a likely return to the 50-day moving average at the 104 level is likely to take place in the near term. However, ultimately may see stiff resistance at the 50-day moving average as the await the effects of the recent increase in new cases, which will likely delay a reversal to the upside for September coffee prices.
On
the heels of mid-Sep-to-early-Oct's steeper, accelerated, 3rd-wave-looking
recovery, the past week-and-a-half's boringly lateral chop is first considered
a corrective/consolidative event that warns of a continuation of the uptrend
that preceded it to new highs above 04-Oct's 891.0 high. This count
remains consistent with our broader base/correction/recovery count introduced
in 13-Sep's Technical Blog following that
day's bullish divergence in short-term momentum above 07-Sep's 809.5 minor
corrective high detailed in the hourly chart below.
The
important takeaway from this month's lateral, sleepy price action is the
definition of Wed's 851.5 low as
the end or lower boundary of a suspected 4th-Wave correction. A failure
below 851.5 will confirm a bearish divergence in daily momentum and defer or
threaten a bullish count enough to warrant non-bullish decisions like
long-covers. A failure below 851.5 will not
necessarily negate a broader bullish count, but it will threaten it enough to
warrant defensive measures as the next pertinent technical levels below 851.5 are
13-Sep's prospective minor 1st-Wave high at 813.8 and obviously 08-Sep's 766.0
low. And making non-bullish decisions "down there" is
sub-optimal to say the least. Per such, both short- and longer-term
commercial traders are advised to pare or neutralize bullish exposure on a
failure below 851.5, acknowledging and accepting whipsaw risk- back above 04-Oct's
891.0 high- in exchange for much deeper and sub-optimal nominal risk below
766.0.
On
a broader scale, the daily log scale chart above shows the developing potential
for a bearish divergence in daily momentum that will be considered confirmed
below 851.5. This chart also shows the past month's recovery thus far
stalling in the immediate neighborhood of the (888.0) Fibonacci
minimum 38.2% retrace of Apr-Sep's entire 1128 - 766 decline). COMBINED
with a failure below 851.5, traders
would then need to be concerned with at least a larger-degree correction pf the
past month's rally and possibly a resumption of Apr-Sep's major downtrend.
Until
and unless the market fails below 851.5 however, we would
remind longer-term players of the key elements on which our bullish count is
predicated:
a confirmed bullish divergence in WEEKLY momentum
(below)
amidst
an
historically low 11% reading in out RJO Bullish Sentiment Index and
a
textbook complete and major 5-wave Elliott sequence down from 29-Apr's
1128 high to 08-Sep's 766.0 low.
Thus
far, the market is only a month into correcting a 4-MONTH, 32% drawdown, so
further and possibly protracted gains remain well within the bounds of a major
(suspected 2nd-Wave) correction of Apr-Sep's decline within an even more
massive PEAK/reversal process from 17-May's 1219 high on an active continuation
basis below.
These
issues considered, a bullish policy and exposure remain advised with a failure
below 851.5 required to defer or threaten this call enough to warrant moving to
a neutral/sideline position. In lieu of such weakness, we anticipate a
continuation of the past month's rally to new highs and potentially significant
gains above 891.0.
Agricultural - Grain Futures Update w/Stephen Davis - 07/02/2020
Grain Futures Update w/Stephen Davis - 07/02/2020
By: Stephen DavisPosted 07/02/2020
Stephen Davis discusses the latest movements in the grain markets.Currency - Global Currency Forecast
Global Currency Forecast
By: Ian BannonPosted 07/02/2020
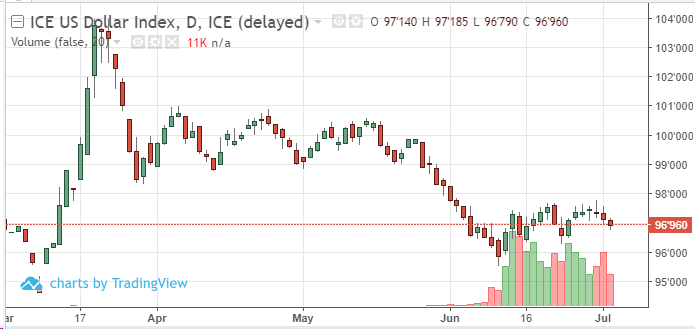
The dollar index is marginally lower this morning after non-farm payrolls added another 4.8 million jobs in June, bringing the unemployment rate down to 11.1%. Buying the dollar has become a ‘risk-off’ trade. As long as optimism remains present in the markets, the dollar is likely to extend its downtrend. Currency markets are often useful in forecasting macroeconomic movements. Commodity currencies, like the Aussie dollar, are showing relative strength. This may be an indication that commodity prices are likely to continue their climb higher from the March lows. The USD is continuously failing at resistance levels, leading me to believe that stimulus may spur inflation down the line, and there may be more fiscal/monetary support coming out of Washington. Keep an eye on the Japanese yen if a ‘risk-off’ mindset returns to the markets. Over the intermediate/longer-term, the euro is likely to gain strength against the dollar given the arsenal of tools being applied by the U.S. central bank.
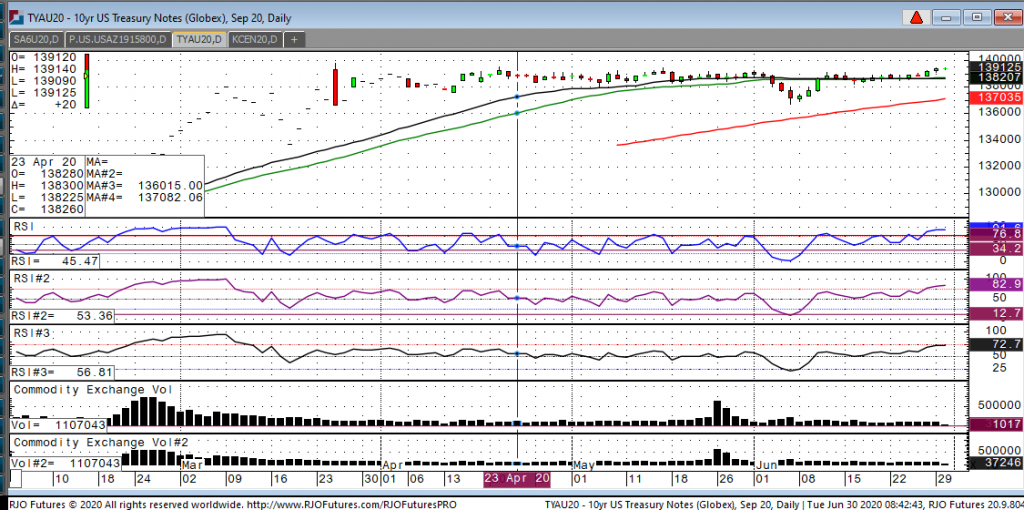
The September 10-year note is trading back to contract highs
seen in early May. The Federal Reserve has slashed interest rates to nearly
zero along with pumping $2 trillion into treasuries and MBS. Traders will be
watching the June Chicago PMI which is expected to have an uptick from May’s
reading. It should also be noted that Powell will be testifying in front of the
House Financial Services Committee during trading hours today. The 10-year note
contract had an open-interest increase of nearly 180,000. Traders will be
positioning themselves ahead of Wednesdays release of the feds previous
minutes.
10-year September contract has support 139’075 that it has found buyers at before in the short term. If this level fails we can see a quick re-test of 139’35 which has been greater support in the past. If these levels hold we may get a test of resistance at 139’140, a break of this we may test a greater point of resistance at 139’150.
10-Year Note Sep '20 Daily Chart If you have any questions or would like to discuss the markets further, please feel free to contact me at 800-826-2270 or gperlin@rjofutures.com. Equity - Jobs Number Impresses Again
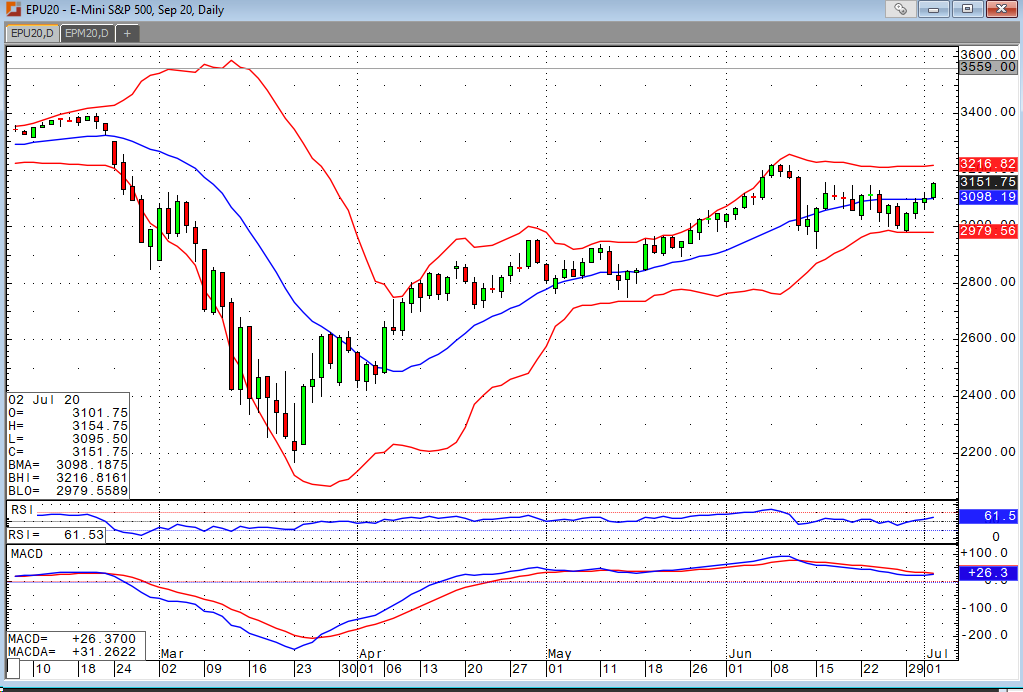
The most hated rally in recent memory continues to power on. I get it. Things aren’t exactly rosy out there. However, the market continues to discount the perceived risks, and we’re up roughly 1.5% in the four major indices. Consensus expectations for this morning’s nonfarm payrolls was 3,000,000. We saw a number of 4,8000,000 and an upward revision of last month’s number from 2,509,000 to 2,699,000. The unemployment rate, which was anticipated to come out at 12.4%, was reported at 11.1%. Private payrolls and manufacturing jobs were huge contributors. The private sector added over 4.7M jobs vs. expected 2.66M. We also had a revision on last months number of an additional 138k. Manufacturing jobs increased by 356k vs. an expected 180k. There was also an upward revision ther of an additional 25k manufacturing jobs in last month’s number. On the flip side, we saw average hourly earnings dip by 1.2%.
The Fed is doing all they can to support the economy. There is a legitimate argument about who is benefiting from their actions, but that’s a conversation for another day. The bottom line is that betting against the Fed has been a tremendous way to lose money over the years. It’s hard to say where all this will stop. The virus is obviously the biggest headwind here. The concerns are legitimate, but the market seems to be optimistic about the prospects for a vaccine. Suppose we have one in the next six months. My biggest question is whether or not that has been priced in, or if we’ll end up having to chase the market at higher levels as a result. Dip buyers continue to get paid in the interim.
E-mini S&P 500 Sep '20 Daily Chart If you have any questions or would like to discuss the markets further, please feel free to contact me at 800-669-5354 or bdixon@rjofutures.com. Economy - S-T Mo Failure Insufficient to End RBOB Correction, But Beware
S-T Mo Failure Insufficient to End RBOB Correction, But Beware
By: RJO Market InsightsPosted 11/08/2022
Posted on Nov 08, 2022, 07:51 by Dave Toth
In Fri's Technical Webcast we identified a
minor corrective low at 2.6328 from Thur as a mini risk parameter the market
needed to sustain gains above to maintain a more immediate bullish count.
The 240-min chart below shows the market's failure overnight below this level,
confirming a bearish divergence in very short-term momentum. This mo
failure defines Fri's 2.8172 high as
one of developing importance and a parameter from which very short-term traders
can objectively base non-bullish decisions like long-covers.
Given
the magnitude of the past three weeks' broader recovery however, this
short-term momentum failure is of an insufficient scale to conclude anything
more than another correction within this broader recovery from 26-Sep's 2.1877
low. Indeed, overnights failure below 2.6328 only allows us to conclude
the end of the portion of the month-and-a-half rally from 31-Oct's 2.4822 next
larger-degree corrective low. 2.4822 is the
risk parameter this market still needs to fail below to break the uptrend from
18-Oct's 2.3526 low while this 2.3526 low
remains intact as the risk parameter this market needs to fail below to break
the month-and-a-half uptrend. From an
intermediate-to-longer-term perspective, this week's setback falls well within
the bounds of another correction ahead of further gains. This is another
excellent example of the importance of technical and trading SCALE and
understanding and matching directional risk exposure to one's personal risk
profile.
The
reason overnight's admittedly minor mo failure might have longer-term
importance is the 2.8172-area from which it stemmed. In
Fri's Technical Blog we also noted the market's engagement of the
2.8076-to-2.8159-area marked by the 61.8% retrace of Jun0-Sewp's 3.2758 -2.1877
decline and the 1.000 progression of Sep-Oct's initial 2.1877 - 2.6185
(suspected a-Wave) rally from 18-Oct's 2.3526 (suspected b-Wave) low. We
remind longer-term players that because of the unique and compelling confluence
of:
early-Aug's bearish divergence in WEEKLY momentum
amidst
historically
extreme bullish sentiment/contrary opinion levels in our RJO Bullish
Sentiment Index
an
arguably complete and massive 5-wave Elliott sequence from Mar'20's 0.4605
low to Jun's 4.3260 high (as labeled in the weekly log active-continuation
chart below) and
the
5-wave impulsive sub-division of Jun-Sep's (suspected initial 1st-Wave) decline
The
recovery attempt from 26-Sep's 2.1877 low is arguably only a 3-wave (Wave-2)
corrective rebuttal to Jun-Sep's decline within a massive, multi-quarter
PEAK/reversal process. Now granted, due to the magnitude of 2020 -2022's
secular bull market, we discussed the prospect for this (2nd-Wave corrective)
recovery to be "extensive" in terms of both price and time. A
"more extensive" correction is typified by a retracement of 61.8% or
more and spanning weeks or even months following a 3-month decline. Per
such, the (suspected corrective) recovery from 26-Sep's 2.1877 low could easily
have further to go, with commensurately larger-degree weakness than that
exhibited this week (i.e., a failure below at least 2.4822) required
to consider the correction complete. Indeed, the daily log chart above
shows the market thus far respecting former 2.6185-area resistance from 10-Oct
as a new support candidate.
These
issues considered, very shorter-term traders have been advised to move to a neutral/sideline
position following overnight's momentum failure below 2.6328, with a recovery
above 2.8172 required to negate this call, reaffirm the recovery and re-expose
potentially significant gains thereafter. For intermediate- and
longer-term players, a bullish policy and exposure remain advised with a
failure below 2.4822 required to threaten this call enough to warrant
neutralizing exposure. We will be watchful for another bearish divergence
in momentum following a recovery attempt that falls short of Fri's 2.8172 high
that would be considered the next reinforcing factor to a count calling that
2.8172 high the prospective end to the month-and-a-half 2nd-Wave
correction. In lieu of such, a resumption of the current rally to
eventual new highs above 2.8172 should not surprise.