RJO FuturesCast

August 21, 2020 | Volume 14, Issue 34

The Markets

Metals - Gold Traders Should Look at Big Picture

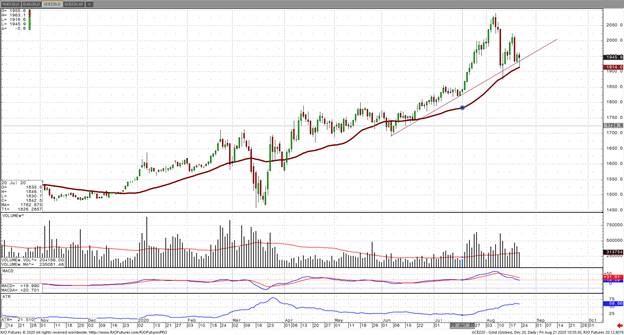
It’s no secret that gold has been extremely volatile over the past few weeks. I look at the recent unprecedented 7 year intraday $120 selloff and think of this day in particular as a “shake the tree and let the weak longs fall to the ground” type of event. It’s simply scaring traders out of positions they want to be in, but the leverage involved is simply too great for emotions to not be a factor. Gold is a crowded trade at this point, but that doesn’t mean it’s wrong. These types of moves in a market where a $40 up or down used to be a “big” move are now seen as the norm. The Average True Range, or ATR, on gold has been lifted from $23 in late July to now $60. This means that the swings expected are $60 on any given trading day. On one standard COMEX 100 oz futures contract this equates to $6000 profit or loss. Traders who are not prepared to stomach those types of moves should be looking at the smaller 10, 33, and 50 oz futures contracts instead of the 100 oz.

If we look at this from a technical perspective gold still trades in a positive trend and should continue to do so as long as dips continue to get bought into. The volume associated with the key support levels of 1900 and 1950 confirm this. Fundamentally the gold market is very well supported as a weak dollar, aggressive “helicopter money” from the fed, and traders in search of safe havens and a better yield continue to support. Consider the fact that the ETF holdings of gold and central banks around the world week after week continue to increase holdings as another very real bullish factor at play. I have been using a combination of futures and options for protection in my trading strategy for gold which is an approach to trading without emotions getting involved in these large swings.

Gold Sep '20 Daily Chart
Metals - Mid-Week Metals Update w/Bob Haberkorn - 08/19/2020
Bob Haberkorn discusses an interestintg week in the metals market, and outlines where he sees it going.
If you have any questions or would like to discuss the markets further, please feel free to contact me at 800-826-1120 or rhaberkorn@rjofutures.com.
Metals - Silver Down on The Day

Front-month Silver is down 43 cents on the day trading at $26.73. Strong PMI and possibly strong existing home sales here in a few minutes will probably continue to give us a sense that the economy is slowly recovering from the pandemic. After being in free fall for several sessions, the U.S. dollar is showing a sigh of a corrective rally. Silver is still holding on regardless of dollar strength. Silver will probably continue to attract latecomers to the rally that has been trying to push and sustain silver above $30.00. Silver will continue to be sensitive to any signs of slowing down.

From a Technical perspective, silver needs to continue to hold above 2550 areas to keep off a sustained bear attach. A break below that level could trigger a wash below 25.00. a break above 28.00 will signal a continuation of the trend. Gold/Silver ration is sitting around 72.77 most likely, with a good silver showing, we can see a break below 70.00 soon in my view.

As I said before, the path of least resistance remains up. Silver continues to benefit over gold on this rally. The only thing that could slow down silver is recession type of economic data. My favorite saying, “ trade what you see, not what you think”. An option might be a way to approach this market. If you need additional help, please let me know. We can also approach this market using options as well as the 1000oz contract.

Silver Sep '20 Daily Chart
If you have any questions or would like to discuss the markets further, please feel free to contact me at 800-367-7290 or etesfaye@rjofutures.com.
Energy - Oil Lower on Oversupply Concerns, Uptick in Jobs

Oil prices are nudging lower this morning after falling nearly 1% yesterday as U.S. jobless claims rose unexpectedly and OPEC+ stating there is a need to address a daily oversupply of over 2 million barrels by some members. OPEC+ earlier this week added that the speed of the recovery process appears to be slower than expected with virus concerns continuing to weigh on the market. US fuel demand fell by more than 2 million bpd to 17.2 bpd according to the EIA with demand down roughly 14% from year ago levels. Oil stocks fell for the fourth consecutive week. The dollar is firming up this morning as well which is continuing to put pressure on prices. The market remains bullish trend with today’s range seen between 41.24 – 43.63.

Crude Oil Oct '20 Daily Chart
If you have any questions or would like to discuss the markets further, please feel free to contact me at 800-438-4805 or aturro@rjofutures.com.
Agricultural - Bullish Canola Count Intact Above Minimum 851.5

Posted on Oct 14, 2022, 07:42 by Dave Toth

On the heels of mid-Sep-to-early-Oct's steeper, accelerated, 3rd-wave-looking recovery, the past week-and-a-half's boringly lateral chop is first considered a corrective/consolidative event that warns of a continuation of the uptrend that preceded it to new highs above 04-Oct's 891.0 high.  This count remains consistent with our broader base/correction/recovery count introduced in 13-Sep's Technical Blog following that day's bullish divergence in short-term momentum above 07-Sep's 809.5 minor corrective high detailed in the hourly chart below.

The important takeaway from this month's lateral, sleepy price action is the definition of Wed's 851.5 low as the end or lower boundary of a suspected 4th-Wave correction.  A failure below 851.5 will confirm a bearish divergence in daily momentum and defer or threaten a bullish count enough to warrant non-bullish decisions like long-covers.  A failure below 851.5 will not necessarily negate a broader bullish count, but it will threaten it enough to warrant defensive measures as the next pertinent technical levels below 851.5 are 13-Sep's prospective minor 1st-Wave high at 813.8 and obviously 08-Sep's 766.0 low.  And making non-bullish decisions "down there" is sub-optimal to say the least.  Per such, both short- and longer-term commercial traders are advised to pare or neutralize bullish exposure on a failure below 851.5, acknowledging and accepting whipsaw risk- back above 04-Oct's 891.0 high- in exchange for much deeper and sub-optimal nominal risk below 766.0.

On a broader scale, the daily log scale chart above shows the developing potential for a bearish divergence in daily momentum that will be considered confirmed below 851.5.  This chart also shows the past month's recovery thus far stalling in the immediate neighborhood of the (888.0) Fibonacci minimum 38.2% retrace of Apr-Sep's entire 1128 - 766 decline).  COMBINED with a failure below 851.5, traders would then need to be concerned with at least a larger-degree correction pf the past month's rally and possibly a resumption of Apr-Sep's major downtrend.

Until and unless the market fails below 851.5 however, we would remind longer-term players of the key elements on which our bullish count is predicated:

  • a confirmed bullish divergence in WEEKLY momentum (below) amidst
  • an historically low 11% reading in out RJO Bullish Sentiment Index and
  • a textbook complete and major 5-wave Elliott sequence down from 29-Apr's 1128 high to 08-Sep's 766.0 low.

Thus far, the market is only a month into correcting a 4-MONTH, 32% drawdown, so further and possibly protracted gains remain well within the bounds of a major (suspected 2nd-Wave) correction of Apr-Sep's decline within an even more massive PEAK/reversal process from 17-May's 1219 high on an active continuation basis below.

These issues considered, a bullish policy and exposure remain advised with a failure below 851.5 required to defer or threaten this call enough to warrant moving to a neutral/sideline position.  In lieu of such weakness, we anticipate a continuation of the past month's rally to new highs and potentially significant gains above 891.0.

Agricultural - Grain Futures Update w/Stephen Davis - 08/21/2020
Stephen Davis discusses this week's news in the grain markets, including where we are heading with China
Equity - Stocks Trading Lower After Record Week

The S&P 500 made an all-time high this week trading higher than the previous mark set in February. The Nasdaq Composite also hit a record high on Thursday led by a rally in Big Tech stocks.  Amazon and Alphabet gained more than 4% this week, Microsoft nearly 3% and Apple became the first publicly traded company to reach $2 trillion in market valuation.  These tech gains have offset some disappointing unemployment data this week.  As lawmakers still struggle to agree on a new coronavirus stimulus bill the U.S. weekly jobless claims came in higher than expected after the additional unemployment benefits had expired.  The Labor Department reported 1.16 million claims last week vs an expectation of 923,000.  Last week this number was under the 1 million mark for the first time since March.

Support is checking in today at 336300 and 333200 and resistance at 340800 and 342000.

E-mini S&P 500 Sep '20 Daily Chart
If you have any questions or would like to discuss the markets further, please feel free to contact me at 888-861-1656 or jyasak@rjofutures.com.
Economy - S-T Mo Failure Insufficient to End RBOB Correction, But Beware

Posted on Nov 08, 2022, 07:51 by Dave Toth

In Fri's Technical Webcast we identified a minor corrective low at 2.6328 from Thur as a mini risk parameter the market needed to sustain gains above to maintain a more immediate bullish count.  The 240-min chart below shows the market's failure overnight below this level, confirming a bearish divergence in very short-term momentum.  This mo failure defines Fri's 2.8172 high as one of developing importance and a parameter from which very short-term traders can objectively base non-bullish decisions like long-covers.

Given the magnitude of the past three weeks' broader recovery however, this short-term momentum failure is of an insufficient scale to conclude anything more than another correction within this broader recovery from 26-Sep's 2.1877 low.  Indeed, overnights failure below 2.6328 only allows us to conclude the end of the portion of the month-and-a-half rally from 31-Oct's 2.4822 next larger-degree corrective low.  2.4822 is the risk parameter this market still needs to fail below to break the uptrend from 18-Oct's 2.3526 low while this 2.3526 low remains intact as the risk parameter this market needs to fail below to break the month-and-a-half uptrend.  From an intermediate-to-longer-term perspective, this week's setback falls well within the bounds of another correction ahead of further gains.  This is another excellent example of the importance of technical and trading SCALE and understanding and matching directional risk exposure to one's personal risk profile.

The reason overnight's admittedly minor mo failure might have longer-term importance is the 2.8172-area from which it stemmed.  In Fri's Technical Blog we also noted the market's engagement of the 2.8076-to-2.8159-area marked by the 61.8% retrace of Jun0-Sewp's 3.2758 -2.1877 decline and the 1.000 progression of Sep-Oct's initial 2.1877 - 2.6185 (suspected a-Wave) rally from 18-Oct's 2.3526 (suspected b-Wave) low.  We remind longer-term players that because of the unique and compelling confluence of:

  • early-Aug's bearish divergence in WEEKLY momentum amidst
  • historically extreme bullish sentiment/contrary opinion levels in our RJO Bullish Sentiment Index
  • an arguably complete and massive 5-wave Elliott sequence from Mar'20's 0.4605 low to Jun's 4.3260 high (as labeled in the weekly log active-continuation chart below) and
  • the 5-wave impulsive sub-division of Jun-Sep's (suspected initial 1st-Wave) decline

The recovery attempt from 26-Sep's 2.1877 low is arguably only a 3-wave (Wave-2) corrective rebuttal to Jun-Sep's decline within a massive, multi-quarter PEAK/reversal process.  Now granted, due to the magnitude of 2020 -2022's secular bull market, we discussed the prospect for this (2nd-Wave corrective) recovery to be "extensive" in terms of both price and time.  A "more extensive" correction is typified by a retracement of 61.8% or more and spanning weeks or even months following a 3-month decline.  Per such, the (suspected corrective) recovery from 26-Sep's 2.1877 low could easily have further to go, with commensurately larger-degree weakness than that exhibited this week (i.e., a failure below at least 2.4822) required to consider the correction complete.  Indeed, the daily log chart above shows the market thus far respecting former 2.6185-area resistance from 10-Oct as a new support candidate.

These issues considered, very shorter-term traders have been advised to move to a neutral/sideline position following overnight's momentum failure below 2.6328, with a recovery above 2.8172 required to negate this call, reaffirm the recovery and re-expose potentially significant gains thereafter.  For intermediate- and longer-term players, a bullish policy and exposure remain advised with a failure below 2.4822 required to threaten this call enough to warrant neutralizing exposure.  We will be watchful for another bearish divergence in momentum following a recovery attempt that falls short of Fri's 2.8172 high that would be considered the next reinforcing factor to a count calling that 2.8172 high the prospective end to the month-and-a-half 2nd-Wave correction.  In lieu of such, a resumption of the current rally to eventual new highs above 2.8172 should not surprise.

Economy - Futures Forecast w/ John Caruso

Overnight Highlights:

*French PMI misses expectations and decelerates m/m to 49.0 vs 53.7 Forecasted and 52.4 previous

*Eurozone PMI misses expectation decelerating m/m to 51.7 vs 52.9 forecasted and 51.8 previous

Global Equities:

*US Futures indicating a lower open led by the Small Cap Russell 2000 Index -0.88%

*Europe lower across the board, led by Germany -1.08%; France -1.09%; Italy -1.25%; and Spain -1.12%

*Asian Equites largely higher across the board with the Shanghai Index +0.50%

Top Market Movers Overnight

Treasuries/Yields

*Following an attempted break to higher levels from the “hawkish” Fed Minutes release, the 10yr yield has slumped back 10bps to 0.62%

*Treasuries catching a bid on a “risk-off” morning in Global Macro Markets

*OPINION: We’ll continue to trade Treasuries with a “Bullish Bias” until our quant signals suggest otherwise – NOT A BUY RECOMMENDATION FOR TODAY

*Our range analysis suggest covering some treasury exposure today as we’re now immediately triggering “overbought”

US Dollar:

*Gaining some fervor overnight off of the weak European PMI data and a flight to safety bid off of a weaker US Equity Open

*We contend there’s a small window for the dollar to rally, however it shouldn’t get too far.  Upside to 93.90 in our model

*We remain BEARISH OF THE USD

Gold:

*Trading lower overnight, retesting some immediate-term trend support at 1915.00 in our model with downside to potentially 1895.00

*Held back by a stronger USD, and a general “risk-off” outlook headed into the day

*OPINION: Gold is in the “Buy to Accumulate” Zone in and around the 1915-1895 level  

*Gold remains BULLISH trend on all time frames coupled with BULLISH momentum, but momentum appears to be turning “Neutral”*We largely expect a range bound trade between 1874-2010 until bullish fundamentals reassert themselves.

If you have any questions or would like to discuss the markets further, please feel free to contact me at 800-669-5354 or jcaruso@rjofutures.com.

Coming Up Next Week...

View Futures Calendar