Opportunities Exist in the Metals Markets Right Now –
Precious metals like gold and silver seem to be all anybody is talking about these days, and with good reason! Have you ever wanted to get in on these current opportunities in the metals but didn’t know where to start? Our Metals Investor Kit has you covered. Whether you are experienced or new to trading, our kit will give you the tools to take advantage of the opportunities that exist in the metals markets right now!
Experience a trading platform like no other with integrated tools to seamlessly trade and monitor the markets. With a free simulated trading account and personal broker experience, we’ll teach you about futures trading and help you develop a trading strategy.
The Markets
Metals - Gold Needs a Stimulus Deal
Gold Needs a Stimulus Deal
By: Frank J. Cholly, Senior Market StrategistPosted Oct 9, 2020 9:22AM CT
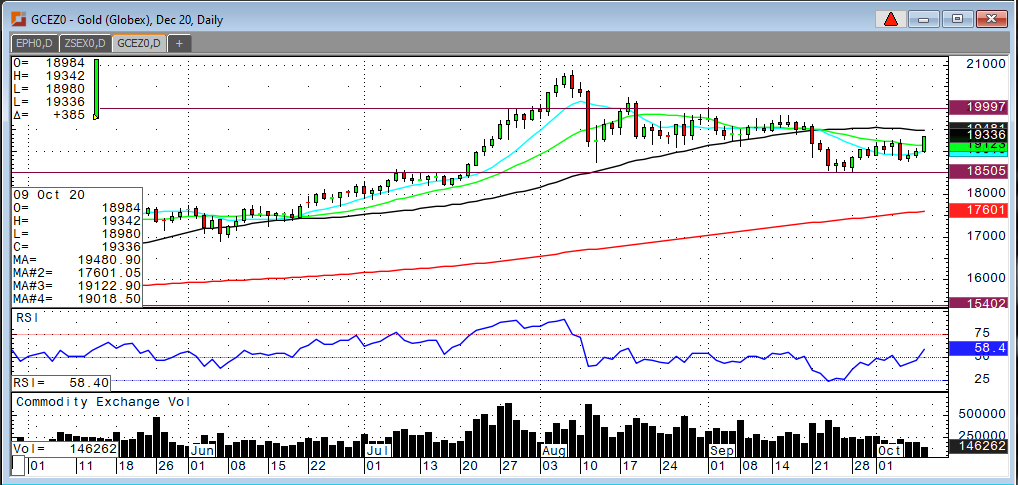
December gold futures have been trending higher the past few days as traders are hopeful that some sort of stimulus deal can be patched together before the election. Even if it’s just some “stand alone” deal. Gold futures sold off hard on Tuesday along with equity futures on a Trump tweet to end talks with Democrats to reach a stimulus deal before the election. Wednesday talks resume and gold begins to climb back above $1,900. At the time of this writing December gold is trading $1,925. The gold bulls need a close at $1,935 or higher. Another stimulus deal is dollar negative and positive for gold and also what equity traders are hoping to see before the election. I’m a bit cynical when it comes to trusting politicians to act in the best interest of the people they represent. However, I do remain bullish on gold. The long-term trend remains firmly intact. I think that the next pop over $1,950 will quickly get us to $2,000. I wouldn’t want to be out of the market as we get closer to the election. I cannot imagine a scenario where we have a clear, undisputable winner on November 3rd. Gold isn’t “looking” for direction. Gold is just waiting for its next explosive rally. The only thing that would surprise me is if gold did not make new all time highs before the end of the year.
Gold Dec '20 Daily Chart If you have any questions or would like to discuss the markets further, please feel free to contact me at 800-826-4124 or fcholly@rjofutures.com. Energy - Oil Set For Weekly Surge Amid Output Losses
Oil Set For Weekly Surge Amid Output Losses
By: Alex Turro, Senior Market StrategistPosted Oct 9, 2020 9:34AM CT
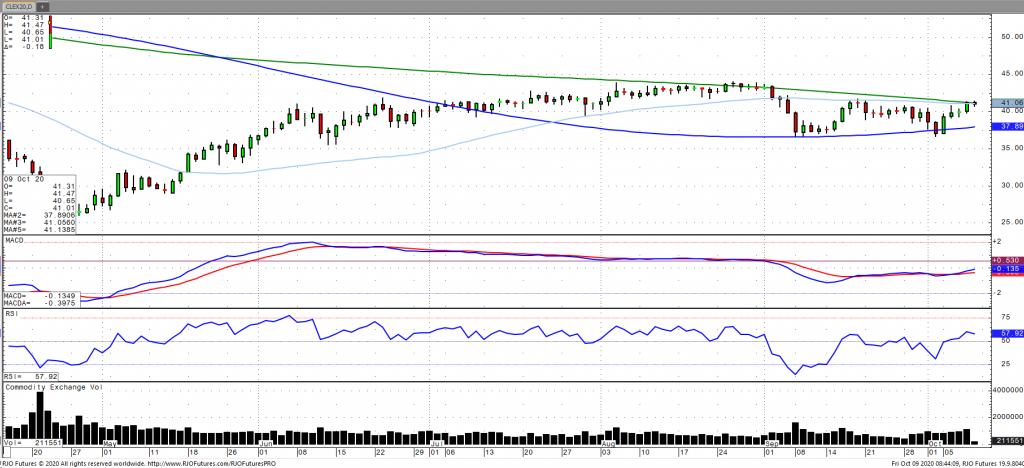
Oil prices have lost some of their momentum in the early session but are poised to end the week on a five-week high amidst support from output shutdowns in the Gulf as well as the prospect of supply losses in Norway due to a labor strike. Norway’s production is expected to take a 25% cut resulting in the loss of nearly 1 million barrels per day. These production losses helped in part to ease ongoing concerns regarding demand as well increased corona cases. This comes as OPEC on Thursday stated at its annual World Oil Outlook that it had downwardly revised its demand prospects for global growth over the long term, suggesting that demand will plateau into the late 2030s. Weekly inventories did little in providing support as inventories had a slight increase as expected. Remain cautious on the volatility of oil (OVX), which could ramp up to the 50s in the near term. Oil prices have been teetering around the bull/bear line, which comes in around 41.90 but remains bearish trend with today’s range seen between 37.40 – 41.76.
Crude Oil Nov '20 Daily Chart If you have any questions or would like to discuss the markets further, please feel free to contact me at 800-438-4805 or aturro@rjofutures.com. Softs - Coffee Taking a Breather
Coffee Taking a Breather
By: Adam TuiaanaPosted 10/07/2020
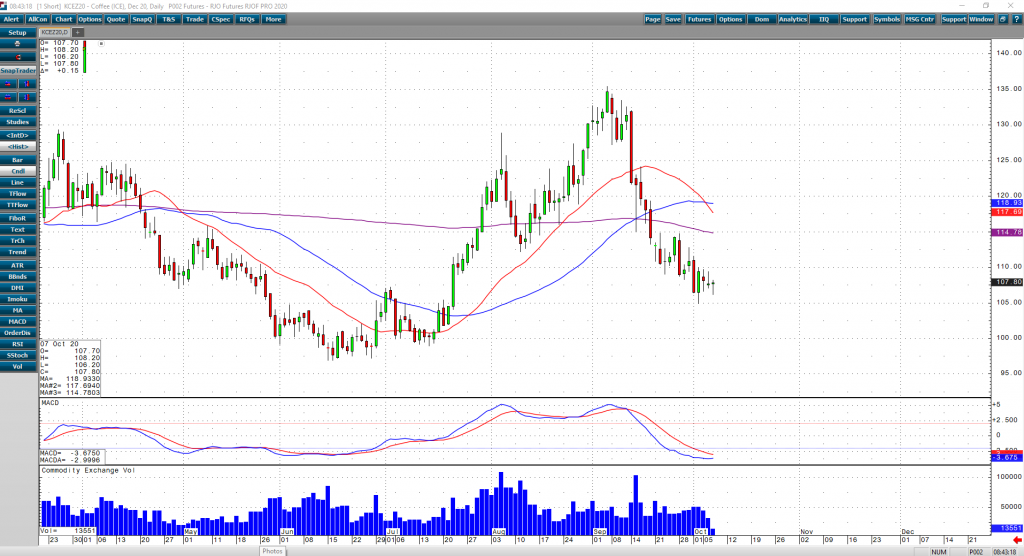
December coffee prices are targeting key support
levels on slowly growing demand. The 100 level in December coffee hasn’t been
tested since mid-July of this year, and since the promise of more and more
States ramping up occupancy levels in restaurants and coffee shops grows, a stimulus
package is still required to inject stronger demand levels across all
commodities. While the stimulus negotiation debacle continues, we can expect
that demand levels will not return in the near term and coffee prices should be
comfortable below 110.
From a technical perspective, a recent (and aggressive) dive below the 200-day MA (resting at around the 119 level) is bearish, and likely will see follow through selling to the key support area of 100. We also can also make notice a consolidated bear pennant which if fulfilled (as a continuation pattern), could push December coffee prices to at or about the 100 level. I would expect a continued selloff at this time. There are several strategies that traders can apply in this situation. Call or email for specific strategies.
On
the heels of mid-Sep-to-early-Oct's steeper, accelerated, 3rd-wave-looking
recovery, the past week-and-a-half's boringly lateral chop is first considered
a corrective/consolidative event that warns of a continuation of the uptrend
that preceded it to new highs above 04-Oct's 891.0 high. This count
remains consistent with our broader base/correction/recovery count introduced
in 13-Sep's Technical Blog following that
day's bullish divergence in short-term momentum above 07-Sep's 809.5 minor
corrective high detailed in the hourly chart below.
The
important takeaway from this month's lateral, sleepy price action is the
definition of Wed's 851.5 low as
the end or lower boundary of a suspected 4th-Wave correction. A failure
below 851.5 will confirm a bearish divergence in daily momentum and defer or
threaten a bullish count enough to warrant non-bullish decisions like
long-covers. A failure below 851.5 will not
necessarily negate a broader bullish count, but it will threaten it enough to
warrant defensive measures as the next pertinent technical levels below 851.5 are
13-Sep's prospective minor 1st-Wave high at 813.8 and obviously 08-Sep's 766.0
low. And making non-bullish decisions "down there" is
sub-optimal to say the least. Per such, both short- and longer-term
commercial traders are advised to pare or neutralize bullish exposure on a
failure below 851.5, acknowledging and accepting whipsaw risk- back above 04-Oct's
891.0 high- in exchange for much deeper and sub-optimal nominal risk below
766.0.
On
a broader scale, the daily log scale chart above shows the developing potential
for a bearish divergence in daily momentum that will be considered confirmed
below 851.5. This chart also shows the past month's recovery thus far
stalling in the immediate neighborhood of the (888.0) Fibonacci
minimum 38.2% retrace of Apr-Sep's entire 1128 - 766 decline). COMBINED
with a failure below 851.5, traders
would then need to be concerned with at least a larger-degree correction pf the
past month's rally and possibly a resumption of Apr-Sep's major downtrend.
Until
and unless the market fails below 851.5 however, we would
remind longer-term players of the key elements on which our bullish count is
predicated:
a confirmed bullish divergence in WEEKLY momentum
(below)
amidst
an
historically low 11% reading in out RJO Bullish Sentiment Index and
a
textbook complete and major 5-wave Elliott sequence down from 29-Apr's
1128 high to 08-Sep's 766.0 low.
Thus
far, the market is only a month into correcting a 4-MONTH, 32% drawdown, so
further and possibly protracted gains remain well within the bounds of a major
(suspected 2nd-Wave) correction of Apr-Sep's decline within an even more
massive PEAK/reversal process from 17-May's 1219 high on an active continuation
basis below.
These
issues considered, a bullish policy and exposure remain advised with a failure
below 851.5 required to defer or threaten this call enough to warrant moving to
a neutral/sideline position. In lieu of such weakness, we anticipate a
continuation of the past month's rally to new highs and potentially significant
gains above 891.0.
Agricultural - Grain Futures Update w/Stephen Davis - 10/09/2020
Grain Futures Update w/Stephen Davis - 10/09/2020
By: Stephen DavisPosted 10/09/2020
Stephen Davis discusses the latest news in grain markets ahead of this morning crop reports. Interestingly enough, grains are up early this morning which is unusual before a big report.Currency - Dollar Contingent on Jobs Report
Dollar Contingent on Jobs Report
By: Tony Cholly, Senior Market StrategistPosted Oct 8, 2020 9:32AM CT
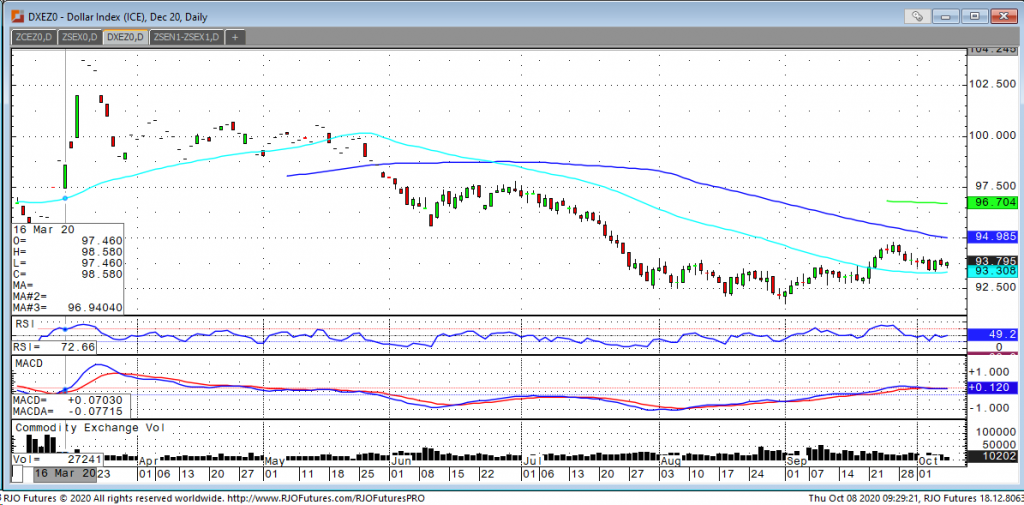
I suspect the dollar will generally track within a tight range today from 94.25 down to 93.56 as the currency markets wait for the overall results of a series of key fundamental issues. The most likely fundamental issue to present a key outcome this morning is the latest report on US jobs with a modest improvement likely to press the dollar down toward the bottom of the range. Although, seeing the passing of an airline bailout package could apply additional pressure, but without real stimulus, on top of positive claims, the trade will probably be unwilling to extend the October slide we have experienced. Momentum studies trending lower should accelerate a move lower if support levels are taken out. The next downside target is now at 93.37. The next level of resistance is around 93.80 and 94.10, while 1st support hits at 93.50 and 93.37.
USD Dec '20 Daily Chart If you have any questions or would like to discuss the markets further, please feel free to contact me at 800-826-2270 or tcholly@rjofutures.com. Interest Rates - Treasuries All Over the Place On Mixed Stimulus Package News
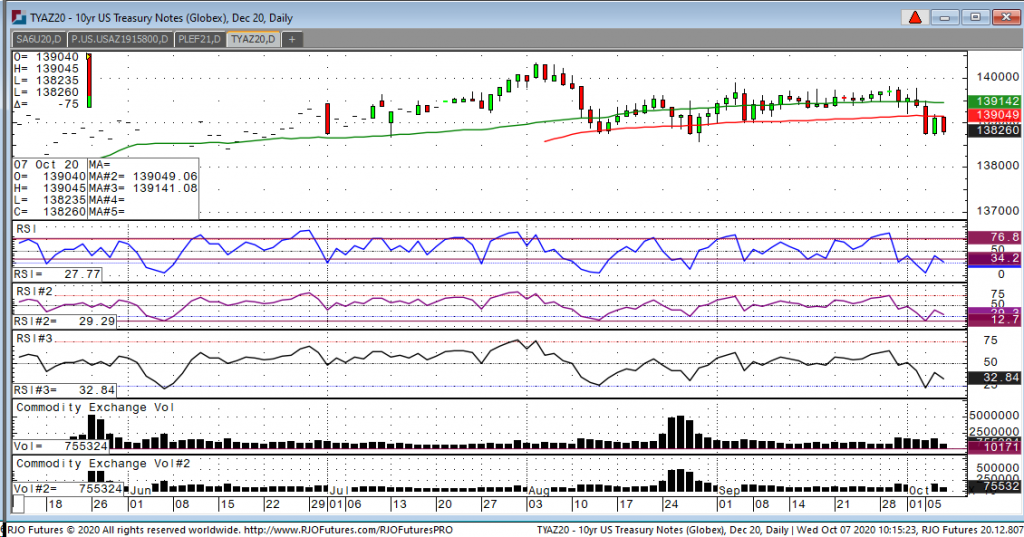
Treasuries All Over the Place On Mixed Stimulus Package News
Looking at the 10-year chart, we have had almost a ¾ move this week with a high of 13914.5 and a low of 138-23. The trade is solely focused on stimulus talks. Yesterday afternoon, Trump tweeted that all talks would stop between parties because they cannot agree on a fiscal stimulus plan and they should hold off until after the election. That sent stocks sharply lower and treasuries higher. Last night, Trump changed course and let’s try to get things done asap and he is now focused on trying to get a deal done in pieces. So, today we see another reversal where stocks are sharply and treasuries lower but off the lows currently trading at 138-27. It’s going to be a difficult trade because moves are literally being made on tweets. Tonight, we have the Vice-Presidential debate so traders should expect some volatility. I do believe we will see progress being made with many people still out of a job, needing money to pay bills, and to put food on the table for their families. But, there is so much hostility between both parties right now, one has to wonder if Pelosi would rather wait till after the election, so Trump doesn’t get credit for passing the bill. It puts many Americans on hold which is unfortunate because Washington should be working for the people not looking out for their parties.
10-Year Note Dec '20 Daily Chart If you have any questions or would like to discuss the markets further, please feel free to contact me at 800-826-2270 or gperlin@rjofutures.com. Equity - Stocks Higher to Kick Things Off
Stocks Higher to Kick Things Off
By: Bill Dixon, Senior Market StrategistPosted Oct 9, 2020 9:38AM CT
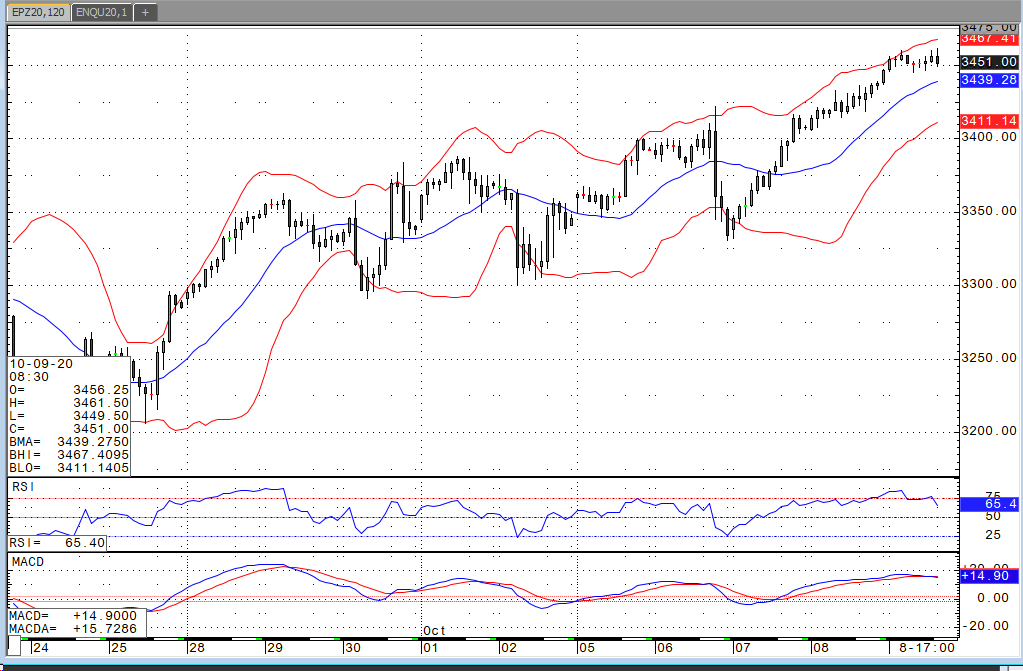
Renewed stimulus hopes have the dollar trading lower and stocks higher this morning. We’re now two months past the August deadline for a deal, so I’m not holding my breath that they’ll get something done in short order. However, the fact that talks have been ongoing is encouraging. We’re coming down the home stretch to the election, and politics are heavily at play. Everything seems to be a matter of how things are polling for each side at the moment, but I think both sides would benefit from a deal of some sort. During Wednesday’s release of the Fed minutes, Jerome Powell suggested that more stimulus would be needed in order to support a continued recovery. Regardless of when something happens, the market seems to be pricing in something getting done in the near future. Whether that is before or after the election remains to be seen, but I think it is safe to suggest that regardless of who wins, money will be flowing shortly after the election results at the latest.
E-mini S&P 500 Dec '20 Daily Chart If you have any questions or would like to discuss the markets further, please feel free to contact me at 800-669-5354 or bdixon@rjofutures.com. Economy - S-T Mo Failure Insufficient to End RBOB Correction, But Beware
S-T Mo Failure Insufficient to End RBOB Correction, But Beware
By: RJO Market InsightsPosted 11/08/2022
Posted on Nov 08, 2022, 07:51 by Dave Toth
In Fri's Technical Webcast we identified a
minor corrective low at 2.6328 from Thur as a mini risk parameter the market
needed to sustain gains above to maintain a more immediate bullish count.
The 240-min chart below shows the market's failure overnight below this level,
confirming a bearish divergence in very short-term momentum. This mo
failure defines Fri's 2.8172 high as
one of developing importance and a parameter from which very short-term traders
can objectively base non-bullish decisions like long-covers.
Given
the magnitude of the past three weeks' broader recovery however, this
short-term momentum failure is of an insufficient scale to conclude anything
more than another correction within this broader recovery from 26-Sep's 2.1877
low. Indeed, overnights failure below 2.6328 only allows us to conclude
the end of the portion of the month-and-a-half rally from 31-Oct's 2.4822 next
larger-degree corrective low. 2.4822 is the
risk parameter this market still needs to fail below to break the uptrend from
18-Oct's 2.3526 low while this 2.3526 low
remains intact as the risk parameter this market needs to fail below to break
the month-and-a-half uptrend. From an
intermediate-to-longer-term perspective, this week's setback falls well within
the bounds of another correction ahead of further gains. This is another
excellent example of the importance of technical and trading SCALE and
understanding and matching directional risk exposure to one's personal risk
profile.
The
reason overnight's admittedly minor mo failure might have longer-term
importance is the 2.8172-area from which it stemmed. In
Fri's Technical Blog we also noted the market's engagement of the
2.8076-to-2.8159-area marked by the 61.8% retrace of Jun0-Sewp's 3.2758 -2.1877
decline and the 1.000 progression of Sep-Oct's initial 2.1877 - 2.6185
(suspected a-Wave) rally from 18-Oct's 2.3526 (suspected b-Wave) low. We
remind longer-term players that because of the unique and compelling confluence
of:
early-Aug's bearish divergence in WEEKLY momentum
amidst
historically
extreme bullish sentiment/contrary opinion levels in our RJO Bullish
Sentiment Index
an
arguably complete and massive 5-wave Elliott sequence from Mar'20's 0.4605
low to Jun's 4.3260 high (as labeled in the weekly log active-continuation
chart below) and
the
5-wave impulsive sub-division of Jun-Sep's (suspected initial 1st-Wave) decline
The
recovery attempt from 26-Sep's 2.1877 low is arguably only a 3-wave (Wave-2)
corrective rebuttal to Jun-Sep's decline within a massive, multi-quarter
PEAK/reversal process. Now granted, due to the magnitude of 2020 -2022's
secular bull market, we discussed the prospect for this (2nd-Wave corrective)
recovery to be "extensive" in terms of both price and time. A
"more extensive" correction is typified by a retracement of 61.8% or
more and spanning weeks or even months following a 3-month decline. Per
such, the (suspected corrective) recovery from 26-Sep's 2.1877 low could easily
have further to go, with commensurately larger-degree weakness than that
exhibited this week (i.e., a failure below at least 2.4822) required
to consider the correction complete. Indeed, the daily log chart above
shows the market thus far respecting former 2.6185-area resistance from 10-Oct
as a new support candidate.
These
issues considered, very shorter-term traders have been advised to move to a neutral/sideline
position following overnight's momentum failure below 2.6328, with a recovery
above 2.8172 required to negate this call, reaffirm the recovery and re-expose
potentially significant gains thereafter. For intermediate- and
longer-term players, a bullish policy and exposure remain advised with a
failure below 2.4822 required to threaten this call enough to warrant
neutralizing exposure. We will be watchful for another bearish divergence
in momentum following a recovery attempt that falls short of Fri's 2.8172 high
that would be considered the next reinforcing factor to a count calling that
2.8172 high the prospective end to the month-and-a-half 2nd-Wave
correction. In lieu of such, a resumption of the current rally to
eventual new highs above 2.8172 should not surprise.