It’s time to turn the page to a new year! Receive $5-A-Side commissions for 60-days when you open a Broker-Assisted account anytime during January and February!
New: E-mini S&P 500 Investor Kit
Historically, the E-mini S&P 500 is one of the most popular and widely traded futures contracts around the world. The reason behind its popularity lies within the leverage it affords the trader, and when you couple that with its accessibility and ease to trade it makes the contract viable to virtually any trader. The S&P 500 hits new highs seemingly every day and now is the perfect time to add it to your portfolio. Complete with actionable trading strategies our E-mini S&P 500 Investor kit is here to help all traders, regardless of experience!
The Markets
Metals - Gold Continues to Consolidate
Gold Continues to Consolidate
By: Frank J. Cholly, Senior Market StrategistPosted Jan 22, 2021 9:02AM CT
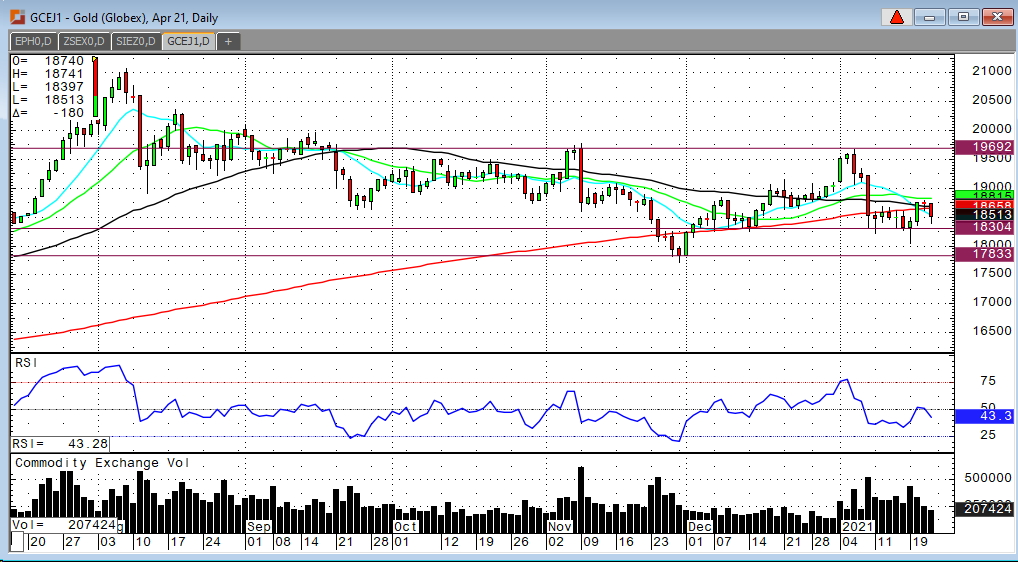
Gold futures continue to consolidate, but for how long? Clearly, we begin today with risk off. We are still facing significant risk of additional global economic slowdown. All physical commodities start the day trading lower. Gold is not, at least currently, catching any safe-haven support. For now, gold is trading against a Dollar bounce.
While I remain long term bullish on gold, I am beginning to see signs on the chart that would indicate a tendency to move closer to $1,800 and possibly test $1,775. Look for support in the $1,830 range to continue to hold. If that area fails to find support, then expect a test of $1,800 to $1,775 range. Watch for the 50 DMA to cross below the 200 DMA. “The Death Cross.” That will be a strong sell signal!
Gold Apr '21 Daily Chart If you have any questions or would like to discuss the markets further, please feel free to contact me at 800-826-4124 or fcholly@rjofutures.com. Metals - Silver in Holding Pattern
March silver started the last day of the week trading lower after trading up from Tuesday’s low of 24.04 to a high for the week of 26.13 yesterday. Despite the stock market being lower, the risk off aspect hasn’t translated into the silver market yet. Talks of the virus worsening and causing more shutdowns around the world are pressuring the metals markets. Despite the US dollar showing weakness this week, trading down from Monday’s high of 90.94, the bulls couldn’t get a rally extended to the recent highs from earlier this month. Bulls are wanting to see a steady reduction in virus numbers continue as an opening of the economy would increase demand and e much more likely to kickstart inflation, driving the price higher. If there is an uptick in the virus numbers and restraints remain on the economy more pressure on the metals markets is expected. Also, a bearish close to end the week would suggest follow through selling to start next week. Resistance for the March contract comes in at 26.13 and a close above this level would need to re establish the trend higher and make a move up to the 27.50 level. March silver will need to hold $25 or a move down to 24.40 could be seen.
If you have any questions or would like to discuss the markets further, please feel free to contact me at 800-826-2270 or therrmann@rjofutures.com. Energy - Oil Corrects as Demand Recovery in Focus
Oil Corrects as Demand Recovery in Focus
By: Alex Turro, Senior Market StrategistPosted Jan 22, 2021 9:25AM CT
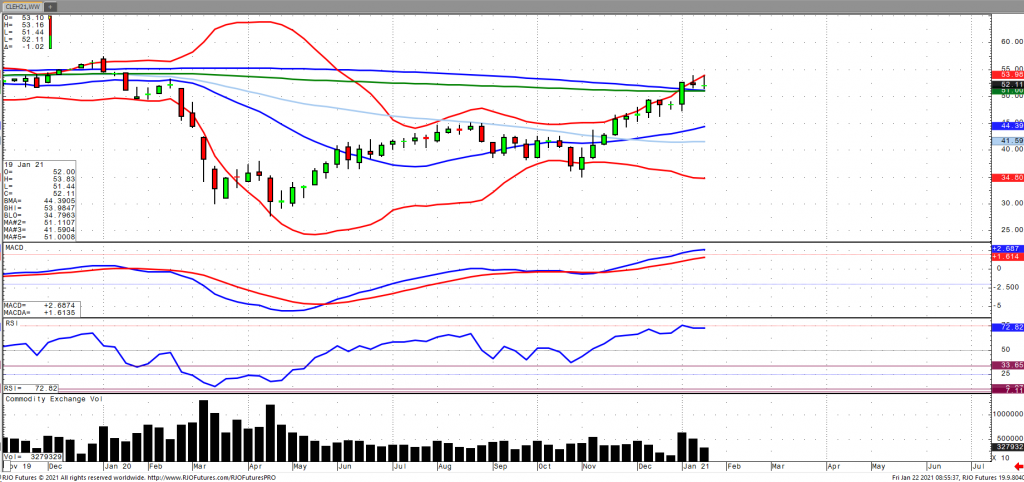
Oil prices are under pressure and have continued to correct from 11-month highs set earlier in the week as reports of renewed restrictions in China ahead of the Lunar holiday have dampened the optimism surrounding the recovery in fuel demand. In addition, a record jump in Iranian exports despite US sanctions as well as softer demand from Indian have weighed on the market. This was coupled with a surprise build in EIA oil stocks. The market remains bullish trend with today’s range seen between 51.26 – 53.90.
Crude Oil Mar '21 Daily Chart If you have any questions or would like to discuss the markets further, please feel free to contact me at 800-438-4805 or aturro@rjofutures.com. Softs - Coffee Bulls on a Run
Coffee Bulls on a Run
By: Adam TuiaanaPosted 01/20/2021
As we await the inauguration of President-Elect Joe Biden, the
markets have been quite friendly as the promise of continued influx of cash
should prompt more buying of commodities and equities. The efforts initiated by
the Trump Administration to distribute vaccines across the world at unprecedented
speeds, coupled with whopping stimulus measures have created optimism through
the promise of a slow but sure to return level of normalcy. How the Biden
Administration accelerates or slows this moving train remains to be seen. The
new administration promises increased corporate tax hikes, weighed against
increased infrastructure spending, all while the impending shadow of massive
inflationary fears looms imminent.
Brazilian coffee exports for 2020 were at a record high, and this
should help the March Coffee futures gain continued ground and attract more
bullish activity. A clear and decisive hold above the
50-day moving average (located at the 120.00 level) and subsequent rally and
break above the 129.50 resistance level should signal a retest of the 135 level over the next few weeks.
For more frequent commentary, please check out and subscribe to my daily futures market videos on coffee and other commodities.
On
the heels of mid-Sep-to-early-Oct's steeper, accelerated, 3rd-wave-looking
recovery, the past week-and-a-half's boringly lateral chop is first considered
a corrective/consolidative event that warns of a continuation of the uptrend
that preceded it to new highs above 04-Oct's 891.0 high. This count
remains consistent with our broader base/correction/recovery count introduced
in 13-Sep's Technical Blog following that
day's bullish divergence in short-term momentum above 07-Sep's 809.5 minor
corrective high detailed in the hourly chart below.
The
important takeaway from this month's lateral, sleepy price action is the
definition of Wed's 851.5 low as
the end or lower boundary of a suspected 4th-Wave correction. A failure
below 851.5 will confirm a bearish divergence in daily momentum and defer or
threaten a bullish count enough to warrant non-bullish decisions like
long-covers. A failure below 851.5 will not
necessarily negate a broader bullish count, but it will threaten it enough to
warrant defensive measures as the next pertinent technical levels below 851.5 are
13-Sep's prospective minor 1st-Wave high at 813.8 and obviously 08-Sep's 766.0
low. And making non-bullish decisions "down there" is
sub-optimal to say the least. Per such, both short- and longer-term
commercial traders are advised to pare or neutralize bullish exposure on a
failure below 851.5, acknowledging and accepting whipsaw risk- back above 04-Oct's
891.0 high- in exchange for much deeper and sub-optimal nominal risk below
766.0.
On
a broader scale, the daily log scale chart above shows the developing potential
for a bearish divergence in daily momentum that will be considered confirmed
below 851.5. This chart also shows the past month's recovery thus far
stalling in the immediate neighborhood of the (888.0) Fibonacci
minimum 38.2% retrace of Apr-Sep's entire 1128 - 766 decline). COMBINED
with a failure below 851.5, traders
would then need to be concerned with at least a larger-degree correction pf the
past month's rally and possibly a resumption of Apr-Sep's major downtrend.
Until
and unless the market fails below 851.5 however, we would
remind longer-term players of the key elements on which our bullish count is
predicated:
a confirmed bullish divergence in WEEKLY momentum
(below)
amidst
an
historically low 11% reading in out RJO Bullish Sentiment Index and
a
textbook complete and major 5-wave Elliott sequence down from 29-Apr's
1128 high to 08-Sep's 766.0 low.
Thus
far, the market is only a month into correcting a 4-MONTH, 32% drawdown, so
further and possibly protracted gains remain well within the bounds of a major
(suspected 2nd-Wave) correction of Apr-Sep's decline within an even more
massive PEAK/reversal process from 17-May's 1219 high on an active continuation
basis below.
These
issues considered, a bullish policy and exposure remain advised with a failure
below 851.5 required to defer or threaten this call enough to warrant moving to
a neutral/sideline position. In lieu of such weakness, we anticipate a
continuation of the past month's rally to new highs and potentially significant
gains above 891.0.
Agricultural - Grain Futures Update w/Stephen Davis - 01/22/2021
Grain Futures Update w/Stephen Davis - 01/22/2021
By: Stephen DavisPosted 01/22/2021
Stephen Davis discusses the latest news moving the grain markets. Currently we are in the midst of a downturn as grains have been down the last couple days.Interest Rates - Interest Rates Impacted by Looming Stimulus
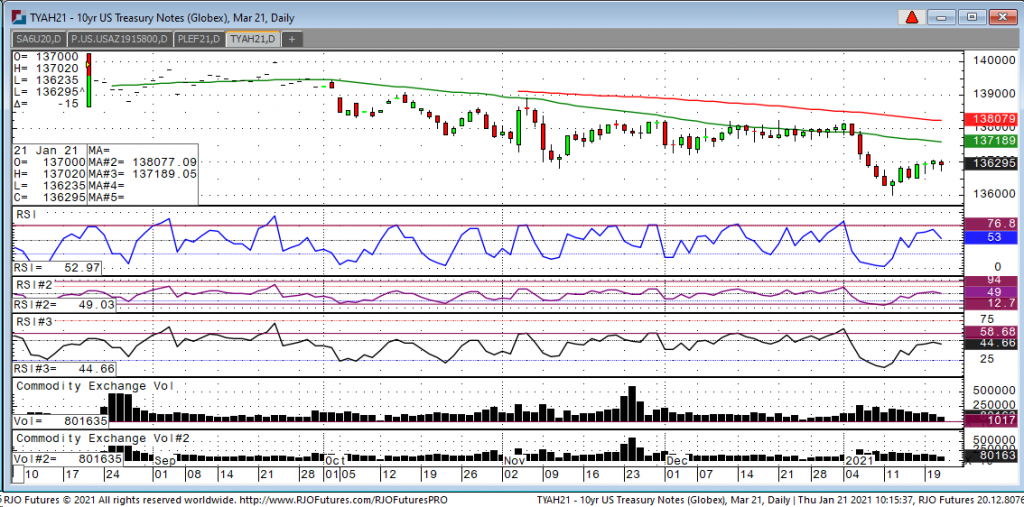
Looking at the March 10-year overnight we had a high of 137.02 and a low of 136-23 and the market is currently trading 136-29 down two ticks. The trade the last few days has been quiet as earnings season has started and many are awaiting to see how companies performed last quarter amid the pandemic. The notes in general have been trending down in recent weeks as traders have noted that Biden is looking at a massive stimulus bill that should be presented in the not too distant future. That is looked at as being negative as the money being sent out to people should encourage spending and hopefully will also put some money in consumers pocket that have been unemployed due to the pandemic. If you look at many of the outside markets, one can say inflation has already arrived which will be negative for the interest rate markets. Many of the grain markets have been making new contract highs recently, particularly soybeans and corn. So, as these markets continue to act bullish, which is often viewed as inflationary, one should expect the notes to remain on the defensive. Looking at technicals, I see good resistance in the March 10 year at 137-10-13 area and would look to sell rallies if those the levels are hit.
10-Year Note Mar '21 Daily Chart If you have any questions or would like to discuss the markets further, please feel free to contact me at 800-826-2270 or gperlin@rjofutures.com. Equity - Overnight Equities Dip Being Bought
Overnight Equities Dip Being Bought
By: Bill Dixon, Senior Market StrategistPosted Jan 22, 2021 9:53AM CT
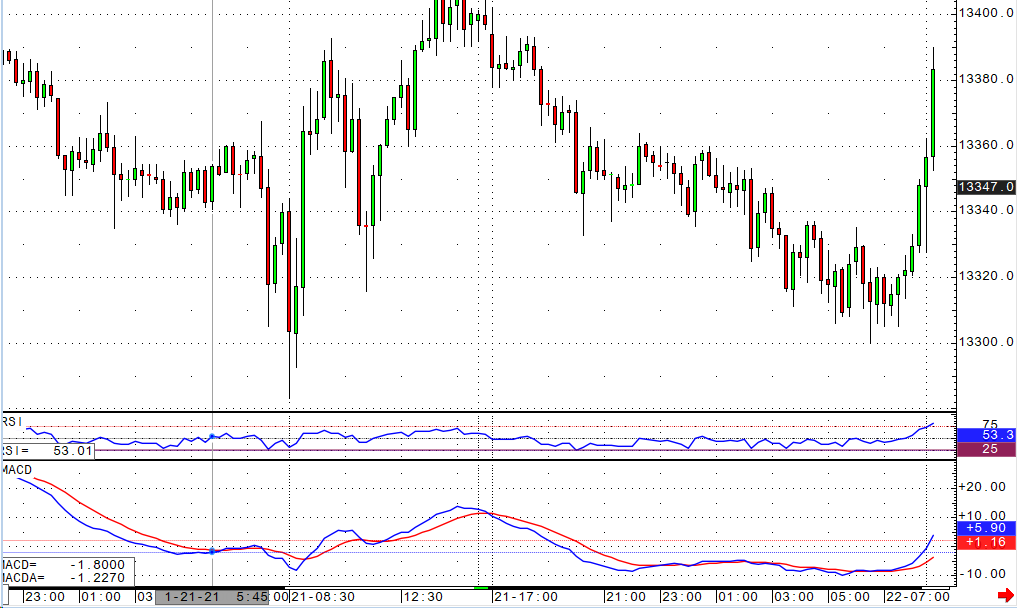
Overnight weakness in global equity markets crept into our own in the early going. While the Dow and Russell have seen somewhat minor corrections from their lows, the Nasdaq and mini S&P have retraced more than half of their losses. In addition to weakness elsewhere, investors seem to be losing faith in a swift passing of a stimulus bill. Right now, the focus seems to be on once again impeaching Donald Trump. We also need to consider the possibility of further lockdowns if President Biden’s mask mandate does not see the intended results. That said, I’m not sure the market takes those fundamental factors all that seriously. The market and all its participants know that money will be spent. Janet Yellen has said as much. We’ll see what kind of legs this selloff has, but dip buyers continue to be active.
E-mini S&P 500 Daily Chart
If you have any questions or would like to discuss the markets further, please feel free to contact me at 800-669-5354 or bdixon@rjofutures.com. Economy - S-T Mo Failure Insufficient to End RBOB Correction, But Beware
S-T Mo Failure Insufficient to End RBOB Correction, But Beware
By: RJO Market InsightsPosted 11/08/2022
Posted on Nov 08, 2022, 07:51 by Dave Toth
In Fri's Technical Webcast we identified a
minor corrective low at 2.6328 from Thur as a mini risk parameter the market
needed to sustain gains above to maintain a more immediate bullish count.
The 240-min chart below shows the market's failure overnight below this level,
confirming a bearish divergence in very short-term momentum. This mo
failure defines Fri's 2.8172 high as
one of developing importance and a parameter from which very short-term traders
can objectively base non-bullish decisions like long-covers.
Given
the magnitude of the past three weeks' broader recovery however, this
short-term momentum failure is of an insufficient scale to conclude anything
more than another correction within this broader recovery from 26-Sep's 2.1877
low. Indeed, overnights failure below 2.6328 only allows us to conclude
the end of the portion of the month-and-a-half rally from 31-Oct's 2.4822 next
larger-degree corrective low. 2.4822 is the
risk parameter this market still needs to fail below to break the uptrend from
18-Oct's 2.3526 low while this 2.3526 low
remains intact as the risk parameter this market needs to fail below to break
the month-and-a-half uptrend. From an
intermediate-to-longer-term perspective, this week's setback falls well within
the bounds of another correction ahead of further gains. This is another
excellent example of the importance of technical and trading SCALE and
understanding and matching directional risk exposure to one's personal risk
profile.
The
reason overnight's admittedly minor mo failure might have longer-term
importance is the 2.8172-area from which it stemmed. In
Fri's Technical Blog we also noted the market's engagement of the
2.8076-to-2.8159-area marked by the 61.8% retrace of Jun0-Sewp's 3.2758 -2.1877
decline and the 1.000 progression of Sep-Oct's initial 2.1877 - 2.6185
(suspected a-Wave) rally from 18-Oct's 2.3526 (suspected b-Wave) low. We
remind longer-term players that because of the unique and compelling confluence
of:
early-Aug's bearish divergence in WEEKLY momentum
amidst
historically
extreme bullish sentiment/contrary opinion levels in our RJO Bullish
Sentiment Index
an
arguably complete and massive 5-wave Elliott sequence from Mar'20's 0.4605
low to Jun's 4.3260 high (as labeled in the weekly log active-continuation
chart below) and
the
5-wave impulsive sub-division of Jun-Sep's (suspected initial 1st-Wave) decline
The
recovery attempt from 26-Sep's 2.1877 low is arguably only a 3-wave (Wave-2)
corrective rebuttal to Jun-Sep's decline within a massive, multi-quarter
PEAK/reversal process. Now granted, due to the magnitude of 2020 -2022's
secular bull market, we discussed the prospect for this (2nd-Wave corrective)
recovery to be "extensive" in terms of both price and time. A
"more extensive" correction is typified by a retracement of 61.8% or
more and spanning weeks or even months following a 3-month decline. Per
such, the (suspected corrective) recovery from 26-Sep's 2.1877 low could easily
have further to go, with commensurately larger-degree weakness than that
exhibited this week (i.e., a failure below at least 2.4822) required
to consider the correction complete. Indeed, the daily log chart above
shows the market thus far respecting former 2.6185-area resistance from 10-Oct
as a new support candidate.
These
issues considered, very shorter-term traders have been advised to move to a neutral/sideline
position following overnight's momentum failure below 2.6328, with a recovery
above 2.8172 required to negate this call, reaffirm the recovery and re-expose
potentially significant gains thereafter. For intermediate- and
longer-term players, a bullish policy and exposure remain advised with a
failure below 2.4822 required to threaten this call enough to warrant
neutralizing exposure. We will be watchful for another bearish divergence
in momentum following a recovery attempt that falls short of Fri's 2.8172 high
that would be considered the next reinforcing factor to a count calling that
2.8172 high the prospective end to the month-and-a-half 2nd-Wave
correction. In lieu of such, a resumption of the current rally to
eventual new highs above 2.8172 should not surprise.