It’s time to turn the page to a new year! Receive $5-A-Side commissions for 60-days when you open a Broker-Assisted account anytime during January and February!
New: E-mini S&P 500 Investor Kit
Historically, the E-mini S&P 500 is one of the most popular and widely traded futures contracts around the world. The reason behind its popularity lies within the leverage it affords the trader, and when you couple that with its accessibility and ease to trade it makes the contract viable to virtually any trader. The S&P 500 hits new highs seemingly every day and now is the perfect time to add it to your portfolio. Complete with actionable trading strategies our E-mini S&P 500 Investor kit is here to help all traders, regardless of experience!
The Markets
Metals - Is $1750 in the Cards for Gold?
Is $1750 in the Cards for Gold?
By: Frank J. Cholly, Senior Market StrategistPosted Feb 5, 2021 8:38AM CT
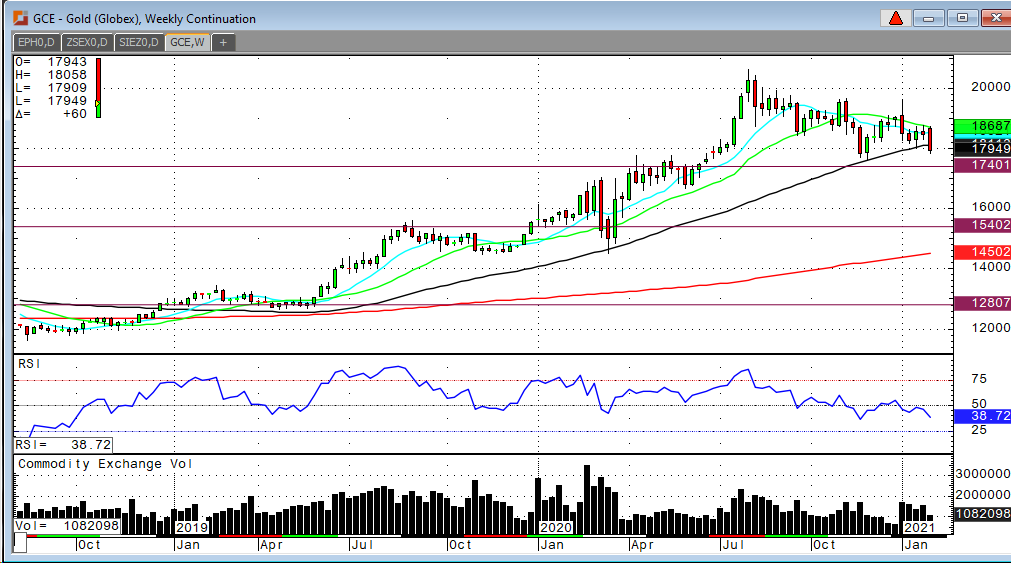
It looks likely at this point. Saying so isn’t such a bold
statement. The US Dollar has been able to hold levels above .9100 all week. So
far $1,785 has held and I discussed this range of $1,800 to $1,785 in my last
report. We are currently at a level where the gold bulls will really need to
step up and quickly retrace levels back to $1,850. I’m thinking that if there’s
too much hesitation to recover quickly from here that the path of least
resistance remains down. If somehow the Dollar reverses and moves back below
.9100 then that would support gold prices recovering. However, I’m thinking
you’ll be able to enter on the long side at lower levels in the range of $1,750
to $1,740 for the April contract.
US Treasury Futures remain weak and Equities remain strong. Energy markets are very strong. These are “risk on” trades and regardless of the reason behind these trades, they’re not good for gold. There’s ne reason for the safe-haven trade. The currency trade isn’t working, and we’re just not yet ready to embrace the inflation trade for gold. There is inflation out there. You can see it in other markets. Don’t give up on the gold trade, but a patient approach is recommended.
Gold Weekly Chart If you have any questions or would like to discuss the markets further, please feel free to contact me at 800-826-4124 or fcholly@rjofutures.com. Metals - Bears in Control of Silver
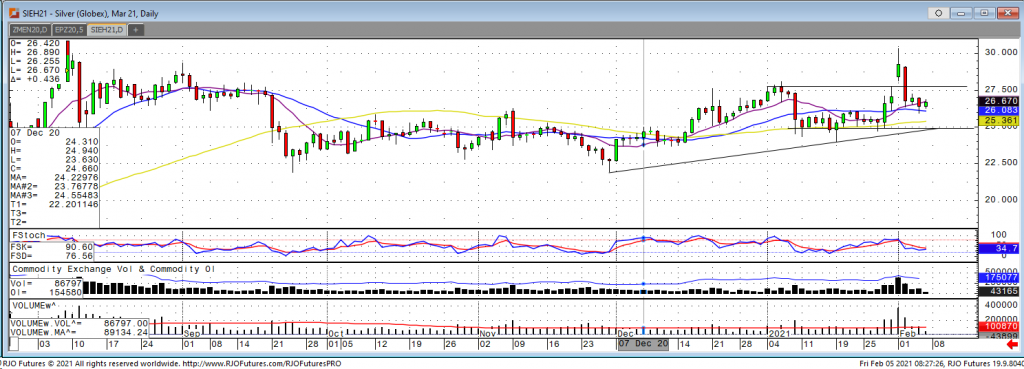
Monday we saw a continuation of last week’s momentum in silver with the March silver contract pushing as high as 30.350, but that move was quickly given back as the market traded down to a low this week of 25.935 on Thursday. The bears are in control after this week’s action but the trend higher remains intact. Monday’s push higher looked to be caused at least somewhat by a massive increase in demand for physical coins with many retailers online getting completely wiped out on their inventory. The rally was short lived with a strengthening US dollar, higher stock market, and positive US economic data providing pressure to the metals markets. Also, no fresh talks of a stimulus package getting passed this week probably helped push silver down as well. There currently is a disconnect in the futures price and physical silver coin price with demand remaining high for physical coins. March silver looks to be trying to build some support off of the 26.350 level which is good news for the bulls. Another washout lower would push down to find support at 25.000. The bulls need to see a close above 27.750 to restart a rally and go test the 30.000 level again. Silver still could see another move lower as its in the middle of a sideways range. Watch the dollar and US equities to determine which direction the market will be pushed next.
Silver Mar '21 Daily Chart If you have any questions or would like to discuss the markets further, please feel free to contact me at 800-826-2270 or therrmann@rjofutures.com. Energy - Oil Price High but Signaling Overbought
Oil Price High but Signaling Overbought
By: Alex Turro, Senior Market StrategistPosted Feb 5, 2021 9:38AM CT
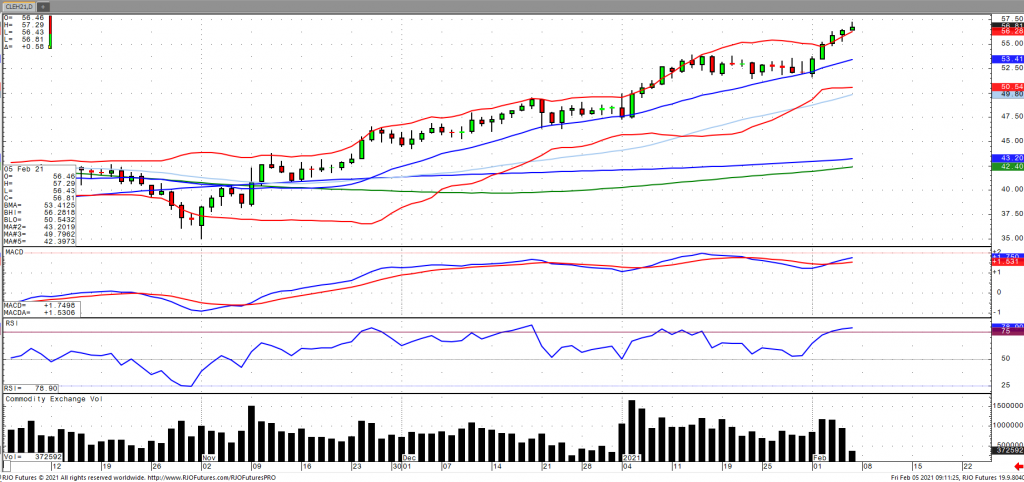
Oil prices are continuing their advance towards $60 a barrel as the vaccine rollout efforts continue to encourage the prospect of enhanced fuel demand, despite the expectation that consumption will not reach pre-pandemic levels. Support has been garnered by ongoing supply cuts by major producers as OPEC+ reiterated their commitment at their policy meeting on Wednesday. In addition, weekly inventories showed oil stockpiles fell to 475.7 million barrels, the lowest level since March with refinery utilization rates edging higher. The market remains bullish trend but is signaling immediate term overbought with today’s range seen between 52.02 – 57.22.
Crude Oil Mar '21 Daily Chart If you have any questions or would like to discuss the markets further, please feel free to contact me at 800-438-4805 or aturro@rjofutures.com. Softs - Coffee Continues Rangebound
Coffee Continues Rangebound
By: Adam TuiaanaPosted 02/03/2021
Slowly but surely businesses
and schools are re-opening which has presented the bulls with opportunities to
step in and find support in March coffee futures. Although the vaccine
distribution efforts have been a bit slow-going, the fact that there is a
vaccine continues to build confidence in the mind of the worker and consumer.
However, “a new study from the National Restaurant
Association claims nearly 17% of U.S. restaurants have closed either
permanently or long-term amid the coronavirus pandemic.” These closures may likely affect the mindset
of the entrepreneur, and ultimately the demand for coffee. For the next couple of years, or at the very
least, until the pandemic is completely in the rear-view mirror, we should
expect demand to remain stable but in check.
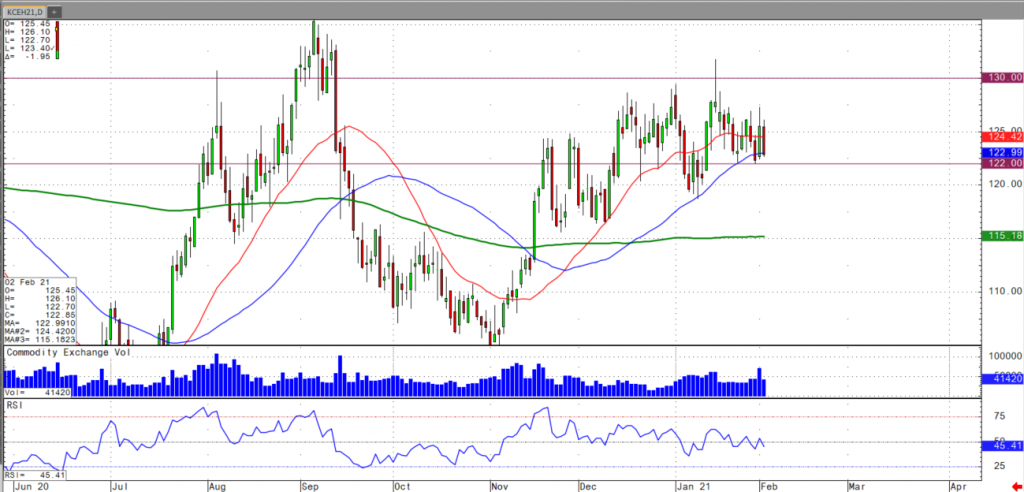
Sideways consolidation has been the technical news for March
coffee prices, with price action tied to a well-defined range of 120-129. Currently
March coffee futures are hugging the 50-day moving average, resting at 122.
Traders should monitor for a break above the 130 level for upside continuation,
and break below the 120 area (and ultimate violation of the 50-day MA) should
spell a reversal down to the 200-day MA (resting at 115).
For more frequent commentary, please check out and subscribe to my daily futures market videos on coffee and other commodities.
On
the heels of mid-Sep-to-early-Oct's steeper, accelerated, 3rd-wave-looking
recovery, the past week-and-a-half's boringly lateral chop is first considered
a corrective/consolidative event that warns of a continuation of the uptrend
that preceded it to new highs above 04-Oct's 891.0 high. This count
remains consistent with our broader base/correction/recovery count introduced
in 13-Sep's Technical Blog following that
day's bullish divergence in short-term momentum above 07-Sep's 809.5 minor
corrective high detailed in the hourly chart below.
The
important takeaway from this month's lateral, sleepy price action is the
definition of Wed's 851.5 low as
the end or lower boundary of a suspected 4th-Wave correction. A failure
below 851.5 will confirm a bearish divergence in daily momentum and defer or
threaten a bullish count enough to warrant non-bullish decisions like
long-covers. A failure below 851.5 will not
necessarily negate a broader bullish count, but it will threaten it enough to
warrant defensive measures as the next pertinent technical levels below 851.5 are
13-Sep's prospective minor 1st-Wave high at 813.8 and obviously 08-Sep's 766.0
low. And making non-bullish decisions "down there" is
sub-optimal to say the least. Per such, both short- and longer-term
commercial traders are advised to pare or neutralize bullish exposure on a
failure below 851.5, acknowledging and accepting whipsaw risk- back above 04-Oct's
891.0 high- in exchange for much deeper and sub-optimal nominal risk below
766.0.
On
a broader scale, the daily log scale chart above shows the developing potential
for a bearish divergence in daily momentum that will be considered confirmed
below 851.5. This chart also shows the past month's recovery thus far
stalling in the immediate neighborhood of the (888.0) Fibonacci
minimum 38.2% retrace of Apr-Sep's entire 1128 - 766 decline). COMBINED
with a failure below 851.5, traders
would then need to be concerned with at least a larger-degree correction pf the
past month's rally and possibly a resumption of Apr-Sep's major downtrend.
Until
and unless the market fails below 851.5 however, we would
remind longer-term players of the key elements on which our bullish count is
predicated:
a confirmed bullish divergence in WEEKLY momentum
(below)
amidst
an
historically low 11% reading in out RJO Bullish Sentiment Index and
a
textbook complete and major 5-wave Elliott sequence down from 29-Apr's
1128 high to 08-Sep's 766.0 low.
Thus
far, the market is only a month into correcting a 4-MONTH, 32% drawdown, so
further and possibly protracted gains remain well within the bounds of a major
(suspected 2nd-Wave) correction of Apr-Sep's decline within an even more
massive PEAK/reversal process from 17-May's 1219 high on an active continuation
basis below.
These
issues considered, a bullish policy and exposure remain advised with a failure
below 851.5 required to defer or threaten this call enough to warrant moving to
a neutral/sideline position. In lieu of such weakness, we anticipate a
continuation of the past month's rally to new highs and potentially significant
gains above 891.0.
Agricultural - Grain Futures Update w/Stephen Davis - 02/05/2021
Grain Futures Update w/Stephen Davis - 02/05/2021
By: Stephen DavisPosted 02/05/2021
Stephen Davis discusses the latest news in the grain markets including the fact that he thinks China will continue buying U.S. grains.Currency - Potential Major Trend Decision in USD Today
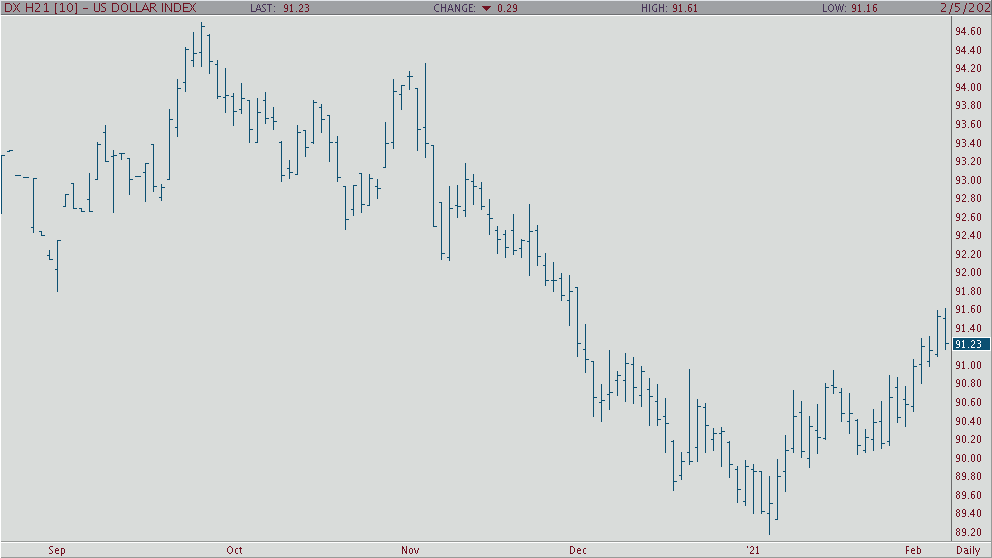
Potential Major Trend Decision in USD Today
By: Tony Cholly, Senior Market StrategistPosted Feb 5, 2021 8:45AM CT
Today will be a very important day for the bull camp in the USD, as the trade is likely to get some type of confirmation on the real focus of the bull camp. Basically, seeing further USD gains in the wake of slightly better US nonfarm payrolls will likely enforce the idea that capital is flowing to the USD off prospects of improved US differential yield potentials. On the other hand, it is also possible that the USD will continue to rally in the face of a disappointing jobs number, which in turn would suggest the bull camp is capable of shifting a number of fundamental outcomes in its favor. USD reaching overbought levels warrant some caution for bulls. A positive sign for trend short term, was given on a close over the 9 day MA. The next upside objective is 9193. Resistance comes in at 9175 and 9190 with support hitting at 9125 and 9095.
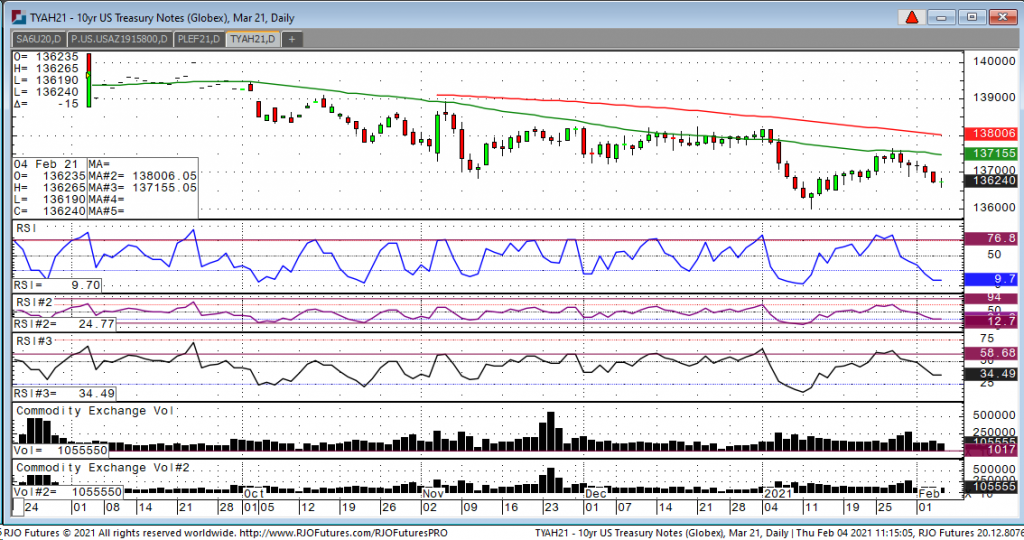
USD Mar '21 Daily Chart If you have any questions or would like to discuss the markets further, please feel free to contact me at 800-826-2270 or tcholly@rjofutures.com. Interest Rates - Interest Rates Still Moving on Stimulus
Looking at the march 10-year we had a high overnight of 136-26.5 and a low of 136-19 and currently trading at 136-255. The over trend is now firmly lower with the market currently below the 50-day moving average which currently sits at 137-155. In addition, if you look at the daily chart, today is the fourth day in a row where we see lower highs which also confirms the downtrend. The market is looking ahead of the new stimulus bill that hopes to be passed in the not to distant future. Another bearish factor that the market is absorbing is the decline in unemployment claims. Additionally, as more people are getting vaccinated for the virus, the daily infection fate has dropped to the lowest levels since November. With all the bearishness that we see, traders should be aware that we see speculators and funds are short this market so a bit of a short squeeze could occur especially tomorrow as we have the monthly employment number that comes out at 7:30 central. The street is looking for a gain of 50K vs last month’s decline of 140K. Looking at support and resistance levels, I see 136-10 on the downside and 137-155-137-20 on the upside.
Mar '21 Daily Chart If you have any questions or would like to discuss the markets further, please feel free to contact me at 800-826-2270 or gperlin@rjofutures.com. Equity - Economy Adds 49k Jobs
Economy Adds 49k Jobs
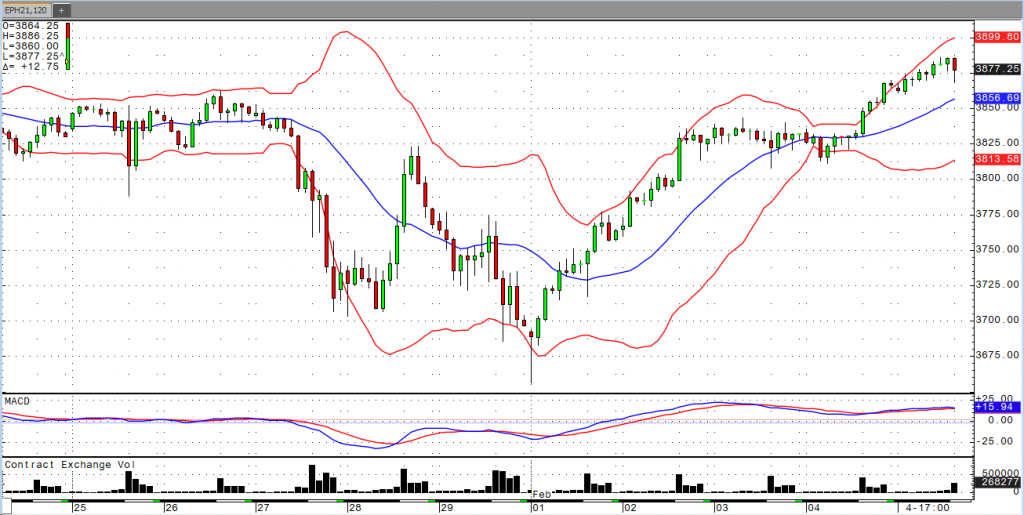
By: Bill Dixon, Senior Market StrategistPosted Feb 5, 2021 9:42AM CT
Expectations of 50k jobs added were just about dead on this morning. Consensus for the unemployment rate was 6.7%, but that came in much better at 6.3%. In the wake of the open, stocks seemed to be enjoying the reading. New all-time highs were seen in the S&P, Nasdaq, and Russell. The Dow fell 40 ticks short of doing the same. In addition to the positive jobs data, the Senate voted to push through a $1.9 trillion covid relief package without any GOP support. The bill will now head to the House, where it is unlikely to face a whole lot of headwinds from the Dem majority.
Despite the good news, it looks like a lot of traders took advantage of the higher prices by taking some profits. The indices all showed short-term overbought readings when on their highs and are now heading back towards unchanged/negative. We’ll see whether or not we see another correction of note, but the fact that we’re already printing new all-time highs after what we witnessed last week shows you that the buyers are still out there.
E-mini S&P 500 Mar '21 Daily Chart If you have any questions or would like to discuss the markets further, please feel free to contact me at 800-669-5354 or bdixon@rjofutures.com. Economy - S-T Mo Failure Insufficient to End RBOB Correction, But Beware
S-T Mo Failure Insufficient to End RBOB Correction, But Beware
By: RJO Market InsightsPosted 11/08/2022
Posted on Nov 08, 2022, 07:51 by Dave Toth
In Fri's Technical Webcast we identified a
minor corrective low at 2.6328 from Thur as a mini risk parameter the market
needed to sustain gains above to maintain a more immediate bullish count.
The 240-min chart below shows the market's failure overnight below this level,
confirming a bearish divergence in very short-term momentum. This mo
failure defines Fri's 2.8172 high as
one of developing importance and a parameter from which very short-term traders
can objectively base non-bullish decisions like long-covers.
Given
the magnitude of the past three weeks' broader recovery however, this
short-term momentum failure is of an insufficient scale to conclude anything
more than another correction within this broader recovery from 26-Sep's 2.1877
low. Indeed, overnights failure below 2.6328 only allows us to conclude
the end of the portion of the month-and-a-half rally from 31-Oct's 2.4822 next
larger-degree corrective low. 2.4822 is the
risk parameter this market still needs to fail below to break the uptrend from
18-Oct's 2.3526 low while this 2.3526 low
remains intact as the risk parameter this market needs to fail below to break
the month-and-a-half uptrend. From an
intermediate-to-longer-term perspective, this week's setback falls well within
the bounds of another correction ahead of further gains. This is another
excellent example of the importance of technical and trading SCALE and
understanding and matching directional risk exposure to one's personal risk
profile.
The
reason overnight's admittedly minor mo failure might have longer-term
importance is the 2.8172-area from which it stemmed. In
Fri's Technical Blog we also noted the market's engagement of the
2.8076-to-2.8159-area marked by the 61.8% retrace of Jun0-Sewp's 3.2758 -2.1877
decline and the 1.000 progression of Sep-Oct's initial 2.1877 - 2.6185
(suspected a-Wave) rally from 18-Oct's 2.3526 (suspected b-Wave) low. We
remind longer-term players that because of the unique and compelling confluence
of:
early-Aug's bearish divergence in WEEKLY momentum
amidst
historically
extreme bullish sentiment/contrary opinion levels in our RJO Bullish
Sentiment Index
an
arguably complete and massive 5-wave Elliott sequence from Mar'20's 0.4605
low to Jun's 4.3260 high (as labeled in the weekly log active-continuation
chart below) and
the
5-wave impulsive sub-division of Jun-Sep's (suspected initial 1st-Wave) decline
The
recovery attempt from 26-Sep's 2.1877 low is arguably only a 3-wave (Wave-2)
corrective rebuttal to Jun-Sep's decline within a massive, multi-quarter
PEAK/reversal process. Now granted, due to the magnitude of 2020 -2022's
secular bull market, we discussed the prospect for this (2nd-Wave corrective)
recovery to be "extensive" in terms of both price and time. A
"more extensive" correction is typified by a retracement of 61.8% or
more and spanning weeks or even months following a 3-month decline. Per
such, the (suspected corrective) recovery from 26-Sep's 2.1877 low could easily
have further to go, with commensurately larger-degree weakness than that
exhibited this week (i.e., a failure below at least 2.4822) required
to consider the correction complete. Indeed, the daily log chart above
shows the market thus far respecting former 2.6185-area resistance from 10-Oct
as a new support candidate.
These
issues considered, very shorter-term traders have been advised to move to a neutral/sideline
position following overnight's momentum failure below 2.6328, with a recovery
above 2.8172 required to negate this call, reaffirm the recovery and re-expose
potentially significant gains thereafter. For intermediate- and
longer-term players, a bullish policy and exposure remain advised with a
failure below 2.4822 required to threaten this call enough to warrant
neutralizing exposure. We will be watchful for another bearish divergence
in momentum following a recovery attempt that falls short of Fri's 2.8172 high
that would be considered the next reinforcing factor to a count calling that
2.8172 high the prospective end to the month-and-a-half 2nd-Wave
correction. In lieu of such, a resumption of the current rally to
eventual new highs above 2.8172 should not surprise.