RJO FuturesCast

March 5, 2021 | Volume 15, Issue 9

The Markets

Metals - Gold is Near a Bottom

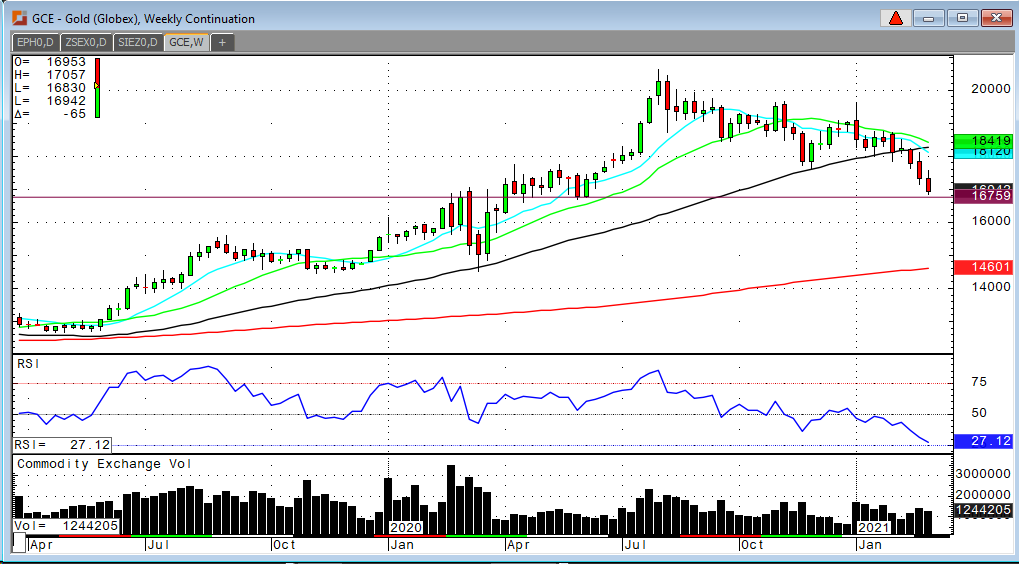
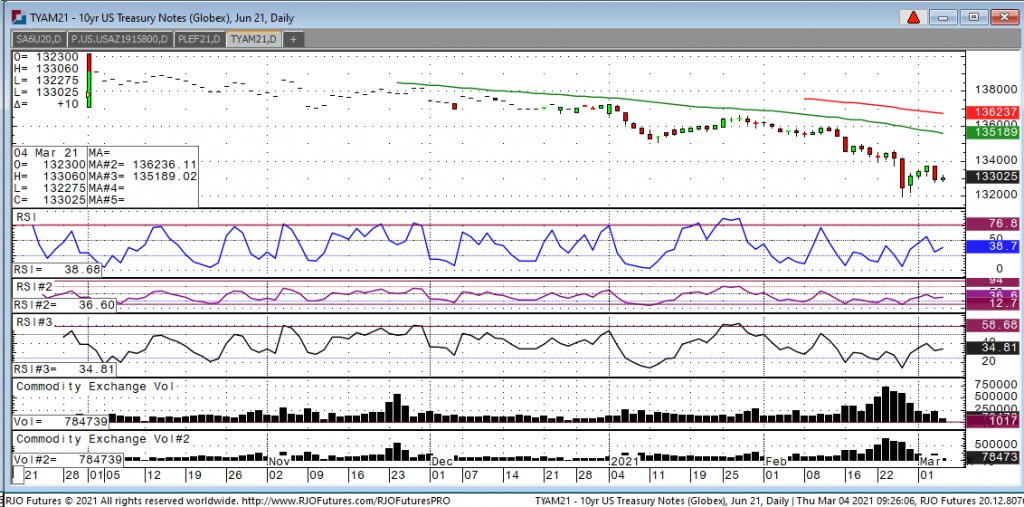
Gold has been sliding lower since January 6th. It’s not a coincidence that Treasuries Futures have also been sliding lower since January 6th. The next date on the daily chart that you should pay attention to is February 11th. That is the day that the selling accelerated. So why is gold being liquidated while treasuries move lower? Because interest rates are moving higher. Yields are returning to the “savers”! There is very suddenly a new way to get real returns on your money. Rates have moved very fast and now even Fed Chairman Powell cannot ignore inflation any longer. He had to acknowledge publicly now that as the economy reopens, inflation will rise. Well no kidding! Commodity traders see inflation all over the place. Lumber is at all time highs. Copper is at 11-year highs. Crude oil is over $65.00. RBOB gasoline is over $2.05 today. Grain markets are at 7-8-year highs. This is inflation. It’s not yet runaway inflation, but Washington wants yet more stimulus and then they’re going to finally look to spend more taxpayer dollars on “infrastructure”. There are too many dollars out there already. The economy is growing. The economy is NOT going to slow down as we reopen.

So why do I think that gold is near a bottom? The short answer is that I see longer term support around $1,675 to $1,650 and gold has reached oversold levels now. But more importantly because I still believe that gold is and will continue to be a good inflationary hedge. The rotation out of risky assets and into the safe returns in treasuries will slow. The bond market is telling us all that inflation is here. Once we embrace this inflation, gold prices will begin to march higher.

Gold Weekly Chart
If you have any questions or would like to discuss the markets further, please feel free to contact me at 800-826-4124 or fcholly@rjofutures.com.
Metals - Silver is Struggling Early

Pretty dismal start of the moth for the silver market with the end of last week’s slide lower continuing this week. Tuesday was the only green day as the market fought off the lows to close higher on the day. The rest of the week we say trade down to support at $25. The outlook for silver remains bearish in the short term with a rally this week in the US dollar and a rise in interest rates. The Fed is sticking to their story of not stepping in front of inflation for the time being. A positive jobs number this morning at 379K vs an estimate of 182k will also add pressure to the silver market. The stock market also saw a pullback after starting the week trading higher which shows an overall risk off environment in the market. A stimulus package is still in talks, but it may be too little too late to make a significant impact. May silver needs to hold this $25 support level or risks seeing trade push down to $24 and then $22.50. The bulls are going too have to see a bounce to $27.50 and then $28.50 in order to rally back to the most recent high of $30. There is still a case for a rally in the metals but its not going to be an easy route and you should expect some back and forth along the way.

Silver May '21 Daily Chart
If you have any questions or would like to discuss the markets further, please feel free to contact me at 800-826-2270 or therrmann@rjofutures.com.
Softs - Coffee Pulls Back

May coffee has retreated from the 1.40 highs aggressively over the past four trading sessions, due largely in part to a weak Brazilian currency and wet weather in key growing areas of the largest producing country, Brazil. Although the promise of much stronger demand is in play, this near-term weakness has May coffee prices potentially revisiting the well-defined range that had been in place from November 2020 through early this month. This recent selloff is also likely to be some long liquidation taking place as prices have not reached the 1.40 resistance level since December of 2019.

The recent breakout rally from February 22nd has been answered by an over 62% retracement correction. The high from the last major consolidation range is 1.30, so it is likely that this area should have some good support. With May coffee last trading 1.32, a continued selloff to 1.30 is still likely in the near-term.

For more frequent commentary, please check out and subscribe to my daily futures market videos on coffee and other commodities.

Coffee May '21 Daily Chart
Agricultural - Bullish Canola Count Intact Above Minimum 851.5

Posted on Oct 14, 2022, 07:42 by Dave Toth

On the heels of mid-Sep-to-early-Oct's steeper, accelerated, 3rd-wave-looking recovery, the past week-and-a-half's boringly lateral chop is first considered a corrective/consolidative event that warns of a continuation of the uptrend that preceded it to new highs above 04-Oct's 891.0 high.  This count remains consistent with our broader base/correction/recovery count introduced in 13-Sep's Technical Blog following that day's bullish divergence in short-term momentum above 07-Sep's 809.5 minor corrective high detailed in the hourly chart below.

The important takeaway from this month's lateral, sleepy price action is the definition of Wed's 851.5 low as the end or lower boundary of a suspected 4th-Wave correction.  A failure below 851.5 will confirm a bearish divergence in daily momentum and defer or threaten a bullish count enough to warrant non-bullish decisions like long-covers.  A failure below 851.5 will not necessarily negate a broader bullish count, but it will threaten it enough to warrant defensive measures as the next pertinent technical levels below 851.5 are 13-Sep's prospective minor 1st-Wave high at 813.8 and obviously 08-Sep's 766.0 low.  And making non-bullish decisions "down there" is sub-optimal to say the least.  Per such, both short- and longer-term commercial traders are advised to pare or neutralize bullish exposure on a failure below 851.5, acknowledging and accepting whipsaw risk- back above 04-Oct's 891.0 high- in exchange for much deeper and sub-optimal nominal risk below 766.0.

On a broader scale, the daily log scale chart above shows the developing potential for a bearish divergence in daily momentum that will be considered confirmed below 851.5.  This chart also shows the past month's recovery thus far stalling in the immediate neighborhood of the (888.0) Fibonacci minimum 38.2% retrace of Apr-Sep's entire 1128 - 766 decline).  COMBINED with a failure below 851.5, traders would then need to be concerned with at least a larger-degree correction pf the past month's rally and possibly a resumption of Apr-Sep's major downtrend.

Until and unless the market fails below 851.5 however, we would remind longer-term players of the key elements on which our bullish count is predicated:

  • a confirmed bullish divergence in WEEKLY momentum (below) amidst
  • an historically low 11% reading in out RJO Bullish Sentiment Index and
  • a textbook complete and major 5-wave Elliott sequence down from 29-Apr's 1128 high to 08-Sep's 766.0 low.

Thus far, the market is only a month into correcting a 4-MONTH, 32% drawdown, so further and possibly protracted gains remain well within the bounds of a major (suspected 2nd-Wave) correction of Apr-Sep's decline within an even more massive PEAK/reversal process from 17-May's 1219 high on an active continuation basis below.

These issues considered, a bullish policy and exposure remain advised with a failure below 851.5 required to defer or threaten this call enough to warrant moving to a neutral/sideline position.  In lieu of such weakness, we anticipate a continuation of the past month's rally to new highs and potentially significant gains above 891.0.

Agricultural - Grain Futures Update w/Stephen Davis - 03/05/2021
Stephen Davis discusses the latest news driving the grain markets. Grains are up this morning and we'll see if we can carry that momentum into next week.
Currency - Expect Volatility from USD

The USD continues to rise with fresh upside breakout this morning and the highest trade since November 25th.  Obviously, indications from the federal reserve chairman that recent sharp gains in interest rates are not a concern, would seem to clear the path for even higher US interest rates ahead. In fact, many times markets threatened with intervention or simply anticipating intervention will push to pull out intervention. Money looks to continue to flow toward the USD with a wide range of payroll outcomes this morning, favoring the bull camp. The crossover of the moving averages suggests a developing short-term uptrend. Daily RSI has risen into overbought levels. Resistance comes in around 9195 and 9220, with support coming in at 9125 and 9080.

USD Mar '21 Daily Chart
If you have any questions or would like to discuss the markets further, please feel free to contact me at 800-826-2270 or tcholly@rjofutures.com.
Interest Rates - Interest Rates Waiting on Chairman Powell's Speech

Taking a look at the June 10-year note this morning, we somewhat of a narrow range with an overnight high of 133-06 and a low of 132-275. Currently, the price sits at 133.05. Today’s market is clearly waiting on Chairman Powell’s speech at 11:05a.m. central where most traders believe that he will stay consistent and will reiterate that inflation is still subdued, and bond buying will continue. That has been the pattern of the last month every time he speaks. How the market has reacted after his speeches has been consistent as well. Yields will come down and prices will go up and then after the dust settles, the market doesn’t believe him and reverses after. So, traders should be aware and trade accordingly. Looking at technical’ s for 10-year June contract, I see resistance at 133-12-15 and support at 132-20. Since we are still in a downtrend, traders are advised to sell strength because the market is still in downtrend. Again, Powell speaks at 11:05 today so be aware.

10-Year Note Jun '21 Daily Chart
If you have any questions or would like to discuss the markets further, please feel free to contact me at 800-826-2270 or gperlin@rjofutures.com.
Equity - Stocks Mixed Following Good Jobs Number

Rising interest rates and inflation fears have rocked the equity markets this week.  The tick up in interest rates led to rumors of another “Operation Twist” policy being in the works. The process involves the Fed selling shorter term treasuries and buying longer dated ones. The goal is to encourage growth by lowering longer term rates. When Jerome Powell expressed that he had little concern over inflation fears during his speech yesterday, the market collapsed. 

Yesterday’s dip eventually got bought in to the close, but markets struggled to build on the late momentum, resulting in choppy trade overnight. When the jobs data was released showing a gain of 379k jobs (175k expected) and an unemployment rate of 6.2%, a quick selloff was followed by a sharp rally. Since then, we’ve seen a bit of a mixed bag with higher dollar and higher yields continuing to weigh on the Nasdaq in particular. The dollar hit our initial target of 92.00 overnight (92.225 high) and has since backed off a bit. We still think that 92.70 might be in the cards, but we should find some real issues overcoming 94.00. With that in mind, I think we may see some even lower prices in equities (targeting 3685 and 12000-12200 in the S&P and Nasdaq, respectively) before we are likely to see another rally. 

E-mini S&P 500 Daily Chart
If you have any questions or would like to discuss the markets further, please feel free to contact me at 800-669-5354 or bdixon@rjofutures.com.
Economy - S-T Mo Failure Insufficient to End RBOB Correction, But Beware

Posted on Nov 08, 2022, 07:51 by Dave Toth

In Fri's Technical Webcast we identified a minor corrective low at 2.6328 from Thur as a mini risk parameter the market needed to sustain gains above to maintain a more immediate bullish count.  The 240-min chart below shows the market's failure overnight below this level, confirming a bearish divergence in very short-term momentum.  This mo failure defines Fri's 2.8172 high as one of developing importance and a parameter from which very short-term traders can objectively base non-bullish decisions like long-covers.

Given the magnitude of the past three weeks' broader recovery however, this short-term momentum failure is of an insufficient scale to conclude anything more than another correction within this broader recovery from 26-Sep's 2.1877 low.  Indeed, overnights failure below 2.6328 only allows us to conclude the end of the portion of the month-and-a-half rally from 31-Oct's 2.4822 next larger-degree corrective low.  2.4822 is the risk parameter this market still needs to fail below to break the uptrend from 18-Oct's 2.3526 low while this 2.3526 low remains intact as the risk parameter this market needs to fail below to break the month-and-a-half uptrend.  From an intermediate-to-longer-term perspective, this week's setback falls well within the bounds of another correction ahead of further gains.  This is another excellent example of the importance of technical and trading SCALE and understanding and matching directional risk exposure to one's personal risk profile.

The reason overnight's admittedly minor mo failure might have longer-term importance is the 2.8172-area from which it stemmed.  In Fri's Technical Blog we also noted the market's engagement of the 2.8076-to-2.8159-area marked by the 61.8% retrace of Jun0-Sewp's 3.2758 -2.1877 decline and the 1.000 progression of Sep-Oct's initial 2.1877 - 2.6185 (suspected a-Wave) rally from 18-Oct's 2.3526 (suspected b-Wave) low.  We remind longer-term players that because of the unique and compelling confluence of:

  • early-Aug's bearish divergence in WEEKLY momentum amidst
  • historically extreme bullish sentiment/contrary opinion levels in our RJO Bullish Sentiment Index
  • an arguably complete and massive 5-wave Elliott sequence from Mar'20's 0.4605 low to Jun's 4.3260 high (as labeled in the weekly log active-continuation chart below) and
  • the 5-wave impulsive sub-division of Jun-Sep's (suspected initial 1st-Wave) decline

The recovery attempt from 26-Sep's 2.1877 low is arguably only a 3-wave (Wave-2) corrective rebuttal to Jun-Sep's decline within a massive, multi-quarter PEAK/reversal process.  Now granted, due to the magnitude of 2020 -2022's secular bull market, we discussed the prospect for this (2nd-Wave corrective) recovery to be "extensive" in terms of both price and time.  A "more extensive" correction is typified by a retracement of 61.8% or more and spanning weeks or even months following a 3-month decline.  Per such, the (suspected corrective) recovery from 26-Sep's 2.1877 low could easily have further to go, with commensurately larger-degree weakness than that exhibited this week (i.e., a failure below at least 2.4822) required to consider the correction complete.  Indeed, the daily log chart above shows the market thus far respecting former 2.6185-area resistance from 10-Oct as a new support candidate.

These issues considered, very shorter-term traders have been advised to move to a neutral/sideline position following overnight's momentum failure below 2.6328, with a recovery above 2.8172 required to negate this call, reaffirm the recovery and re-expose potentially significant gains thereafter.  For intermediate- and longer-term players, a bullish policy and exposure remain advised with a failure below 2.4822 required to threaten this call enough to warrant neutralizing exposure.  We will be watchful for another bearish divergence in momentum following a recovery attempt that falls short of Fri's 2.8172 high that would be considered the next reinforcing factor to a count calling that 2.8172 high the prospective end to the month-and-a-half 2nd-Wave correction.  In lieu of such, a resumption of the current rally to eventual new highs above 2.8172 should not surprise.

Economy - Futures Market Outlook w/John Caruso - 03/04/2021

Volatility – while vol tends to sneak up on most, I can’t say that we weren’t ready for it. Recognizing some key players in the FAANG stocks breaking down over the last week, AND the drastic w/w change in our IVOL signal, I actually rented a modest short position over the past few days in “growth” aka NASDAQ. As I mentioned yesterday’s letter, we remain bullish on the cycle, but with the VIX and VXN (NQ volatility) breaking to bullish trend in the last 24hrs, I need to stop and respect that signal. Whether we hold bullish trend for more than a day remains to be seen (I don’t think it will). Keep an eye out…the Russell 2000 has me interested, but wait for me on this. 

Commodities-  Buying/trading opportunities lay ahead.  

*We’re housing some Silver on our books that’s moved against us for a couple of days, but honestly, I see no imminent signs of trouble here. Silver remains bullish in the model, and more importantly, bullish trend. If we see a trend breakdown here, we’ll respect that bull to bear phase transition and exit with no questions asked. 

*Copper and Platinum are both correcting, very intriguing dips to look at buying here.     

*Oil/Energy – no dip here. Despite the massive build in inventories of CL yesterday, we’re +5.00% over the past 2 days. 

China Stagflation? Something to consider in regards to commodities, is China looks to be moving into a Scenario 3 set-up. They are likely to begin to see some ‘stagnation’ in growth. Of course China is the worlds largest consumer of commodities globally. This is something we’re monitoring closely, Shanghai -2.05% breaking trend last night. 

If you have any questions or would like to discuss the markets further, please feel free to contact me at 800-669-5354 or jcaruso@rjofutures.com.

Coming Up Next Week...

View Futures Calendar