Looking to diversify your investment portfolio with futures trading, but lack the expertise on your own? Trading Systems and their programs are now listed on our website complete with track records, products traded and minimum account requirements and fees. If you need help navigating the site and viewing the results, give us a call.
New: E-mini S&P 500 Investor Kit
Historically, the E-mini S&P 500 is one of the most popular and widely traded futures contracts around the world. The reason behind its popularity lies within the leverage it affords the trader, and when you couple that with its accessibility and ease to trade it makes the contract viable to virtually any trader. The S&P 500 hits new highs seemingly every day and now is the perfect time to add it to your portfolio. Complete with actionable trading strategies our E-mini S&P 500 Investor kit is here to help all traders, regardless of experience!
The Markets
Metals - Look for Gold to Consolidate Around $1,700
Look for Gold to Consolidate Around $1,700
By: Frank J. Cholly, Senior Market StrategistPosted Mar 12, 2021 9:10AM CT
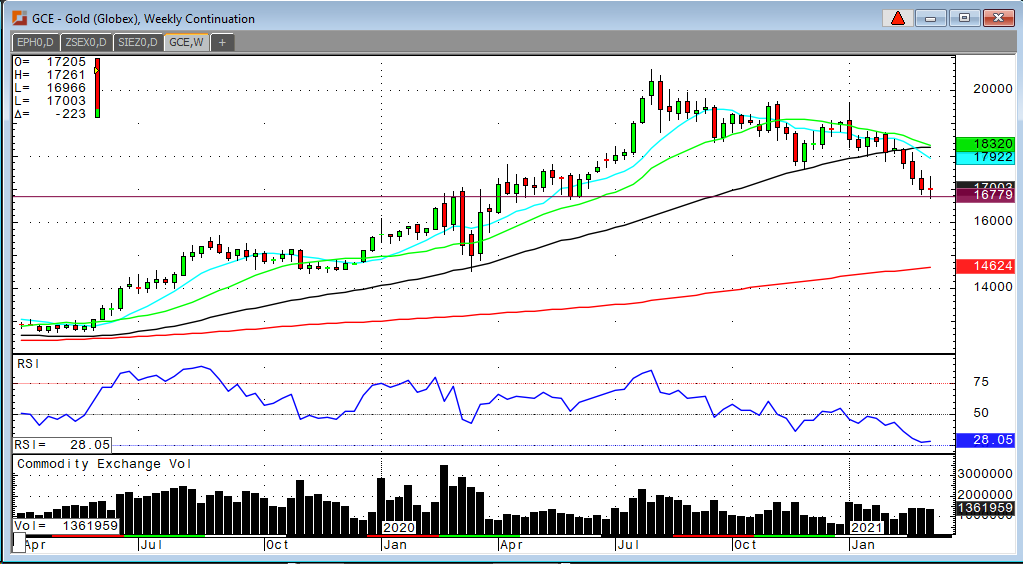
Last week I told you that I think that gold is near a bottom
now. So far that $1,675 level is holding. After a $50 bounce this week, today
we are seeing some back and fill action and it’s certainly possible to see a
re-test of that swing low or even that $1,650 level. Today’s action is discouraging
to the gold bulls. Rising yields this morning are my explanation for weakness
in gold. Higher yields pressure everything right now, This huge rotation will
run its course and gold will stabilize soon. We are very near, if not at the
bottom.
Platinum on the other hand has a more positive tilt to the
daily chart and has seen some positive ETF inflows this week. I remain a “long
term” bull on metals in general as I’m one who does believe that we are in the
early stages of a super-cycle in commodities. However, I think platinum will
likely be the best bull market in metals this year.
Look for gold to consolidate in a range that pivots are $1,700, while platinum should easily resume its uptrend.
Gold Weekly Chart If you have any questions or would like to discuss the markets further, please feel free to contact me at 800-826-4124 or fcholly@rjofutures.com. Metals - Silver Signaling Long-Term Higher Price Action
Silver Signaling Long-Term Higher Price Action
By: Eli Tesfaye, Senior Market StrategistPosted Mar 12, 2021 8:36AM CT
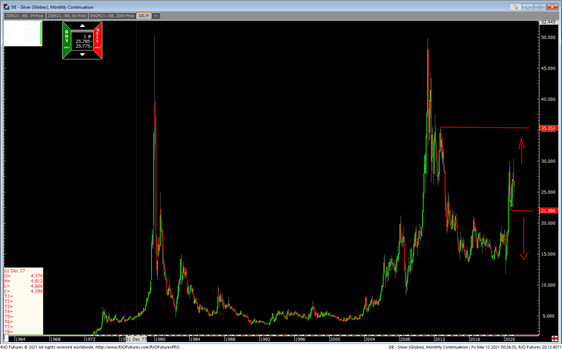
Fundamentally, President Biden just signed the 1.9 trillion dollar Covid-19 relief bill into law today. Silver is looking to benefit from the passage of the 1.9 trillion dollar stimulus package. The benefit to the silver contract will come in the form of infrastructure spending and speculative buying interest. Rest assured, other countries worldwide will take similar actions to shore up their economy and potentially drive up the silver price. The reality is that at some point in the future, the excess liquidity around the world could have a long-term impact on inflation, triggering higher price actions.
From the technical perspective, attached is the long-term silver chart worth looking at from time to time. It seems like silver will trade above $30.00 again before it trades below $20.00. Near term, silver could pop above $26.50, and trade below $25.00 could trigger a wave near $24.00. If you want to look at ideas to trade this ranging market, please let me know.
If you have any questions or would like to discuss the markets further, please feel free to contact me at 800-367-7290 or etesfaye@rjofutures.com. Energy - Oil Continues Higher Inflation
Oil Continues Higher Inflation
By: Alex Turro, Senior Market StrategistPosted Mar 12, 2021 9:08AM CT
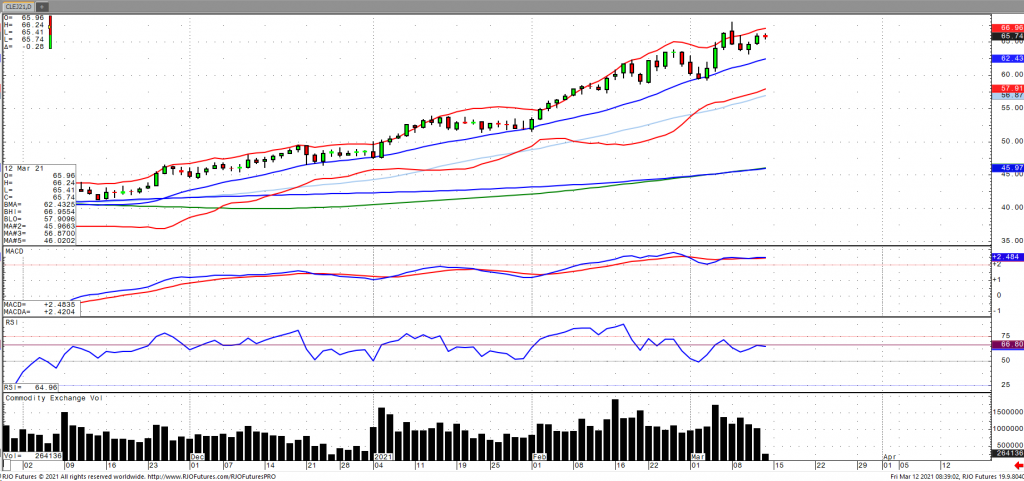
Oil prices are taking a breather after surging more than 2% on Thursday as the vaccine rollout initiative continued to improve the economic outlook, coupled with a sharp drop in weekly US fuel stocks indicating strong demand for end products. US gasoline stocks fell 11.9 million barrels, compared with expectations of a 3.5-million-barrel drop. This was largely offset by a surge in inventories, which rose by 13.8 million barrels, according to the EIA, bringing the total to 46.6 million barrels above year ago levels. Notwithstanding, refinery rates jumped, and refinery margins continue to improve which should help to ease supply and enhance demand prospects. Prices were further supported by reports that Chinese demand for Iranian oil continue to exceed forecasts despite ports now getting backed up, which in turn may dent demand for US supplies. The market remains bullish trend with today’s range seen between 60.76 – 67.95.
Crude Oil Apr '21 Daily Chart If you have any questions or would like to discuss the markets further, please feel free to contact me at 800-438-4805 or aturro@rjofutures.com. Softs - A Year Later: Covid, Cocoa, and the Coming Months
A Year Later: Covid, Cocoa, and the Coming Months
By: Peter MoosesPosted 03/12/2021
Just
about a year ago the world braced itself for some unknown virus that was slowly
disrupting the world as we knew it. People who were feeling ill were being
isolated and tested, businesses and offices began to send employees home until
the situation would be “under control” and the National Basketball Association
suspended play as it’s first player tested positive during live play. WHO
declared Covid a pandemic - the world knew at that point we may be dealing with
something we hadn’t seen in our lifetime.
Now,
the world is hopefully headed in a positive direction. Vaccines appear to be
rolling out at a successful pace in some areas - infection rates,
hospitalizations and death rates seem to be getting better during this process.
As more of the population accepts the vaccines we will know more about the
economic recovery as well. Will the public follow procedures long enough to
allow the progress made with vaccinations to work? Will certain states
reopening early hurt the entire US economy and recovery? Will spring break
travel stall the positive data we are receiving thus far as these potential
super spreader events take place? All these unknowns will be answered over the
next few months.
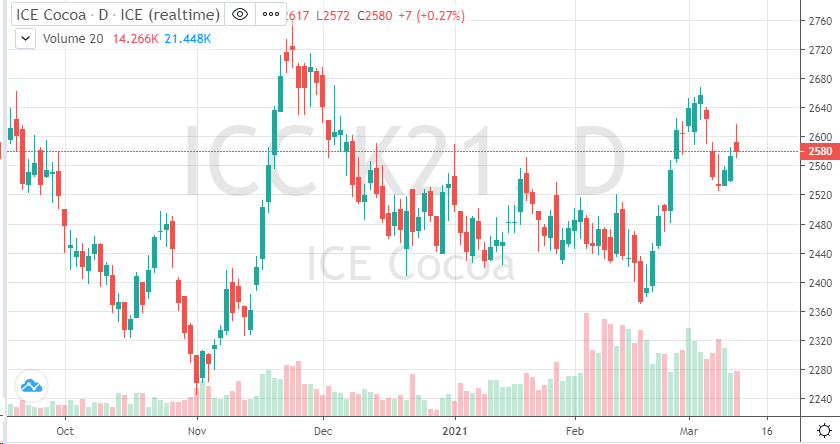
As for cocoa, a global economic recovery and reopening of businesses and events can only help the market. A soft commodity like cocoa is heavily reliant on demand. Demand has slowed as people have changed their routines and purchasing habits. Some of the fundamentals for cocoa have stayed steady, production concerns could help or stabilize prices and with a little help from the demand side of the equation May cocoa prices should head back above 2650.
On
the heels of mid-Sep-to-early-Oct's steeper, accelerated, 3rd-wave-looking
recovery, the past week-and-a-half's boringly lateral chop is first considered
a corrective/consolidative event that warns of a continuation of the uptrend
that preceded it to new highs above 04-Oct's 891.0 high. This count
remains consistent with our broader base/correction/recovery count introduced
in 13-Sep's Technical Blog following that
day's bullish divergence in short-term momentum above 07-Sep's 809.5 minor
corrective high detailed in the hourly chart below.
The
important takeaway from this month's lateral, sleepy price action is the
definition of Wed's 851.5 low as
the end or lower boundary of a suspected 4th-Wave correction. A failure
below 851.5 will confirm a bearish divergence in daily momentum and defer or
threaten a bullish count enough to warrant non-bullish decisions like
long-covers. A failure below 851.5 will not
necessarily negate a broader bullish count, but it will threaten it enough to
warrant defensive measures as the next pertinent technical levels below 851.5 are
13-Sep's prospective minor 1st-Wave high at 813.8 and obviously 08-Sep's 766.0
low. And making non-bullish decisions "down there" is
sub-optimal to say the least. Per such, both short- and longer-term
commercial traders are advised to pare or neutralize bullish exposure on a
failure below 851.5, acknowledging and accepting whipsaw risk- back above 04-Oct's
891.0 high- in exchange for much deeper and sub-optimal nominal risk below
766.0.
On
a broader scale, the daily log scale chart above shows the developing potential
for a bearish divergence in daily momentum that will be considered confirmed
below 851.5. This chart also shows the past month's recovery thus far
stalling in the immediate neighborhood of the (888.0) Fibonacci
minimum 38.2% retrace of Apr-Sep's entire 1128 - 766 decline). COMBINED
with a failure below 851.5, traders
would then need to be concerned with at least a larger-degree correction pf the
past month's rally and possibly a resumption of Apr-Sep's major downtrend.
Until
and unless the market fails below 851.5 however, we would
remind longer-term players of the key elements on which our bullish count is
predicated:
a confirmed bullish divergence in WEEKLY momentum
(below)
amidst
an
historically low 11% reading in out RJO Bullish Sentiment Index and
a
textbook complete and major 5-wave Elliott sequence down from 29-Apr's
1128 high to 08-Sep's 766.0 low.
Thus
far, the market is only a month into correcting a 4-MONTH, 32% drawdown, so
further and possibly protracted gains remain well within the bounds of a major
(suspected 2nd-Wave) correction of Apr-Sep's decline within an even more
massive PEAK/reversal process from 17-May's 1219 high on an active continuation
basis below.
These
issues considered, a bullish policy and exposure remain advised with a failure
below 851.5 required to defer or threaten this call enough to warrant moving to
a neutral/sideline position. In lieu of such weakness, we anticipate a
continuation of the past month's rally to new highs and potentially significant
gains above 891.0.
Agricultural - Grain Futures Update w/Stephen Davis - 03/12/2021
Grain Futures Update w/Stephen Davis - 03/12/2021
By: Stephen DavisPosted 03/12/2021
Stephen Davis discusses the latest news moving the grain markets and what we can expect going forward.Agricultural - By: Peter McGinnPosted 03/12/2021
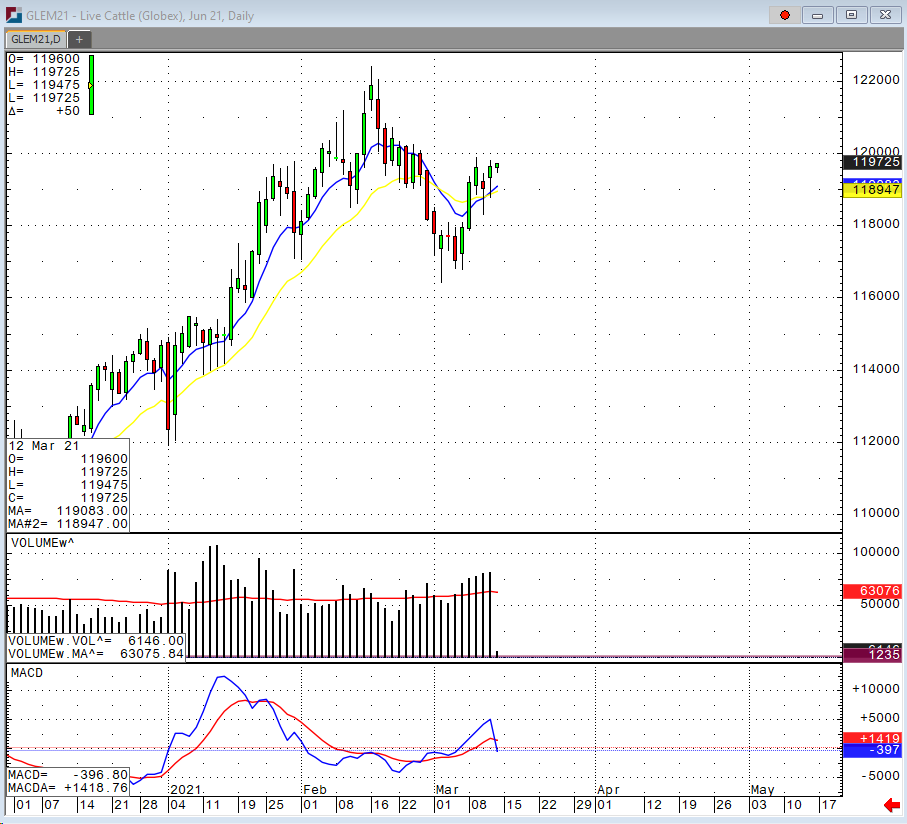
April cattle had a push down to its lowest level we’ve seen since Jan 2019. Compare that to the June cattle, which looks to have some strong demand coming from a passing of the 1.9 trillion-dollar stimulus package plus an increasing number of vaccinations leading to the country to start opening up more and having more opportunity to spend. Another factor in the support of June cattle prices is the possibility of a major winter storm into the feedlot regions which could bring up top 3 feet of snow and slow down beef production while also bringing down weights. In Iowa/Minnesota, 505 head were reported at 112 versus an average of 112.25 on 5,843 head on Wednesday. In Nebraska, 632 head were reported at 112-112.50 with an average price of 112.11 versus an average of 113.38 on 9,673 head on Wednesday. The USDA estimated cattle slaughter came in at 118,000 head yesterday. This brings the total for the week so far to 481,000 head, down from 485,000 last week and 491,000 a year ago. US beef export sales for the week ending March 4 came in at 20,873 tonnes, down from 22,615 the previous week but up from 8,470 the week before that. The average of the previous four weeks is 17,874 tonnes. Average dressed steer weights for the week ending February 27 came in at 899 pounds, down from 909 the previous week but up from 897 a year ago. The 5-year average weekly weight for that week is 883.4. The USDA boxed beef cutout was up 18 cents at mid-session yesterday but closed 62 cents lower at $226.67. This was down from $233.88 the previous week and was the lowest the cutout had been since March 10. Cash live cattle were a bit lower on Thursday, but the traded volume reported as of the afternoon was quite light, perhaps not enough for an adequate test.
Live Cattle Jun '21 Daily ChartEquity - Stocks Decline on 10-Year Yield Jump
Stocks Decline on 10-Year Yield Jump
By: Jeff Yasak, Senior Market StrategistPosted Mar 12, 2021 9:18AM CT
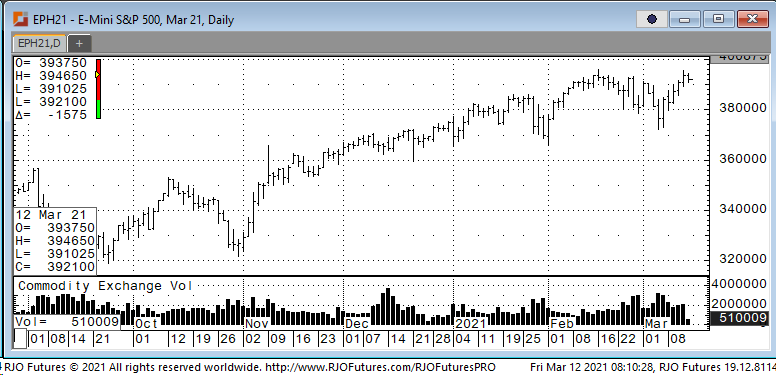
U.S. stock futures were trading lower Friday morning after a record gain in the Dow and S&P 500 as treasury yields continue to trek higher. Thursday saw the S&P and Dow make both record setting highs in intraday trading and the close with information technology and communication stocks leading the way. The S&P lost .04% with the tech heavy Nasdaq falling 1.4% while the 10-year yield rallied back to its high of the year of 1.61%, up 8 basis points over night. This increase in bond yields will put pressure on tech stocks as it reduces the value of their future profits. “Higher rates, less dovish central banks are now considered to be the single biggest threat of risk assets,” Ralf Preusser, Bank of America’s rates strategist, said in a note. With the passage of a US fiscal stimulus package and the blistering progress in vaccinations in the US, a number of key risks are falling by the wayside.”
Support today is 390500 and 386500 with resistance showing 397000 and 399700.
E-mini S&P 500 Mar '21 Daily Chart If you have any questions or would like to discuss the markets further, please feel free to contact me at 888-861-1656 or jyasak@rjofutures.com. Economy - S-T Mo Failure Insufficient to End RBOB Correction, But Beware
S-T Mo Failure Insufficient to End RBOB Correction, But Beware
By: RJO Market InsightsPosted 11/08/2022
Posted on Nov 08, 2022, 07:51 by Dave Toth
In Fri's Technical Webcast we identified a
minor corrective low at 2.6328 from Thur as a mini risk parameter the market
needed to sustain gains above to maintain a more immediate bullish count.
The 240-min chart below shows the market's failure overnight below this level,
confirming a bearish divergence in very short-term momentum. This mo
failure defines Fri's 2.8172 high as
one of developing importance and a parameter from which very short-term traders
can objectively base non-bullish decisions like long-covers.
Given
the magnitude of the past three weeks' broader recovery however, this
short-term momentum failure is of an insufficient scale to conclude anything
more than another correction within this broader recovery from 26-Sep's 2.1877
low. Indeed, overnights failure below 2.6328 only allows us to conclude
the end of the portion of the month-and-a-half rally from 31-Oct's 2.4822 next
larger-degree corrective low. 2.4822 is the
risk parameter this market still needs to fail below to break the uptrend from
18-Oct's 2.3526 low while this 2.3526 low
remains intact as the risk parameter this market needs to fail below to break
the month-and-a-half uptrend. From an
intermediate-to-longer-term perspective, this week's setback falls well within
the bounds of another correction ahead of further gains. This is another
excellent example of the importance of technical and trading SCALE and
understanding and matching directional risk exposure to one's personal risk
profile.
The
reason overnight's admittedly minor mo failure might have longer-term
importance is the 2.8172-area from which it stemmed. In
Fri's Technical Blog we also noted the market's engagement of the
2.8076-to-2.8159-area marked by the 61.8% retrace of Jun0-Sewp's 3.2758 -2.1877
decline and the 1.000 progression of Sep-Oct's initial 2.1877 - 2.6185
(suspected a-Wave) rally from 18-Oct's 2.3526 (suspected b-Wave) low. We
remind longer-term players that because of the unique and compelling confluence
of:
early-Aug's bearish divergence in WEEKLY momentum
amidst
historically
extreme bullish sentiment/contrary opinion levels in our RJO Bullish
Sentiment Index
an
arguably complete and massive 5-wave Elliott sequence from Mar'20's 0.4605
low to Jun's 4.3260 high (as labeled in the weekly log active-continuation
chart below) and
the
5-wave impulsive sub-division of Jun-Sep's (suspected initial 1st-Wave) decline
The
recovery attempt from 26-Sep's 2.1877 low is arguably only a 3-wave (Wave-2)
corrective rebuttal to Jun-Sep's decline within a massive, multi-quarter
PEAK/reversal process. Now granted, due to the magnitude of 2020 -2022's
secular bull market, we discussed the prospect for this (2nd-Wave corrective)
recovery to be "extensive" in terms of both price and time. A
"more extensive" correction is typified by a retracement of 61.8% or
more and spanning weeks or even months following a 3-month decline. Per
such, the (suspected corrective) recovery from 26-Sep's 2.1877 low could easily
have further to go, with commensurately larger-degree weakness than that
exhibited this week (i.e., a failure below at least 2.4822) required
to consider the correction complete. Indeed, the daily log chart above
shows the market thus far respecting former 2.6185-area resistance from 10-Oct
as a new support candidate.
These
issues considered, very shorter-term traders have been advised to move to a neutral/sideline
position following overnight's momentum failure below 2.6328, with a recovery
above 2.8172 required to negate this call, reaffirm the recovery and re-expose
potentially significant gains thereafter. For intermediate- and
longer-term players, a bullish policy and exposure remain advised with a
failure below 2.4822 required to threaten this call enough to warrant
neutralizing exposure. We will be watchful for another bearish divergence
in momentum following a recovery attempt that falls short of Fri's 2.8172 high
that would be considered the next reinforcing factor to a count calling that
2.8172 high the prospective end to the month-and-a-half 2nd-Wave
correction. In lieu of such, a resumption of the current rally to
eventual new highs above 2.8172 should not surprise.
Economy - Futures Market Outlook w/John Caruso - 03/12/2021
Futures Market Outlook w/John Caruso - 03/12/2021
By: John Caruso, Senior Market StrategistPosted Mar 12, 2021 8:40AM CT
Good morning,
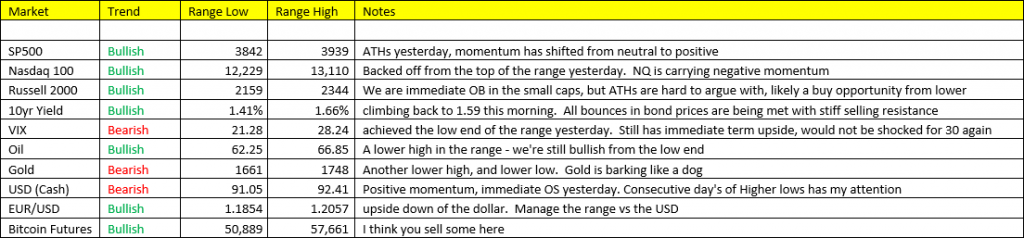
2 important macro shifts I’m seeing this morning:
The US Dollar is capturing my attention here – we’ve seen consecutive day’s of higher lows in our range, and it’s momentum signal has shifted to positive. If we’re embarking on shift in macro markets, the dollar is one of the first places you’ll begin to see it. 91.05 to 92.41 is our range to manage. If we’re seeing a shift/transition from weak to a firm(er) dollar, this will likely create lower highs in many commodities that we’ve going forward.
NASDAQ- its as clear as day the tech stocks are falling out favor…. the NQ -1.50% vs RTY UNCH and SPY -0.38%. The tech sector’s IVOL has been signaling a transition from multiple weeks of carrying premiums to now threatening a series of discounts. XLK -10% and QQQ -10% IVOL discounts. Big tech were the “pandemic/stay at home stocks” last year and are carrying some very difficult y/y comps for revenues and eps.
That’s all for now…
Good luck,
If you have any questions or would like to discuss the markets further, please feel free to contact me at 800-669-5354 or jcaruso@rjofutures.com.