The difference between historical & implied volatility
How to spot regimes of high and low volatility
Which option strategies to apply and when
How to read price action to support your option trades
New: E-mini S&P 500 Investor Kit
Historically, the E-mini S&P 500 is one of the most popular and widely traded futures contracts around the world. The reason behind its popularity lies within the leverage it affords the trader, and when you couple that with its accessibility and ease to trade it makes the contract viable to virtually any trader. The S&P 500 hits new highs seemingly every day and now is the perfect time to add it to your portfolio. Complete with actionable trading strategies our E-mini S&P 500 Investor kit is here to help all traders, regardless of experience!
The Markets
Metals - Positive Action in Gold
Positive Action in Gold
By: Frank J. Cholly, Senior Market StrategistPosted Mar 19, 2021 8:55AM CT
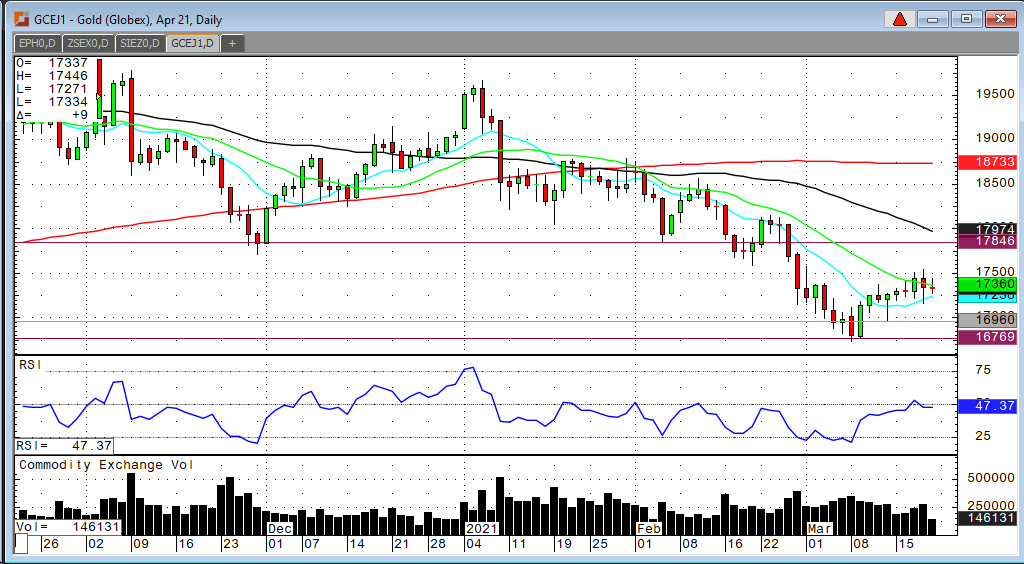
Beginning with last Friday’s rejection of a dip just below $1,700, the gold market has had a positive week. But the gold bulls are not out of the woods yet. The overall trend is still sideways to down. A couple keys levels that still need to be penetrated are a close above $1,760 and then there is significant resistance in the range of $1,785 to $1,800. Above $1,800 there isn’t much in terms of resistance until $1,850. I firmly believe that gold will be much higher by year end, but I must caution you that it’s still possible to retest $1,675 swing low. You could see that the buyers were very aggressive off that $1,675 level and then again on last Friday’s dip to $1,696. Perhaps a little consolidation just under $1,750 is in order before moving higher but I am encouraged by the way gold has performed since putting in that low.
Gold Apr '21 Daily Chart If you have any questions or would like to discuss the markets further, please feel free to contact me at 800-826-4124 or fcholly@rjofutures.com. Metals - Choppy Week for Silver
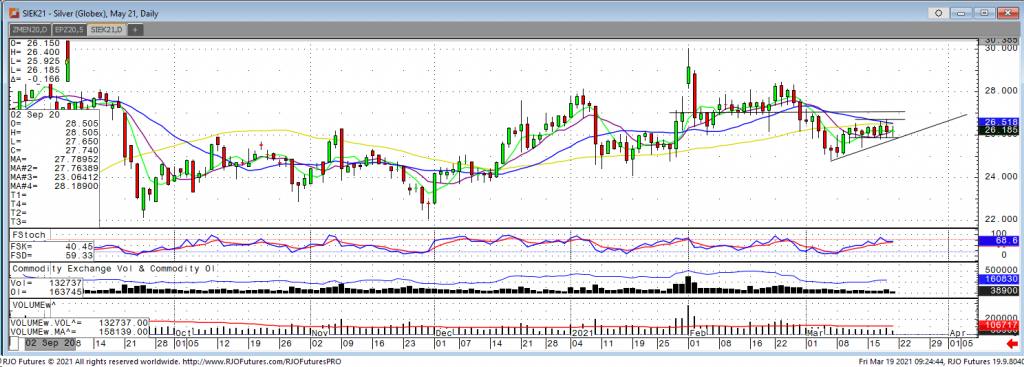
An overall choppy week of trade was seen in the silver market this week. We saw the low of the week of 25.805 posted Wednesday before closing higher. In similar fashion, Thursday traded as high as 26.740 before pulling back and closing lower on the day. Silver is slightly lower this morning, opening at 26.15 in the May contract. The silver market faced a lot of adversity this week with a falling stock market and rising US dollar. Despite the 10 yr falling this week and showing signs of inflation the Fed meeting left rates low and maintained their stance on focusing on job growth and using tools to raise inflation in a controlled manner. This welcoming of a rise in inflation should benefit silver and the metals markets in general but the rising US dollar is negating any rally with some downward pressure. There is still a disconnect between physical silver demand and the futures price. Silver ETFs saw several outflows this week with Thursday being the highest at 2.4 million ounces. Support comes in at 25.85 and resistance is above the market at 26.70 and then 27.07. This week’s sideways chop shows some coiling and a potential breakout to the upside if resistance levels are broken that would trigger stop loss buying from the shorts pressuring the market. With the Fed’s comments this week the bulls have a slight edge but if the support that was built is broken another leg lower is expected.
Silver May '21 Daily Chart
If you have any questions or would like to discuss the markets further, please feel free to contact me at 800-826-2270 or therrmann@rjofutures.com. Energy - Spike in Oil Volatility
Spike in Oil Volatility
By: Alex Turro, Senior Market StrategistPosted Mar 19, 2021 9:45AM CT
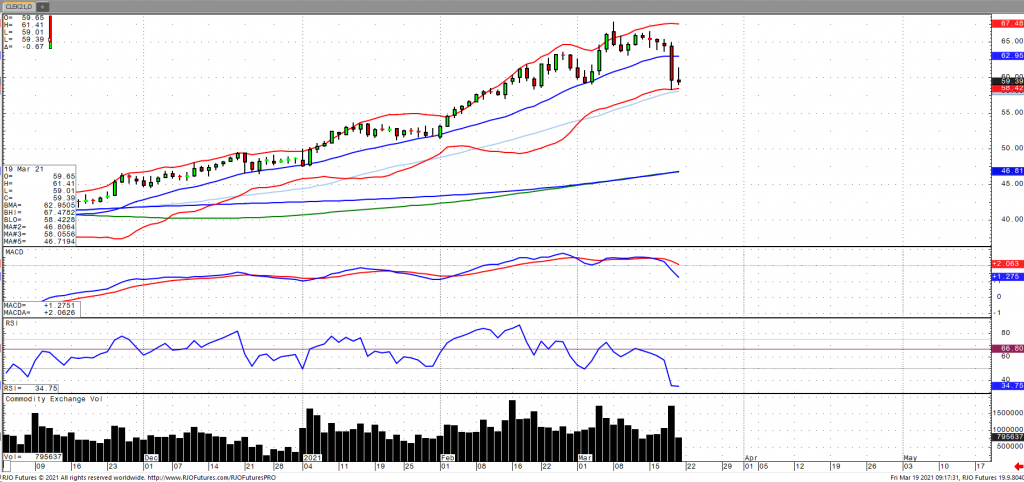
Oil prices have continued to edge lower early Friday following a precipitous drop of over 7% on Thursday amid slowing vaccination progress in Europe renewing concerns about the demand outlook. In addition, US crude inventories rose for the fourth consecutive week, with the EIA reporting a build of 2.4 million barrels. This recent buildup, however, will be eased by an increase in the US operating rate as refinery demand for spot crude ticks up. Other bullish developments include the expectation that Russian daily exports are expected to fall 3% in the 2nd quarter coupled with decline in Chinese stockpiles as well an increase in Chinese oil imports of 12% in February over year ago levels. Most importantly, with the recent spike in oil volatility (OVX) from 37 -48 is the ability to sustain below trend, which comes in around 48 and would suggest the spike is more ‘episodic’ and non-trending in nature. The market remains bullish trend with today’s range seen between 59.76 – 67.97.
Crude Oil May '21 Daily Chart If you have any questions or would like to discuss the markets further, please feel free to contact me at 800-438-4805 or aturro@rjofutures.com. Softs - Coffee Showing Strength
Coffee Showing Strength
By: Adam TuiaanaPosted 03/17/2021
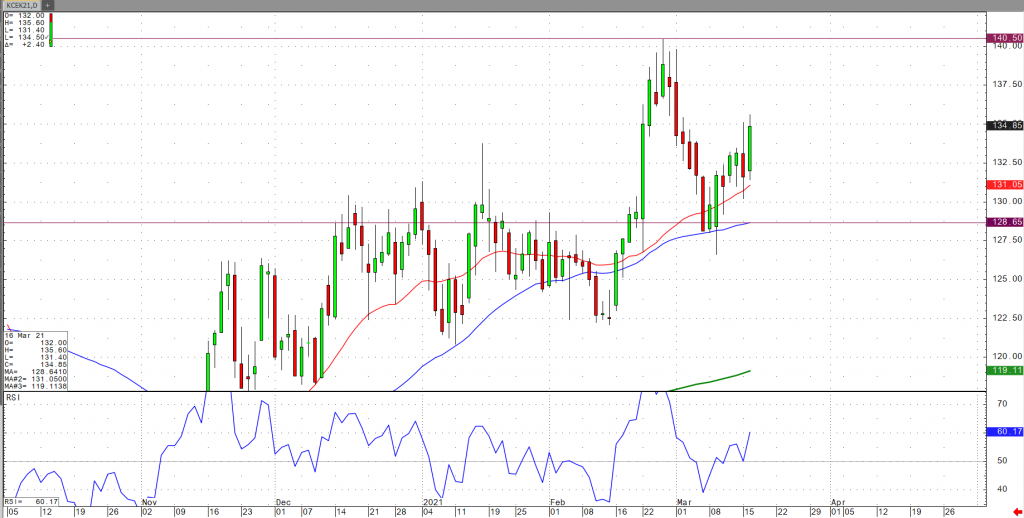
May coffee is looking to
garner support with a very large swing from the 50-day moving average around
the 128 level, up to the 137 level. Since bouncing directly off the 50-day MA
(on March 9th of this year), we can also see a failed outside-day
(down) pattern followed by a massive rally. RSI levels are not yet at
overbought levels, and volumes are high.
Due to ongoing dry weather in key growing areas of Brazil, we can
expect the new crop 21/22 to have some supply side shortage issues which should
continue to support higher May coffee prices. In addition, demand is continuing
to pick up in the US, with stocks rallying to new highs by the day.
We can expect continued support for the foreseeable future, and
new buyers should wait for another pullback to the 1.31 level (25-day moving
average) to ride another leg higher.
For more frequent commentary, please check out and subscribe to my daily futures market videos on coffee and other commodities.
On
the heels of mid-Sep-to-early-Oct's steeper, accelerated, 3rd-wave-looking
recovery, the past week-and-a-half's boringly lateral chop is first considered
a corrective/consolidative event that warns of a continuation of the uptrend
that preceded it to new highs above 04-Oct's 891.0 high. This count
remains consistent with our broader base/correction/recovery count introduced
in 13-Sep's Technical Blog following that
day's bullish divergence in short-term momentum above 07-Sep's 809.5 minor
corrective high detailed in the hourly chart below.
The
important takeaway from this month's lateral, sleepy price action is the
definition of Wed's 851.5 low as
the end or lower boundary of a suspected 4th-Wave correction. A failure
below 851.5 will confirm a bearish divergence in daily momentum and defer or
threaten a bullish count enough to warrant non-bullish decisions like
long-covers. A failure below 851.5 will not
necessarily negate a broader bullish count, but it will threaten it enough to
warrant defensive measures as the next pertinent technical levels below 851.5 are
13-Sep's prospective minor 1st-Wave high at 813.8 and obviously 08-Sep's 766.0
low. And making non-bullish decisions "down there" is
sub-optimal to say the least. Per such, both short- and longer-term
commercial traders are advised to pare or neutralize bullish exposure on a
failure below 851.5, acknowledging and accepting whipsaw risk- back above 04-Oct's
891.0 high- in exchange for much deeper and sub-optimal nominal risk below
766.0.
On
a broader scale, the daily log scale chart above shows the developing potential
for a bearish divergence in daily momentum that will be considered confirmed
below 851.5. This chart also shows the past month's recovery thus far
stalling in the immediate neighborhood of the (888.0) Fibonacci
minimum 38.2% retrace of Apr-Sep's entire 1128 - 766 decline). COMBINED
with a failure below 851.5, traders
would then need to be concerned with at least a larger-degree correction pf the
past month's rally and possibly a resumption of Apr-Sep's major downtrend.
Until
and unless the market fails below 851.5 however, we would
remind longer-term players of the key elements on which our bullish count is
predicated:
a confirmed bullish divergence in WEEKLY momentum
(below)
amidst
an
historically low 11% reading in out RJO Bullish Sentiment Index and
a
textbook complete and major 5-wave Elliott sequence down from 29-Apr's
1128 high to 08-Sep's 766.0 low.
Thus
far, the market is only a month into correcting a 4-MONTH, 32% drawdown, so
further and possibly protracted gains remain well within the bounds of a major
(suspected 2nd-Wave) correction of Apr-Sep's decline within an even more
massive PEAK/reversal process from 17-May's 1219 high on an active continuation
basis below.
These
issues considered, a bullish policy and exposure remain advised with a failure
below 851.5 required to defer or threaten this call enough to warrant moving to
a neutral/sideline position. In lieu of such weakness, we anticipate a
continuation of the past month's rally to new highs and potentially significant
gains above 891.0.
Agricultural - Grain Futures Update w/Stephen Davis - 03/19/2021
Grain Futures Update w/Stephen Davis - 03/19/2021
By: Stephen DavisPosted 03/19/2021
Stephen Davis discusses the latest news making waves in the grain markets and where he expects the market to trend in the coming weeks.Interest Rates - Fed to Keep Interest Rates at Zero
Looking at the June 10-year, we see a high of 132-03 and a
low of 131-00 and currently the market is at 131.065, down 28 ticks on the day.
The yield on the note hit a yearly high this morning of 1.754, this was after Chairman
Powell reiterated yesterday that rates will be kept at zero for an extended
period and the Fed does not mind if inflation shoots over the 2% level. The
problem the central bank is facing is that the market leads fiscal policy and
the market is clearly telling us that rates are on the rise. The next big level
to watch in the 10-year note yield is 2%. If it breaches this level, that will
surly put a damper on stocks. The fed also is cornered now because of the
improving economy and the mass opening that we are seeing across the US. Along
with the improving economy, fiscal stimulus, and unlimited printing of money, the
market is trading like inflation is already here. In my opinion, the fed is
stuck and boxed in. Looking at
technicals, I see support in the June 10-year note at 103-10 and resistance
near 132-05-15. Preferred trading
strategy is to sell rallies.
If you have any questions or would like to discuss the markets further, please feel free to contact me at 800-826-2270 or gperlin@rjofutures.com. Equity - Rising Yields Weigh on Stock Market
Rising Yields Weigh on Stock Market
By: Bill Dixon, Senior Market StrategistPosted Mar 19, 2021 10:08AM CT
Markets continued to fall this morning as 10-year yields are
flirting with 1.75%. Forecasts all seem
to suggest we’ll see that figure north of 2.0% in relatively short order, which
seems to have the equity markets a bit nervous.
Fed Chair Powell addressed inflationary concerns earlier this week,
suggesting that inflation figures may temporarily exceed their 2.0%
target. However, they should tick back down
to 2.0% next year before ticking back up to 2.1% in 2023. He also predicted that we’d see 6.5% GDP
growth this year.
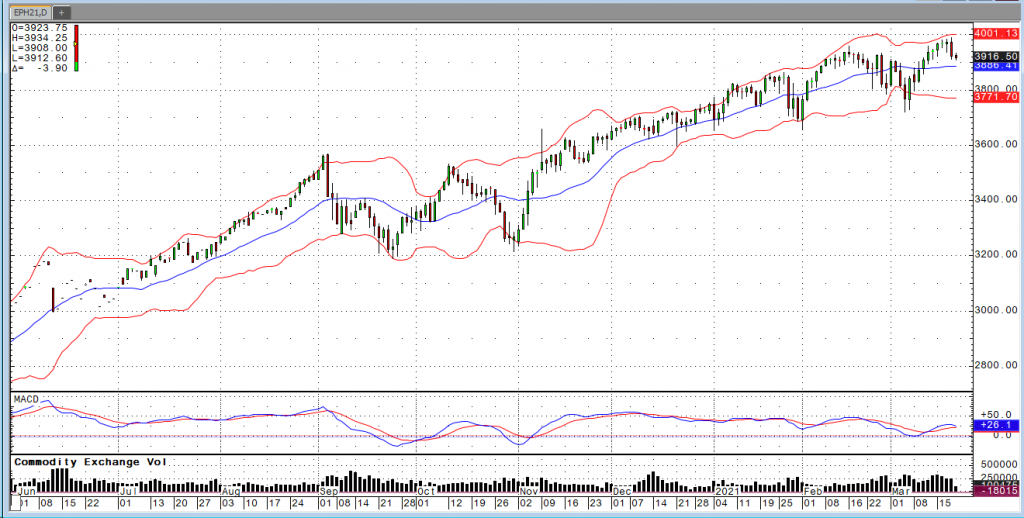
The indices were all lower to start the session, but things seem to be turning back up. The Dow is the weakest, while the Nasdaq and Russell have flipped green. The S&P is still down slightly. The news slate for today is virtually nonexistent, but traders will be looking forward to the home sales numbers on Monday and Tuesday as well as GDP on Thursday.
E-mini S&P 500 Daily Chart If you have any questions or would like to discuss the markets further, please feel free to contact me at 800-669-5354 or bdixon@rjofutures.com. Economy - S-T Mo Failure Insufficient to End RBOB Correction, But Beware
S-T Mo Failure Insufficient to End RBOB Correction, But Beware
By: RJO Market InsightsPosted 11/08/2022
Posted on Nov 08, 2022, 07:51 by Dave Toth
In Fri's Technical Webcast we identified a
minor corrective low at 2.6328 from Thur as a mini risk parameter the market
needed to sustain gains above to maintain a more immediate bullish count.
The 240-min chart below shows the market's failure overnight below this level,
confirming a bearish divergence in very short-term momentum. This mo
failure defines Fri's 2.8172 high as
one of developing importance and a parameter from which very short-term traders
can objectively base non-bullish decisions like long-covers.
Given
the magnitude of the past three weeks' broader recovery however, this
short-term momentum failure is of an insufficient scale to conclude anything
more than another correction within this broader recovery from 26-Sep's 2.1877
low. Indeed, overnights failure below 2.6328 only allows us to conclude
the end of the portion of the month-and-a-half rally from 31-Oct's 2.4822 next
larger-degree corrective low. 2.4822 is the
risk parameter this market still needs to fail below to break the uptrend from
18-Oct's 2.3526 low while this 2.3526 low
remains intact as the risk parameter this market needs to fail below to break
the month-and-a-half uptrend. From an
intermediate-to-longer-term perspective, this week's setback falls well within
the bounds of another correction ahead of further gains. This is another
excellent example of the importance of technical and trading SCALE and
understanding and matching directional risk exposure to one's personal risk
profile.
The
reason overnight's admittedly minor mo failure might have longer-term
importance is the 2.8172-area from which it stemmed. In
Fri's Technical Blog we also noted the market's engagement of the
2.8076-to-2.8159-area marked by the 61.8% retrace of Jun0-Sewp's 3.2758 -2.1877
decline and the 1.000 progression of Sep-Oct's initial 2.1877 - 2.6185
(suspected a-Wave) rally from 18-Oct's 2.3526 (suspected b-Wave) low. We
remind longer-term players that because of the unique and compelling confluence
of:
early-Aug's bearish divergence in WEEKLY momentum
amidst
historically
extreme bullish sentiment/contrary opinion levels in our RJO Bullish
Sentiment Index
an
arguably complete and massive 5-wave Elliott sequence from Mar'20's 0.4605
low to Jun's 4.3260 high (as labeled in the weekly log active-continuation
chart below) and
the
5-wave impulsive sub-division of Jun-Sep's (suspected initial 1st-Wave) decline
The
recovery attempt from 26-Sep's 2.1877 low is arguably only a 3-wave (Wave-2)
corrective rebuttal to Jun-Sep's decline within a massive, multi-quarter
PEAK/reversal process. Now granted, due to the magnitude of 2020 -2022's
secular bull market, we discussed the prospect for this (2nd-Wave corrective)
recovery to be "extensive" in terms of both price and time. A
"more extensive" correction is typified by a retracement of 61.8% or
more and spanning weeks or even months following a 3-month decline. Per
such, the (suspected corrective) recovery from 26-Sep's 2.1877 low could easily
have further to go, with commensurately larger-degree weakness than that
exhibited this week (i.e., a failure below at least 2.4822) required
to consider the correction complete. Indeed, the daily log chart above
shows the market thus far respecting former 2.6185-area resistance from 10-Oct
as a new support candidate.
These
issues considered, very shorter-term traders have been advised to move to a neutral/sideline
position following overnight's momentum failure below 2.6328, with a recovery
above 2.8172 required to negate this call, reaffirm the recovery and re-expose
potentially significant gains thereafter. For intermediate- and
longer-term players, a bullish policy and exposure remain advised with a
failure below 2.4822 required to threaten this call enough to warrant
neutralizing exposure. We will be watchful for another bearish divergence
in momentum following a recovery attempt that falls short of Fri's 2.8172 high
that would be considered the next reinforcing factor to a count calling that
2.8172 high the prospective end to the month-and-a-half 2nd-Wave
correction. In lieu of such, a resumption of the current rally to
eventual new highs above 2.8172 should not surprise.