Coming Next Week: RJO Futures Special Report on Grains
Be on the lookout next week for the RJO Futures Special Report on grains. Report to come out following Wednesday’s Acreage and Planting Intentions Report. Our Special Report will cover the future direction of the grains market following the information divulged in the USDA’s Acreage and Planting Intentions report.
New: E-mini S&P 500 Investor Kit
Historically, the E-mini S&P 500 is one of the most popular and widely traded futures contracts around the world. The reason behind its popularity lies within the leverage it affords the trader, and when you couple that with its accessibility and ease to trade it makes the contract viable to virtually any trader. The S&P 500 hits new highs seemingly every day and now is the perfect time to add it to your portfolio. Complete with actionable trading strategies our E-mini S&P 500 Investor kit is here to help all traders, regardless of experience!
The Markets
Metals - Despite Dollar Strength, Gold Remains Steady
Despite Dollar Strength, Gold Remains Steady
By: Frank J. Cholly, Senior Market StrategistPosted Mar 26, 2021 9:11AM CT
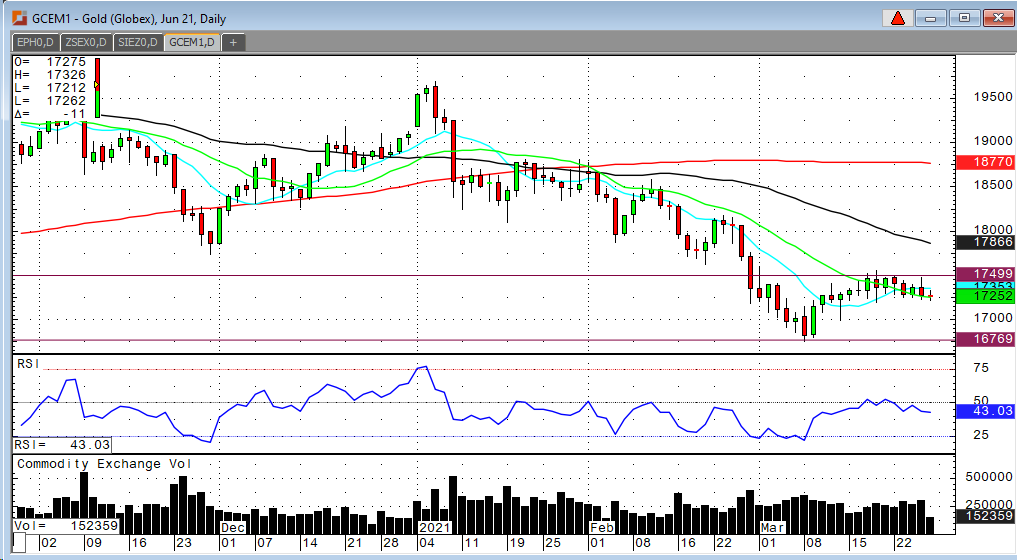
We cannot ignore what is happening in the US Dollar Index
when talking about gold. Gold is holding steady and continues to consolidate as
the Dollar breaks out to highs not seen since mid-November. Even if we see gold
prices drift a little closer to $1,700, I’m confident that gold has bottomed
already. Let’s not forget that 10-year note yields are influencing all other
markets also. Yields have backed off a few BPs and outside markets have
embraced higher rates because thus far they are only back to pre-pandemic
levels. Keep an eye on rates when trading gold. Gold bulls need to see a close
above $1,750 in June gold.
Platinum is searching for a bottom over the past week and a half. Platinum also went thru a sharp downside correction as rates spiked higher. The subsequent bounce has since faded, and it looks like a retest of the early March swing low is in order. Look for some consolidation in the $1,140 range in July platinum.
Gold Jun '21 Daily Chart If you have any questions or would like to discuss the markets further, please feel free to contact me at 800-826-4124 or fcholly@rjofutures.com. Metals - Silver Needs Bullish News
Silver Needs Bullish News
By: Eli Tesfaye, Senior Market StrategistPosted Mar 26, 2021 10:54AM CT
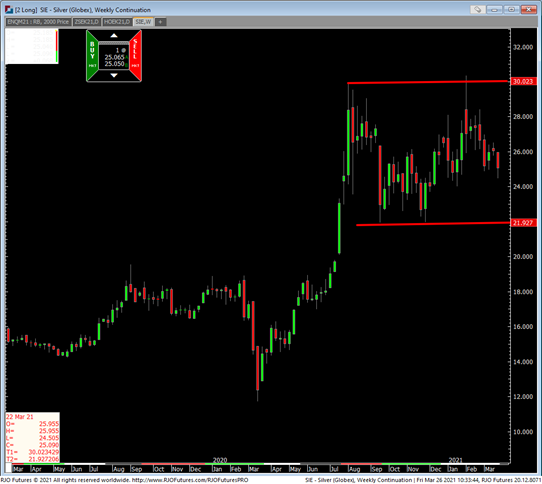
Silver is trading above $25.00 in late hours. The sharp sell-off sparked by rising rates has silver on the defensive. Some good news is that the sharp sell-off was met by a "bargain hunting buy" leaving chart pattern suggesting sideways to higher price action. The dollar index's strength hasn't deterred silver from holding this morning's gain above its psychological level of $25.00. I think there is a strong sentiment among traders that excess liquidity could be a catalyst for inflation. The reality is that rates have been rising to mitigate potential inflation risk. Silver is in desperate need of some bullish news to sustain more upside potential.
From the technical perspective, attached is a continuation weekly Silver chart. As I said a couple of weeks ago, "Silver will trade above $30.00 again before it trades below $20.00. Near term, Silver could pop above $26.50, and traded below $25.00 could trigger a wave near $24.00 ", which was met.
Silver Weekly Chart If you have any questions or would like to discuss the markets further, please feel free to contact me at 800-367-7290 or etesfaye@rjofutures.com. Energy - Oil Poised for Third Consecutive Week of Losses
Oil Poised for Third Consecutive Week of Losses
By: Alex Turro, Senior Market StrategistPosted Mar 26, 2021 9:20AM CT
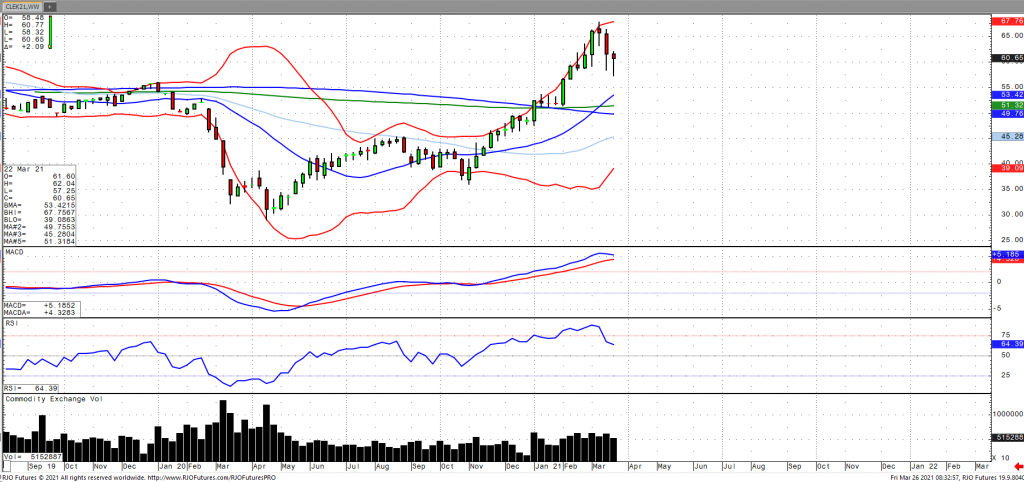
Oil prices appear to be poised for a third consecutive week of losses despite an early lift as concerns that the shipping container that had run aground in the Suez Canal may last for longer than expected, squeezing supply. Renewed restrictions in Europe have added concerns that the global recovery in fuel demand may slow. Oil inventories added to the bearish sentiment as US crude oil stocks ran up to a 30-week high. However, the refinery rate jumped 5.5%, indicating the potential for increased demand for domestic crude. It should be noted that OPEC+ compliance to reduce output came in at 114% last month. Again, most importantly, the push above trend in oil volatility (OVX), which comes in around 48 appears to be more ‘episodic’ and non-trending in nature as the market remains bullish trend with today’s range seen between 56.53 -66.97.
Crude Oil May '21 Daily Chart If you have any questions or would like to discuss the markets further, please feel free to contact me at 800-438-4805 or aturro@rjofutures.com. Softs - Reversal in Cocoa Coming, Due to Increase in Demand
Reversal in Cocoa Coming, Due to Increase in Demand
By: Peter MoosesPosted 03/26/2021
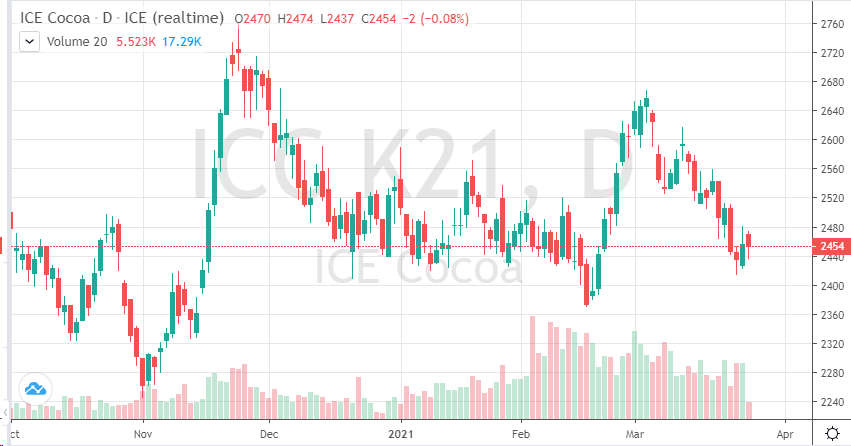
Cocoa
has been on a steady decline since the start of the month. As more vaccines are
administered, the globe will get a better idea of when we can get back to
“normal.” For now, Covid cases are on the rise in certain areas, shutdowns continue,
and employment concerns are very relevant. Fundamentally, cocoa has been one of
the hardest hit commodities of late. Adding and removing shutdowns have created
volatility in cocoa. The recent pullback in the May cocoa can create
opportunities for traders. Clear support in on the chart and a reversal may be
forming. Looking to buy further out calls in the September contract – an
increase in demand in the summer months could help this idea. Also, a
strengthening Pound will help traders find a direction of the market. Of late,
the NY cocoa versus the London cocoa has also been something to watch.
As we move into the 2nd Quarter, monitor cocoa’s key growing regions and what production numbers come in at. Weather will play a big factor in the coming months, hot, dry heat can hurt the crop and also boost the futures prices.
On
the heels of mid-Sep-to-early-Oct's steeper, accelerated, 3rd-wave-looking
recovery, the past week-and-a-half's boringly lateral chop is first considered
a corrective/consolidative event that warns of a continuation of the uptrend
that preceded it to new highs above 04-Oct's 891.0 high. This count
remains consistent with our broader base/correction/recovery count introduced
in 13-Sep's Technical Blog following that
day's bullish divergence in short-term momentum above 07-Sep's 809.5 minor
corrective high detailed in the hourly chart below.
The
important takeaway from this month's lateral, sleepy price action is the
definition of Wed's 851.5 low as
the end or lower boundary of a suspected 4th-Wave correction. A failure
below 851.5 will confirm a bearish divergence in daily momentum and defer or
threaten a bullish count enough to warrant non-bullish decisions like
long-covers. A failure below 851.5 will not
necessarily negate a broader bullish count, but it will threaten it enough to
warrant defensive measures as the next pertinent technical levels below 851.5 are
13-Sep's prospective minor 1st-Wave high at 813.8 and obviously 08-Sep's 766.0
low. And making non-bullish decisions "down there" is
sub-optimal to say the least. Per such, both short- and longer-term
commercial traders are advised to pare or neutralize bullish exposure on a
failure below 851.5, acknowledging and accepting whipsaw risk- back above 04-Oct's
891.0 high- in exchange for much deeper and sub-optimal nominal risk below
766.0.
On
a broader scale, the daily log scale chart above shows the developing potential
for a bearish divergence in daily momentum that will be considered confirmed
below 851.5. This chart also shows the past month's recovery thus far
stalling in the immediate neighborhood of the (888.0) Fibonacci
minimum 38.2% retrace of Apr-Sep's entire 1128 - 766 decline). COMBINED
with a failure below 851.5, traders
would then need to be concerned with at least a larger-degree correction pf the
past month's rally and possibly a resumption of Apr-Sep's major downtrend.
Until
and unless the market fails below 851.5 however, we would
remind longer-term players of the key elements on which our bullish count is
predicated:
a confirmed bullish divergence in WEEKLY momentum
(below)
amidst
an
historically low 11% reading in out RJO Bullish Sentiment Index and
a
textbook complete and major 5-wave Elliott sequence down from 29-Apr's
1128 high to 08-Sep's 766.0 low.
Thus
far, the market is only a month into correcting a 4-MONTH, 32% drawdown, so
further and possibly protracted gains remain well within the bounds of a major
(suspected 2nd-Wave) correction of Apr-Sep's decline within an even more
massive PEAK/reversal process from 17-May's 1219 high on an active continuation
basis below.
These
issues considered, a bullish policy and exposure remain advised with a failure
below 851.5 required to defer or threaten this call enough to warrant moving to
a neutral/sideline position. In lieu of such weakness, we anticipate a
continuation of the past month's rally to new highs and potentially significant
gains above 891.0.
Agricultural - Grain Futures Update w/Stephen Davis - 03/26/2021
Grain Futures Update w/Stephen Davis - 03/26/2021
By: Stephen DavisPosted 03/26/2021
Stephen Davis discusses the latest news impacting the grain futures market, including what he expects from next week's planting intentions report.Agricultural - Live Cattle Trending Higher
Live Cattle Trending Higher
By: Peter McGinnPosted 03/26/2021
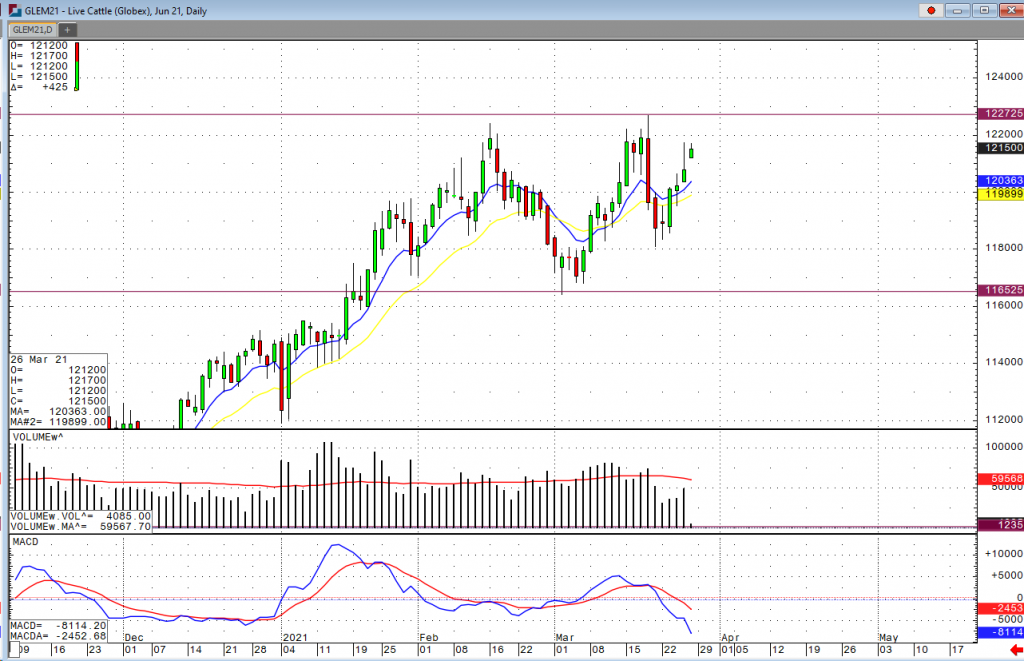
Cash cattle seems to be helping push futures higher, along with the consumer demand starting to pick up as well with the June contract trading at prices we haven’t seen since the march 18th high. The USDA boxed beef cutout was up $1.32 at mid-session yesterday and closed $1.61 higher at $236.45. This was up from $228.61 the previous week and was the highest the cutout had been since March 1. Cash live cattle prices continue to firm. The 5-area weighted average on Thursday was 115.84 up from 114.21 last week. In Kansas, 1,290 head traded at 115-116 with an average of 115.87 up from 113.96 last week. In Nebraska 8,770 head traded at 115-1156 with an average price of 115.96, up from 114.17 last week. Export sales came in yesterday for the week ending March 18 at 18,872 tonnes, down from 25,936 the previous week and the lowest since February 18. The average of the previous four weeks is 19,474. Cumulative sales for 2021 have reached 422,485 tonnes, up from 337,281 last year and the highest on record. The five-year average is 275,823. The largest buyer this week was Japan at 5,828 tonnes, followed by South Korea at 4,440 and China at 3,569. South Korea has the most commitments so far for 2021 at 118,517 tonnes, followed by Japan at 93,983, China at 58,720, and Hong Kong at 47,879. Cattle futures still look to trade higher in the coming days with a near term target for the April contract at $120. June futures I would look tot continue to have more upside potential, but the major pivot point would be around that 122. 75 in the June futures.
Live Cattle Jun '21 Daily ChartEquity - Stock Rebound Continues in Early Going
Stock Rebound Continues in Early Going
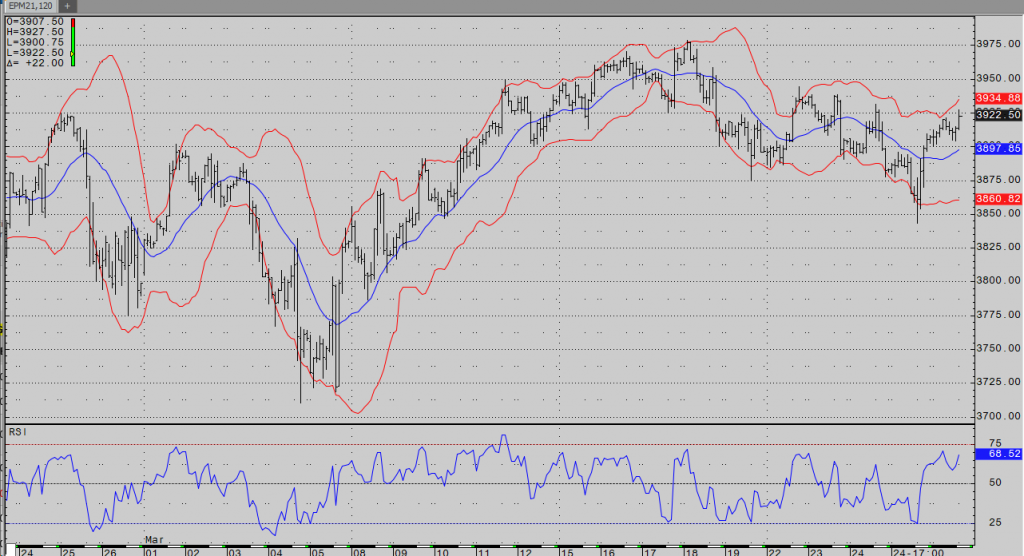
By: Bill Dixon, Senior Market StrategistPosted Mar 26, 2021 9:56AM CT
Strength in international markets helped the indices build upon yesterday’s midday rally in the overnight session. After the bell, all four indices are still higher by a decent margin. On the data front, Personal Income and Outlays came out about as expected (-7.1% vs. expected -7.2%), while we saw a small beat in Consumer Sentiment (84.9 vs. expected 83.3). Yesterday’s GDP reading also came in a bit better than expected (4.3% vs. expected 4.1%). We’ve got a decent amount of data next week, highlighted by the jobs numbers Thursday and Friday.
Coronavirus cases continue to build, but the market seems to have little concern. The fact that vaccines are becoming available to nearly everyone seems to have calmed the market’s nerves on that front. That said, we continue to hear about new stains, which may or may not lead to additional shut down measures globally. Some areas are much further along than others in rolling back restrictions like mask mandates, and we’ll be paying close attention to how things go for those areas. Stay safe and have a great weekend.
S&P 500 120 Min Chart If you have any questions or would like to discuss the markets further, please feel free to contact me at 800-669-5354 or bdixon@rjofutures.com. Economy - S-T Mo Failure Insufficient to End RBOB Correction, But Beware
S-T Mo Failure Insufficient to End RBOB Correction, But Beware
By: RJO Market InsightsPosted 11/08/2022
Posted on Nov 08, 2022, 07:51 by Dave Toth
In Fri's Technical Webcast we identified a
minor corrective low at 2.6328 from Thur as a mini risk parameter the market
needed to sustain gains above to maintain a more immediate bullish count.
The 240-min chart below shows the market's failure overnight below this level,
confirming a bearish divergence in very short-term momentum. This mo
failure defines Fri's 2.8172 high as
one of developing importance and a parameter from which very short-term traders
can objectively base non-bullish decisions like long-covers.
Given
the magnitude of the past three weeks' broader recovery however, this
short-term momentum failure is of an insufficient scale to conclude anything
more than another correction within this broader recovery from 26-Sep's 2.1877
low. Indeed, overnights failure below 2.6328 only allows us to conclude
the end of the portion of the month-and-a-half rally from 31-Oct's 2.4822 next
larger-degree corrective low. 2.4822 is the
risk parameter this market still needs to fail below to break the uptrend from
18-Oct's 2.3526 low while this 2.3526 low
remains intact as the risk parameter this market needs to fail below to break
the month-and-a-half uptrend. From an
intermediate-to-longer-term perspective, this week's setback falls well within
the bounds of another correction ahead of further gains. This is another
excellent example of the importance of technical and trading SCALE and
understanding and matching directional risk exposure to one's personal risk
profile.
The
reason overnight's admittedly minor mo failure might have longer-term
importance is the 2.8172-area from which it stemmed. In
Fri's Technical Blog we also noted the market's engagement of the
2.8076-to-2.8159-area marked by the 61.8% retrace of Jun0-Sewp's 3.2758 -2.1877
decline and the 1.000 progression of Sep-Oct's initial 2.1877 - 2.6185
(suspected a-Wave) rally from 18-Oct's 2.3526 (suspected b-Wave) low. We
remind longer-term players that because of the unique and compelling confluence
of:
early-Aug's bearish divergence in WEEKLY momentum
amidst
historically
extreme bullish sentiment/contrary opinion levels in our RJO Bullish
Sentiment Index
an
arguably complete and massive 5-wave Elliott sequence from Mar'20's 0.4605
low to Jun's 4.3260 high (as labeled in the weekly log active-continuation
chart below) and
the
5-wave impulsive sub-division of Jun-Sep's (suspected initial 1st-Wave) decline
The
recovery attempt from 26-Sep's 2.1877 low is arguably only a 3-wave (Wave-2)
corrective rebuttal to Jun-Sep's decline within a massive, multi-quarter
PEAK/reversal process. Now granted, due to the magnitude of 2020 -2022's
secular bull market, we discussed the prospect for this (2nd-Wave corrective)
recovery to be "extensive" in terms of both price and time. A
"more extensive" correction is typified by a retracement of 61.8% or
more and spanning weeks or even months following a 3-month decline. Per
such, the (suspected corrective) recovery from 26-Sep's 2.1877 low could easily
have further to go, with commensurately larger-degree weakness than that
exhibited this week (i.e., a failure below at least 2.4822) required
to consider the correction complete. Indeed, the daily log chart above
shows the market thus far respecting former 2.6185-area resistance from 10-Oct
as a new support candidate.
These
issues considered, very shorter-term traders have been advised to move to a neutral/sideline
position following overnight's momentum failure below 2.6328, with a recovery
above 2.8172 required to negate this call, reaffirm the recovery and re-expose
potentially significant gains thereafter. For intermediate- and
longer-term players, a bullish policy and exposure remain advised with a
failure below 2.4822 required to threaten this call enough to warrant
neutralizing exposure. We will be watchful for another bearish divergence
in momentum following a recovery attempt that falls short of Fri's 2.8172 high
that would be considered the next reinforcing factor to a count calling that
2.8172 high the prospective end to the month-and-a-half 2nd-Wave
correction. In lieu of such, a resumption of the current rally to
eventual new highs above 2.8172 should not surprise.
Economy - Futures Market Outlook w/John Caruso - 03/26/2021
Futures Market Outlook w/John Caruso - 03/26/2021
By: John Caruso, Senior Market StrategistPosted Mar 26, 2021 9:00AM CT
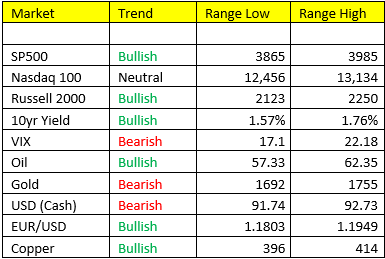
Massive Scenario 2 relief rally in equities yesterday – the SPY bounced right off of our immediate-term trade line of 3851 and low end of our range. The Russell and Nasdaq also went along for the ride higher. But, the undercurrents of the market are swirling. The Russell Index (small cap value stocks), now look the weakest of the major indexes. Value tends to lead on the way up, AND on the way down. So, if markets are in transition phase, the Russell Index may begin to underperform for a brief period of time (especially if we’re going to take a peek at Scenario 4 headed into Q3). I’m well aware of these macro changes, and usually need a little time and space to assess the environment AND we will get this right. But, I’m not going there yet, we remain in Scenario 2 – and these last few day’s may have been the last good opportunity to position for it.
This is how we think 2021 plays out in terms of the
Growth and Inflation cycle are concerned:
Q1/Q2 – Scenario 2 (G accelerating, I accelerating) – this
has been correct – Bullish just about ALL RISK ASSETS
Q3- Scenario 4 (G slowing, I slowing) – Risk Off/Underweight
for equity markets and commodities, Overweight US Dollars and Treasuries
Bond Yields- catch a bid overnight as stocks move
back to “risk on”.
Copper- Bid right off of the low end of our range
overnight. Immediate upside to 414, which yes IS A LOWER HIGH.
Copper remains in a consolidation period, trade the range.
Precious Metals- they look very weak still. Gold and now silver as well. Silver traded below 24.85 early yesterday, before recovering. We can bounce from here, but risk remains tilted on the downside. Silver is the “Moby Dick” aka “the White Whale” trade. Everybody knows the potential in this market and wants to catch it…BUT I’ve seen many men go broke over the years not managing risk appropriately in this space. You don’t want to be like them, nor do I. Gold is a SHORT from the top of our range, and it’s a good possibility I hit the sell button if we get there.
US Dollar- Goes bullish trend IF we climb above 93.30. I remain bearish of the dollar until this happens.
NO MARKET INSIGHTS ON MONDAY AND TUESDAY. I’ll be in transition from the city to the suburbs this weekend and early next week. I should have my office up and running by mid-day Tuesday and fully plan on trading the afternoon session. Bear with me for a few days.
If you have any questions or would like to discuss the markets further, please feel free to contact me at 800-669-5354 or jcaruso@rjofutures.com.