The USDA Planting Intentions Report is our and RJO Futures has you covered. Our Grains Special report covers all the important facts outlined in the USDA report and explains how they will impact the grains market. It looks like grains may go off here soon so don’t miss out!
The Markets
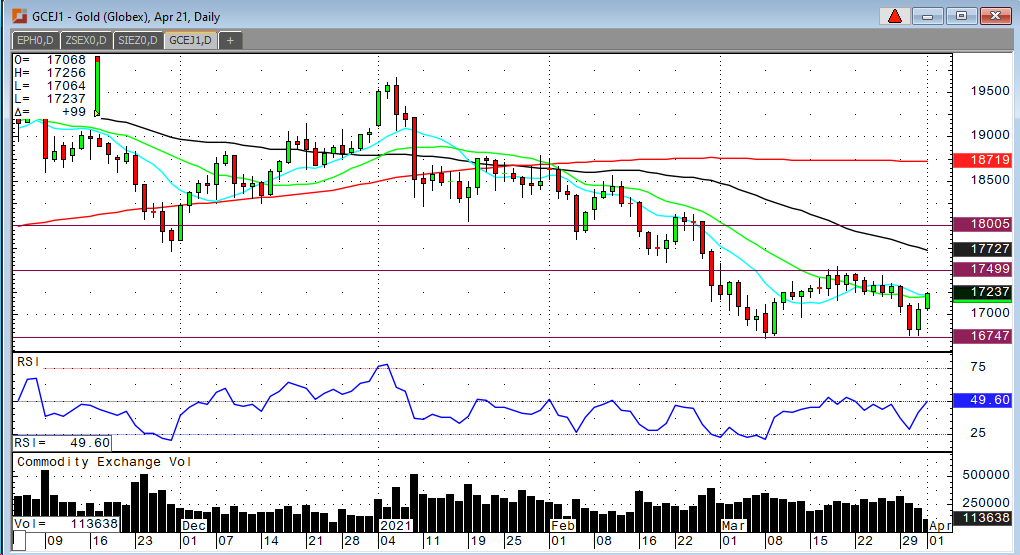
Metals - Gold is Poised to Resume Uptrend
Gold is Poised to Resume Uptrend
By: Frank J. Cholly, Senior Market StrategistPosted Apr 1, 2021 9:10AM CT
Gold has now bounced four times off the $1,675 level. Now we
really need to see a breakout above $1,750! Once again though, you must track
the US Dollar and the 10 Year Note yield. Dollar strength is unsustainable with
the policy coming out of Washington DC. Sure, the rising rates are somewhat
Dollar supportive, but the rising rates are more indicative of the risk of
inflation because of the endless amounts of “stimulus”. The Dollar is being
devalued and the gold rally is technically set to resume its march towards
$1,800. Above $1,800 I see the momentum accelerating. As the Dollar resumes its
downtrend, and I’m confident it will, gold will catch a good bid and final
leave $1,700 in the rearview mirror. Again, markets must get use to a rising
rate environment. If rates are rising due to inflation, then gold will also
rise.
Platinum has also bottomed out around the $1,150 range. A close above $1,200 would be considered bullish as that would be above the 10, 20 and 50 DMAs. I like platinum best of the three precious metals. Platinum has the upward chart direction. The trend is your friend.
Gold Apr '21 Daily Chaaart If you have any questions or would like to discuss the markets further, please feel free to contact me at 800-826-4124 or fcholly@rjofutures.com. Metals - Silver Seeing Mid-Week Bounce
May silver saw a bounce mid-week after starting the week with continued lower trade from last week’s move lower. So far, that strength has pushed it even higher today but the overall trend remains lower. The bounce during Wednesday’s session was partly attributed to Biden’s announcement of an infrastructure plan but the bulls are still looking for a positive US jobs number to really get the inflation chatter started again and start another push to the upside. With May silver hitting key support at $24 this week, we could see some more value buying, especially if there is a continued risk on environment and the stock market continues to do well. The bulls aren’t in the clear yet though with the market having to get through resistance at 25.30 and 25.60 before the trend reverses back to the upside with 26.40 as a short-term target. Failing to get through those resistance levels would likely push silver back down to support at 24.
If you have any questions or would like to discuss the markets further, please feel free to contact me at 800-826-2270 or therrmann@rjofutures.com. Energy - OPEC+ Set to Decide on Production
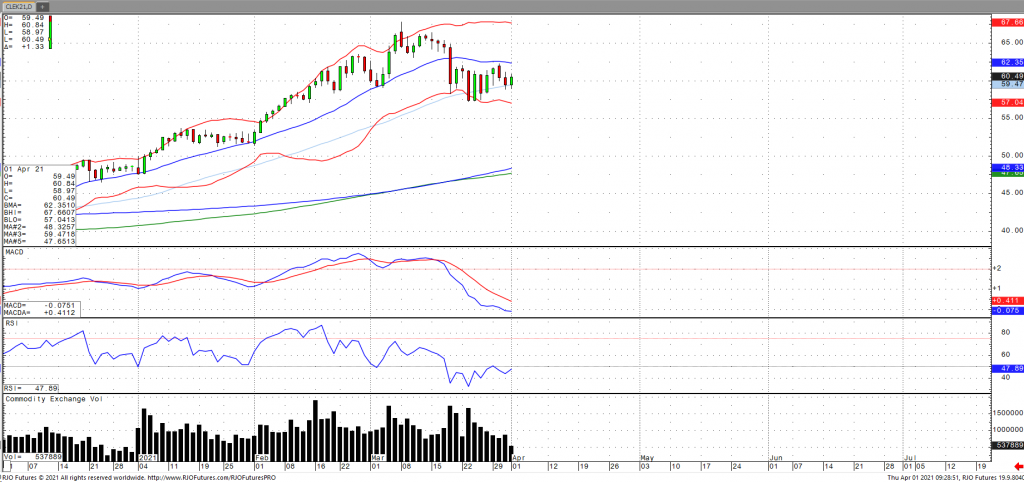
OPEC+ plus are set to decide on a rollover of production restraints through May as demand uncertainty continues to persist. This comes shortly after the reopening of the Suez Canal and amid the ongoing concerns regarding the coronavirus continuing to cloud the outlook, which may lead to the most likely outcomes of having production unchanged from April and for Saudi Arabia continue to withhold an additional 1 million barrels per day. This comes as OPEC+ earlier the week had a downward revision to its ‘demand growth forecast’. Crude stocks fell 876k barrels with the US refinery rate jumping once again for the third consecutive week, according to the EIA. Oil volatility (OVX) continues to fall and remain below trend (~48) with the market remaining bullish trend with today’s range seen between 57.67 – 65.06.
Crude Oil May '21 Daily Chart If you have any questions or would like to discuss the markets further, please feel free to contact me at 800-438-4805 or aturro@rjofutures.com. Softs - Coffee Demand Weak
Coffee Demand Weak
By: Adam TuiaanaPosted 03/30/2021
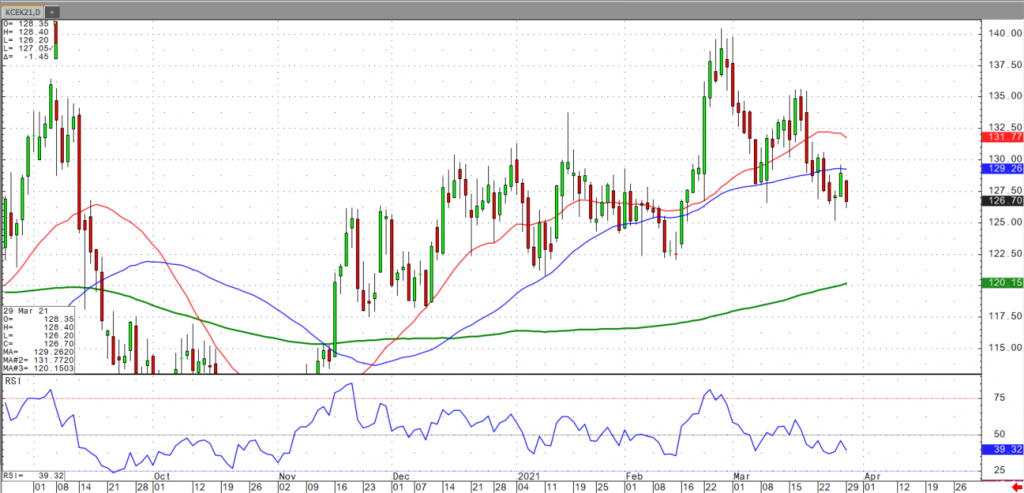
May coffee continues to
struggle with weak demand due to the ongoing slow-but-sure reopening of the
economy. Although the long-term outlook from the worlds largest producer is
still quite bullish, the near term continues to dance along support levels that
have been in place since December of last year. In addition, a continued weak
Brazilian currency promises to hold May coffee prices in check until demand
begins to pick up.
From a technical perspective, May coffee has violated both the 25
and 50-day moving averages. However, May coffee prices have been comfortable in
this range from 1.22 to 1.30 since December of last year. Although RSI levels
are not yet oversold, we may see a continuation in the intermediate selloff
back to the 1.22 level if positive demand news is not found soon.
For more frequent commentary, please check out and subscribe to my daily futures market videos on coffee and other commodities.
On
the heels of mid-Sep-to-early-Oct's steeper, accelerated, 3rd-wave-looking
recovery, the past week-and-a-half's boringly lateral chop is first considered
a corrective/consolidative event that warns of a continuation of the uptrend
that preceded it to new highs above 04-Oct's 891.0 high. This count
remains consistent with our broader base/correction/recovery count introduced
in 13-Sep's Technical Blog following that
day's bullish divergence in short-term momentum above 07-Sep's 809.5 minor
corrective high detailed in the hourly chart below.
The
important takeaway from this month's lateral, sleepy price action is the
definition of Wed's 851.5 low as
the end or lower boundary of a suspected 4th-Wave correction. A failure
below 851.5 will confirm a bearish divergence in daily momentum and defer or
threaten a bullish count enough to warrant non-bullish decisions like
long-covers. A failure below 851.5 will not
necessarily negate a broader bullish count, but it will threaten it enough to
warrant defensive measures as the next pertinent technical levels below 851.5 are
13-Sep's prospective minor 1st-Wave high at 813.8 and obviously 08-Sep's 766.0
low. And making non-bullish decisions "down there" is
sub-optimal to say the least. Per such, both short- and longer-term
commercial traders are advised to pare or neutralize bullish exposure on a
failure below 851.5, acknowledging and accepting whipsaw risk- back above 04-Oct's
891.0 high- in exchange for much deeper and sub-optimal nominal risk below
766.0.
On
a broader scale, the daily log scale chart above shows the developing potential
for a bearish divergence in daily momentum that will be considered confirmed
below 851.5. This chart also shows the past month's recovery thus far
stalling in the immediate neighborhood of the (888.0) Fibonacci
minimum 38.2% retrace of Apr-Sep's entire 1128 - 766 decline). COMBINED
with a failure below 851.5, traders
would then need to be concerned with at least a larger-degree correction pf the
past month's rally and possibly a resumption of Apr-Sep's major downtrend.
Until
and unless the market fails below 851.5 however, we would
remind longer-term players of the key elements on which our bullish count is
predicated:
a confirmed bullish divergence in WEEKLY momentum
(below)
amidst
an
historically low 11% reading in out RJO Bullish Sentiment Index and
a
textbook complete and major 5-wave Elliott sequence down from 29-Apr's
1128 high to 08-Sep's 766.0 low.
Thus
far, the market is only a month into correcting a 4-MONTH, 32% drawdown, so
further and possibly protracted gains remain well within the bounds of a major
(suspected 2nd-Wave) correction of Apr-Sep's decline within an even more
massive PEAK/reversal process from 17-May's 1219 high on an active continuation
basis below.
These
issues considered, a bullish policy and exposure remain advised with a failure
below 851.5 required to defer or threaten this call enough to warrant moving to
a neutral/sideline position. In lieu of such weakness, we anticipate a
continuation of the past month's rally to new highs and potentially significant
gains above 891.0.
Agricultural - Grain Futures Update w/Stephen Davis - 04/01/2021
Grain Futures Update w/Stephen Davis - 04/01/2021
By: Stephen DavisPosted 04/01/2021
Stephen Davis discusses the grain futures market. We saw corn go limit up with yesterday's release of the USDA Plantings Intention's Report and we could see some fresh action in the grain markets because of it.Currency - USD Starting to Breakout
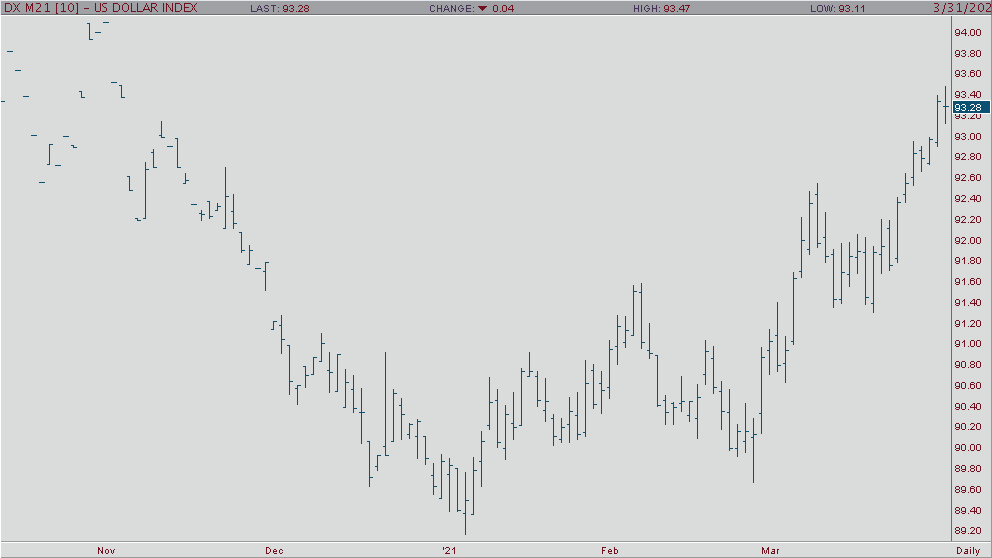
USD Starting to Breakout
By: Tony Cholly, Senior Market StrategistPosted Mar 31, 2021 8:40AM CT
With the USD forging another upside breakout, the market has now filled a gap left by the early November sell off in the USD which in turn could signal an extension to 94.00 level. However, in the event that the USD shows any weakness following favorable US economic data, which includes jobs related data, todays action could be a very valuable trend signal. The bias is up in the USD, but data could present a reversal of a market that is extremely overbought right now. Technical indicators have risen into overbought territory which will tend to support reversal action if it does occur. A positive signal for the trend in the short term was given on a close over the 9-day MA. The next area of resistance is around 93.50 and 93.70 with support coming in at 93.00 and 92.75.
USD Jun '21 Daily Chart If you have any questions or would like to discuss the markets further, please feel free to contact me at 800-826-2270 or tcholly@rjofutures.com. Interest Rates - Increased Stimulus Talks Pushing Interest Rates Higher
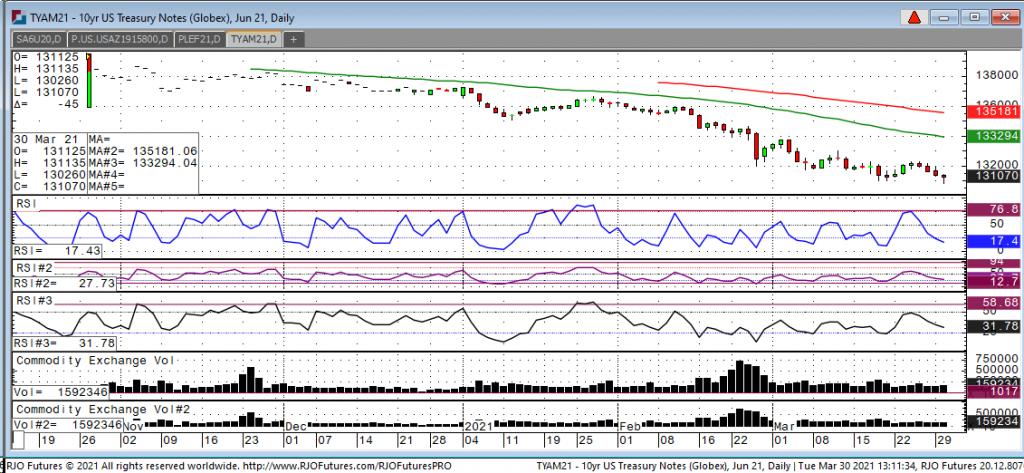
Looking at the June 10-year note today we have a high of 131-135 and a low of 130.26. Earlier this morning, we made a new high on the yield at 1.775 eclipsing the old high of 1.75. The major reason for this push up in yields is the ongoing talk of more stimulus. That is negative for treasuries because the more stimulus people are getting, the hopes are that consumers will spend, which will in turn create inflation. Another reason we continue to see a rise in yield/price decline is because as more states are opening.
The economy is gaining steam and the fed is behind the curve in terms of where rates are and should be going. The problem that the fed has right now is they don’t see the current inflation and they keep stressing that they don’t mind if inflation goes above the so-called magic level of 2%. The market is telling you that the fed is behind the curve and late to the party. All the fed knows is to continue to print money and not realize that there will be severe consequences as they continue with this reckless behavior. Living costs like groceries and gas have been increasing for a while, and those in low-income situations are having an increasingly hard time keeping up.
10-Year Note Jun '21 Daily Chart If you have any questions or would like to discuss the markets further, please feel free to contact me at 800-826-2270 or gperlin@rjofutures.com. Equity - New ATH in S&P 500
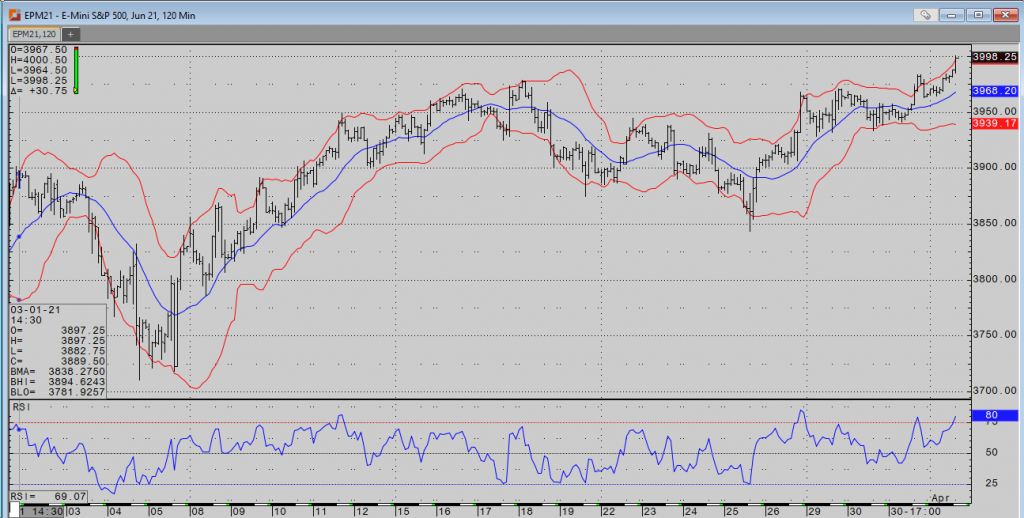
The indices continue to press higher on talks of massive infrastructure spending and falling yields. After creeping north of 1.75% just two days ago, the 10-year yield is now back down to 1.679%. The Nasdaq seems particularly happy about this. June futures are up over 1.5% and trading at their highest levels since 3/2. The June e-mini S&P is up about ¾ of a percent, trading just shy of the 4000 level at 3996.50. The Russel is up a bit over 1%, while the Dow is up slightly (.13%).
On the flip side of all the spending, is the certainty of an uptick in taxes. The focus is once again on corporations and high earners. The latter part was a bit unclear as the story switched from individuals earning over 400k to families and/or individuals earning over 400k. Details seem to be a bit murky, but I’m sure more will be released soon.
The jobs data will be released tomorrow at 7:30am. Equities markets will be open until 8:15, while treasuries and currencies will trade up until 10:15. Stay safe and enjoy your weekend.
E-mini S&P 500 Jun '21 120 Min Chart If you have any questions or would like to discuss the markets further, please feel free to contact me at 800-669-5354 or bdixon@rjofutures.com. Economy - S-T Mo Failure Insufficient to End RBOB Correction, But Beware
S-T Mo Failure Insufficient to End RBOB Correction, But Beware
By: RJO Market InsightsPosted 11/08/2022
Posted on Nov 08, 2022, 07:51 by Dave Toth
In Fri's Technical Webcast we identified a
minor corrective low at 2.6328 from Thur as a mini risk parameter the market
needed to sustain gains above to maintain a more immediate bullish count.
The 240-min chart below shows the market's failure overnight below this level,
confirming a bearish divergence in very short-term momentum. This mo
failure defines Fri's 2.8172 high as
one of developing importance and a parameter from which very short-term traders
can objectively base non-bullish decisions like long-covers.
Given
the magnitude of the past three weeks' broader recovery however, this
short-term momentum failure is of an insufficient scale to conclude anything
more than another correction within this broader recovery from 26-Sep's 2.1877
low. Indeed, overnights failure below 2.6328 only allows us to conclude
the end of the portion of the month-and-a-half rally from 31-Oct's 2.4822 next
larger-degree corrective low. 2.4822 is the
risk parameter this market still needs to fail below to break the uptrend from
18-Oct's 2.3526 low while this 2.3526 low
remains intact as the risk parameter this market needs to fail below to break
the month-and-a-half uptrend. From an
intermediate-to-longer-term perspective, this week's setback falls well within
the bounds of another correction ahead of further gains. This is another
excellent example of the importance of technical and trading SCALE and
understanding and matching directional risk exposure to one's personal risk
profile.
The
reason overnight's admittedly minor mo failure might have longer-term
importance is the 2.8172-area from which it stemmed. In
Fri's Technical Blog we also noted the market's engagement of the
2.8076-to-2.8159-area marked by the 61.8% retrace of Jun0-Sewp's 3.2758 -2.1877
decline and the 1.000 progression of Sep-Oct's initial 2.1877 - 2.6185
(suspected a-Wave) rally from 18-Oct's 2.3526 (suspected b-Wave) low. We
remind longer-term players that because of the unique and compelling confluence
of:
early-Aug's bearish divergence in WEEKLY momentum
amidst
historically
extreme bullish sentiment/contrary opinion levels in our RJO Bullish
Sentiment Index
an
arguably complete and massive 5-wave Elliott sequence from Mar'20's 0.4605
low to Jun's 4.3260 high (as labeled in the weekly log active-continuation
chart below) and
the
5-wave impulsive sub-division of Jun-Sep's (suspected initial 1st-Wave) decline
The
recovery attempt from 26-Sep's 2.1877 low is arguably only a 3-wave (Wave-2)
corrective rebuttal to Jun-Sep's decline within a massive, multi-quarter
PEAK/reversal process. Now granted, due to the magnitude of 2020 -2022's
secular bull market, we discussed the prospect for this (2nd-Wave corrective)
recovery to be "extensive" in terms of both price and time. A
"more extensive" correction is typified by a retracement of 61.8% or
more and spanning weeks or even months following a 3-month decline. Per
such, the (suspected corrective) recovery from 26-Sep's 2.1877 low could easily
have further to go, with commensurately larger-degree weakness than that
exhibited this week (i.e., a failure below at least 2.4822) required
to consider the correction complete. Indeed, the daily log chart above
shows the market thus far respecting former 2.6185-area resistance from 10-Oct
as a new support candidate.
These
issues considered, very shorter-term traders have been advised to move to a neutral/sideline
position following overnight's momentum failure below 2.6328, with a recovery
above 2.8172 required to negate this call, reaffirm the recovery and re-expose
potentially significant gains thereafter. For intermediate- and
longer-term players, a bullish policy and exposure remain advised with a
failure below 2.4822 required to threaten this call enough to warrant
neutralizing exposure. We will be watchful for another bearish divergence
in momentum following a recovery attempt that falls short of Fri's 2.8172 high
that would be considered the next reinforcing factor to a count calling that
2.8172 high the prospective end to the month-and-a-half 2nd-Wave
correction. In lieu of such, a resumption of the current rally to
eventual new highs above 2.8172 should not surprise.