Bitcoin is on an unprecedented run and is at the forefront of the trend in cryptocurrency and as a response, the CME has released a micro Bitcoin futures contract that is 1/10th the size of a regular Bitcoin futures contract. Learn everything you need to trade the micro Bitcoin futures contract with this Investor Kit!
The Markets
Energy - Oil Near Monthly High
Oil Near Monthly High
By: Alex Turro, Senior Market StrategistPosted May 27, 2021 2:10PM CT
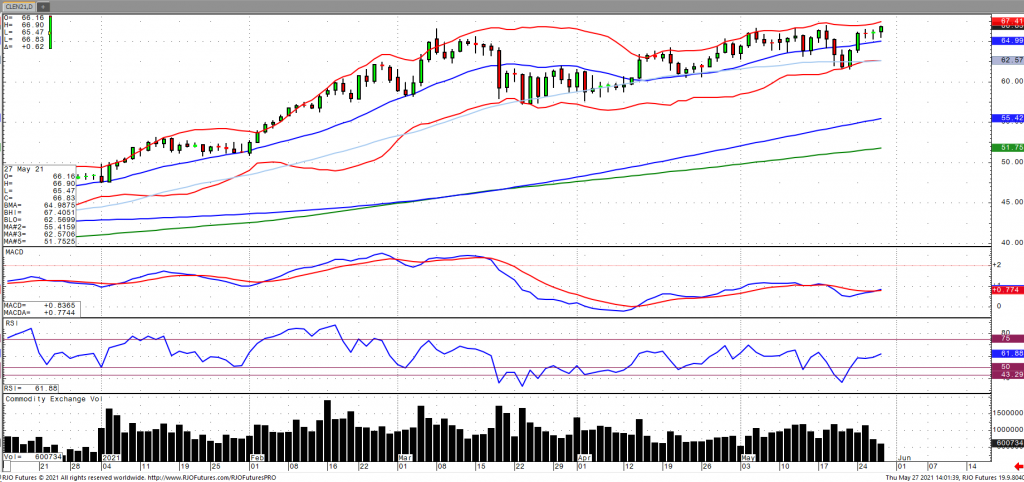
Oil prices are holding steady as of Thursday afternoon enhanced by strong economic data prints with unemployment claims falling more than expected and business spending accelerating in April. Prices have been weighing the prospect of Iranian oil coming back online with OPEC+ set to meet June 1st to assess any potential changes to easing production cuts. Concerns remain regarding Indian demand as Covid-19 has continued to ravish the country, the world’s third largest consumer. Crude stocks fell 1.662 million barrels with implied gasoline readings coming of 9.479 million barrels per day and now approaching an all-time high, according to the EIA. The market remains bullish trend with oil volatility (OVX) continuing to fall towards the 30 handle with today’s range seen between 62.02 – 67.80.
Crude Oil Jun '21 Daily Chart If you have any questions or would like to discuss the markets further, please feel free to contact me at 800-438-4805 or aturro@rjofutures.com. Softs - Smaller Brazil Harvest to Help Support
Smaller Brazil Harvest to Help Support
By: Tony Cholly, Senior Market StrategistPosted May 27, 2021 8:59AM CT
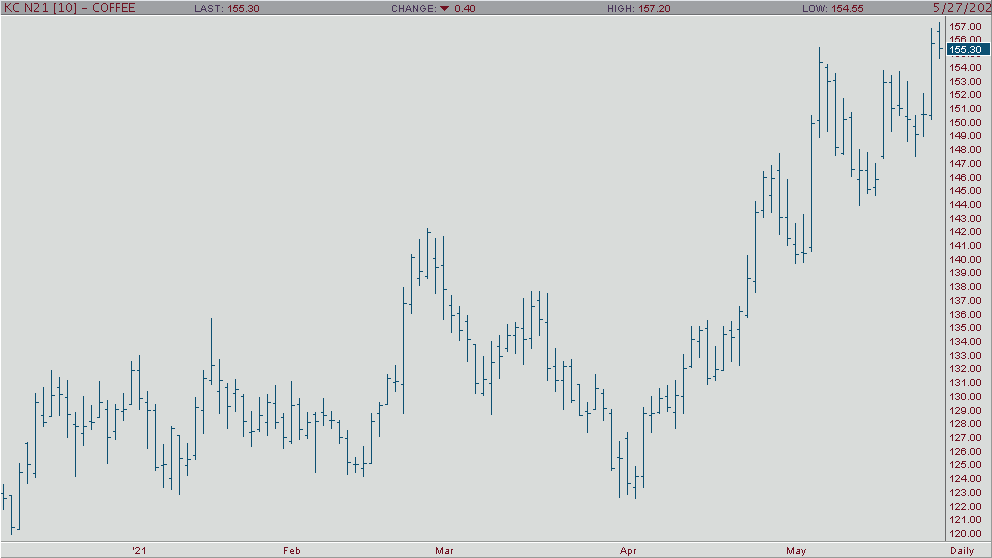
For the second time in a month, coffee prices have broken
out of tight consolidations level with a sharp upside move. Coffee is at
multi-year highs, coffee should be able to maintain upside momentum over the
rest of this week. Diminishing views for brazils 21/22 off year Arabica crop,
have been underscored by the latest forecast from Brazilian government agency
which projects 31% decline from last seasons output. A little more rain has
been added to Brazil weather forecast this week, but then switching back to
mainly dry by next week.
Daily technical indicators have crossed over up, which is a bullish indication. The near term upside objective is at 16120. The next area of resistance is around 15900 and 16120. Support comes in at 15245 and below that at 14800.
Coffee Jul '21 Daily Chart If you have any questions or would like to discuss the markets further, please feel free to contact me at 800-826-2270 or tcholly@rjofutures.com. Agricultural - Bullish Canola Count Intact Above Minimum 851.5
Bullish Canola Count Intact Above Minimum 851.5
By: RJO Market InsightsPosted 10/14/2022
Posted on Oct 14, 2022, 07:42 by Dave Toth
On
the heels of mid-Sep-to-early-Oct's steeper, accelerated, 3rd-wave-looking
recovery, the past week-and-a-half's boringly lateral chop is first considered
a corrective/consolidative event that warns of a continuation of the uptrend
that preceded it to new highs above 04-Oct's 891.0 high. This count
remains consistent with our broader base/correction/recovery count introduced
in 13-Sep's Technical Blog following that
day's bullish divergence in short-term momentum above 07-Sep's 809.5 minor
corrective high detailed in the hourly chart below.
The
important takeaway from this month's lateral, sleepy price action is the
definition of Wed's 851.5 low as
the end or lower boundary of a suspected 4th-Wave correction. A failure
below 851.5 will confirm a bearish divergence in daily momentum and defer or
threaten a bullish count enough to warrant non-bullish decisions like
long-covers. A failure below 851.5 will not
necessarily negate a broader bullish count, but it will threaten it enough to
warrant defensive measures as the next pertinent technical levels below 851.5 are
13-Sep's prospective minor 1st-Wave high at 813.8 and obviously 08-Sep's 766.0
low. And making non-bullish decisions "down there" is
sub-optimal to say the least. Per such, both short- and longer-term
commercial traders are advised to pare or neutralize bullish exposure on a
failure below 851.5, acknowledging and accepting whipsaw risk- back above 04-Oct's
891.0 high- in exchange for much deeper and sub-optimal nominal risk below
766.0.
On
a broader scale, the daily log scale chart above shows the developing potential
for a bearish divergence in daily momentum that will be considered confirmed
below 851.5. This chart also shows the past month's recovery thus far
stalling in the immediate neighborhood of the (888.0) Fibonacci
minimum 38.2% retrace of Apr-Sep's entire 1128 - 766 decline). COMBINED
with a failure below 851.5, traders
would then need to be concerned with at least a larger-degree correction pf the
past month's rally and possibly a resumption of Apr-Sep's major downtrend.
Until
and unless the market fails below 851.5 however, we would
remind longer-term players of the key elements on which our bullish count is
predicated:
a confirmed bullish divergence in WEEKLY momentum
(below)
amidst
an
historically low 11% reading in out RJO Bullish Sentiment Index and
a
textbook complete and major 5-wave Elliott sequence down from 29-Apr's
1128 high to 08-Sep's 766.0 low.
Thus
far, the market is only a month into correcting a 4-MONTH, 32% drawdown, so
further and possibly protracted gains remain well within the bounds of a major
(suspected 2nd-Wave) correction of Apr-Sep's decline within an even more
massive PEAK/reversal process from 17-May's 1219 high on an active continuation
basis below.
These
issues considered, a bullish policy and exposure remain advised with a failure
below 851.5 required to defer or threaten this call enough to warrant moving to
a neutral/sideline position. In lieu of such weakness, we anticipate a
continuation of the past month's rally to new highs and potentially significant
gains above 891.0.
Agricultural - Grain Futures Update w/Stephen Davis - 05/28/2021
Grain Futures Update w/Stephen Davis - 05/28/2021
By: Stephen DavisPosted 05/28/2021
Stephen Davis discusses the grain futures market ahead of the June 30th crop report. We should see things get interesting as we head towards summer.Interest Rates - Interest Rates Doing Surprisingly Well
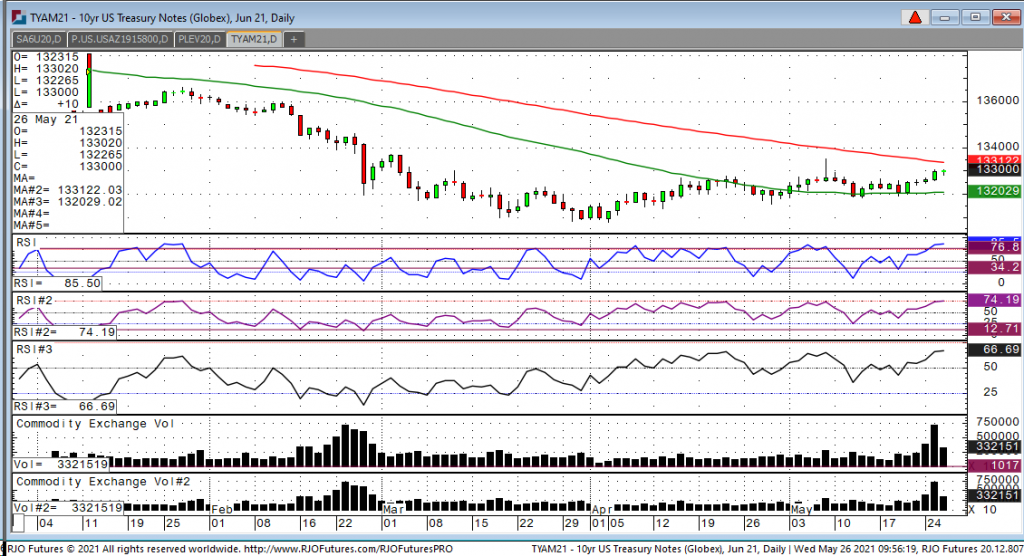
Looking at the June 10-year note this morning, we have a
high of 133-02, a low of 132-265 and currently sit at 133-00. The note has been somewhat of a confusing
trade the last ten days as many Fed speakers have stated that the economy is
robust and acting strong with continued strong economic numbers. Normally when the Fed says things like we see
it as bearish, but the market has been somewhat resilient. In addition, many have continued to express
the need for the Fed to start to taper, meaning buying less treasuries as the
economy is showing good strength. One
explanation of why the treasuries have acted well in the last week is the China
has come out and said it’s concerned with all the volatility we have seen in
many of agricultural sectors and might start to import and purchase less. So, we will see how that plays out for the
rest of the week.
Looking at tecnicals for the note, I see good resistance at 133-125 level which coincides with the 100-day moving average and support comes in at 132-21 which is the 50-day moving average. So, any move above or below those stated levels should start a new leg. Not much in the way of economic news today besides the five-year auction, so barring any big surprises I would expect today’s trade to be quiet and orderly.
10-Year Note Jun '21 Daily Chart If you have any questions or would like to discuss the markets further, please feel free to contact me at 800-826-2270 or gperlin@rjofutures.com. Equity - Stocks Look to Finish Week Strong
Stocks Look to Finish Week Strong
By: Bill Dixon, Senior Market StrategistPosted May 28, 2021 9:47AM CT
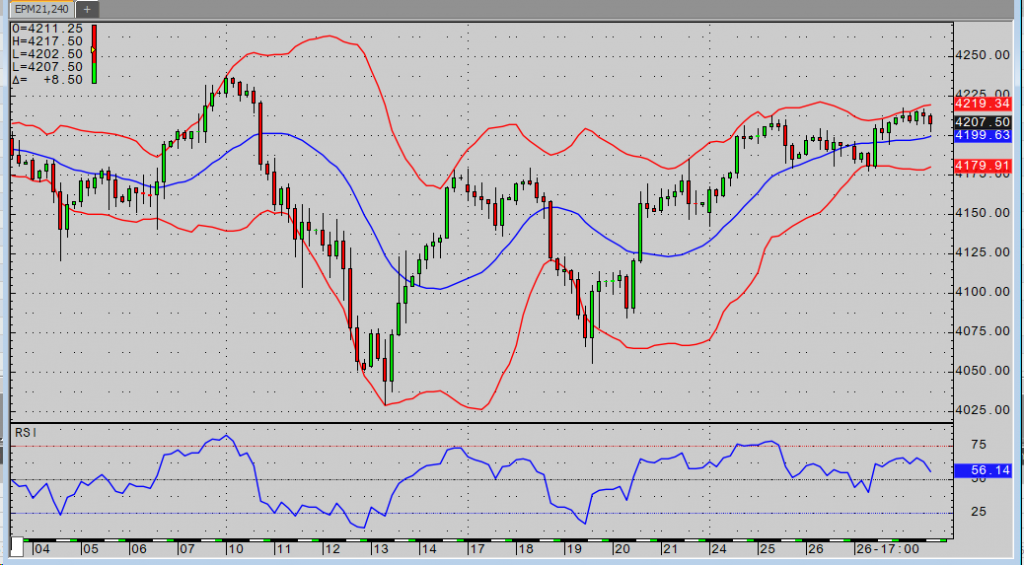
Indices opened strong this morning with the Dow and S&P
making runs at their all-time highs from earlier in the month. The Nasdaq and Russell also look strong, but
they will have a bit more ground to make up before they can say the same. Inflation fears have market participants
worried about the Fed beginning to taper.
We’re seeing more Fed participants suggesting current conditions warrant
a conversation on the topic, but Jerome Powell doesn’t seem to be there just
yet. He has said in the past that he doesn’t
have an issue with letting inflation run a bit hot for a while to compensate
for all the time we spent below their target.
Today’s PCE reading (Fed’s favorite inflation measure) was the highest
in nearly 30 years. Perhaps that will
get him to move off his “transitory” stance at the FOMC meeting in two and a
half weeks.
Personal incomes saw the biggest month over month drop
ever. Combine that with inflation, and
it seems like grounds for… more stimulus! In fact, President Biden will be releasing
more details on his proposed $6 trillion dollar budget at some point
today. That figure would represent the
largest budget increase since World War II.
Equity futures will trade Sunday night and until noon on Monday. I hope everyone has a wonderful Memorial Day weekend.
E-mini S&P 500 Jun '21 Daily Chart If you have any questions or would like to discuss the markets further, please feel free to contact me at 800-669-5354 or bdixon@rjofutures.com. Economy - S-T Mo Failure Insufficient to End RBOB Correction, But Beware
S-T Mo Failure Insufficient to End RBOB Correction, But Beware
By: RJO Market InsightsPosted 11/08/2022
Posted on Nov 08, 2022, 07:51 by Dave Toth
In Fri's Technical Webcast we identified a
minor corrective low at 2.6328 from Thur as a mini risk parameter the market
needed to sustain gains above to maintain a more immediate bullish count.
The 240-min chart below shows the market's failure overnight below this level,
confirming a bearish divergence in very short-term momentum. This mo
failure defines Fri's 2.8172 high as
one of developing importance and a parameter from which very short-term traders
can objectively base non-bullish decisions like long-covers.
Given
the magnitude of the past three weeks' broader recovery however, this
short-term momentum failure is of an insufficient scale to conclude anything
more than another correction within this broader recovery from 26-Sep's 2.1877
low. Indeed, overnights failure below 2.6328 only allows us to conclude
the end of the portion of the month-and-a-half rally from 31-Oct's 2.4822 next
larger-degree corrective low. 2.4822 is the
risk parameter this market still needs to fail below to break the uptrend from
18-Oct's 2.3526 low while this 2.3526 low
remains intact as the risk parameter this market needs to fail below to break
the month-and-a-half uptrend. From an
intermediate-to-longer-term perspective, this week's setback falls well within
the bounds of another correction ahead of further gains. This is another
excellent example of the importance of technical and trading SCALE and
understanding and matching directional risk exposure to one's personal risk
profile.
The
reason overnight's admittedly minor mo failure might have longer-term
importance is the 2.8172-area from which it stemmed. In
Fri's Technical Blog we also noted the market's engagement of the
2.8076-to-2.8159-area marked by the 61.8% retrace of Jun0-Sewp's 3.2758 -2.1877
decline and the 1.000 progression of Sep-Oct's initial 2.1877 - 2.6185
(suspected a-Wave) rally from 18-Oct's 2.3526 (suspected b-Wave) low. We
remind longer-term players that because of the unique and compelling confluence
of:
early-Aug's bearish divergence in WEEKLY momentum
amidst
historically
extreme bullish sentiment/contrary opinion levels in our RJO Bullish
Sentiment Index
an
arguably complete and massive 5-wave Elliott sequence from Mar'20's 0.4605
low to Jun's 4.3260 high (as labeled in the weekly log active-continuation
chart below) and
the
5-wave impulsive sub-division of Jun-Sep's (suspected initial 1st-Wave) decline
The
recovery attempt from 26-Sep's 2.1877 low is arguably only a 3-wave (Wave-2)
corrective rebuttal to Jun-Sep's decline within a massive, multi-quarter
PEAK/reversal process. Now granted, due to the magnitude of 2020 -2022's
secular bull market, we discussed the prospect for this (2nd-Wave corrective)
recovery to be "extensive" in terms of both price and time. A
"more extensive" correction is typified by a retracement of 61.8% or
more and spanning weeks or even months following a 3-month decline. Per
such, the (suspected corrective) recovery from 26-Sep's 2.1877 low could easily
have further to go, with commensurately larger-degree weakness than that
exhibited this week (i.e., a failure below at least 2.4822) required
to consider the correction complete. Indeed, the daily log chart above
shows the market thus far respecting former 2.6185-area resistance from 10-Oct
as a new support candidate.
These
issues considered, very shorter-term traders have been advised to move to a neutral/sideline
position following overnight's momentum failure below 2.6328, with a recovery
above 2.8172 required to negate this call, reaffirm the recovery and re-expose
potentially significant gains thereafter. For intermediate- and
longer-term players, a bullish policy and exposure remain advised with a
failure below 2.4822 required to threaten this call enough to warrant
neutralizing exposure. We will be watchful for another bearish divergence
in momentum following a recovery attempt that falls short of Fri's 2.8172 high
that would be considered the next reinforcing factor to a count calling that
2.8172 high the prospective end to the month-and-a-half 2nd-Wave
correction. In lieu of such, a resumption of the current rally to
eventual new highs above 2.8172 should not surprise.
By: John Caruso, Senior Market StrategistPosted May 25, 2021 11:39AM CT
John talks about the latest developments in the housing market. As home prices continue to climb, buyer are starting to become discouraged, despite historically low interest rates. If you have any questions or would like to discuss the markets further, please feel free to contact me at 800-669-5354 or jcaruso@rjofutures.com.