The difference between historical & implied volatility
How to spot regimes of high and low volatility
Which option strategies to apply and when
How to read price action to support your option trades
New: Micro Bitcoin Investor Kit
Bitcoin is on an unprecedented run and is at the forefront of the trend in cryptocurrency and as a response, the CME has released a micro Bitcoin futures contract that is 1/10th the size of a regular Bitcoin futures contract. Learn everything you need to trade the micro Bitcoin futures contract with this Investor Kit!
The Markets
Metals - Huge Selloff in Gold Could be an Opportunity
Huge Selloff in Gold Could be an Opportunity
By: Frank J. Cholly, Senior Market StrategistPosted Jun 18, 2021 8:45AM CT
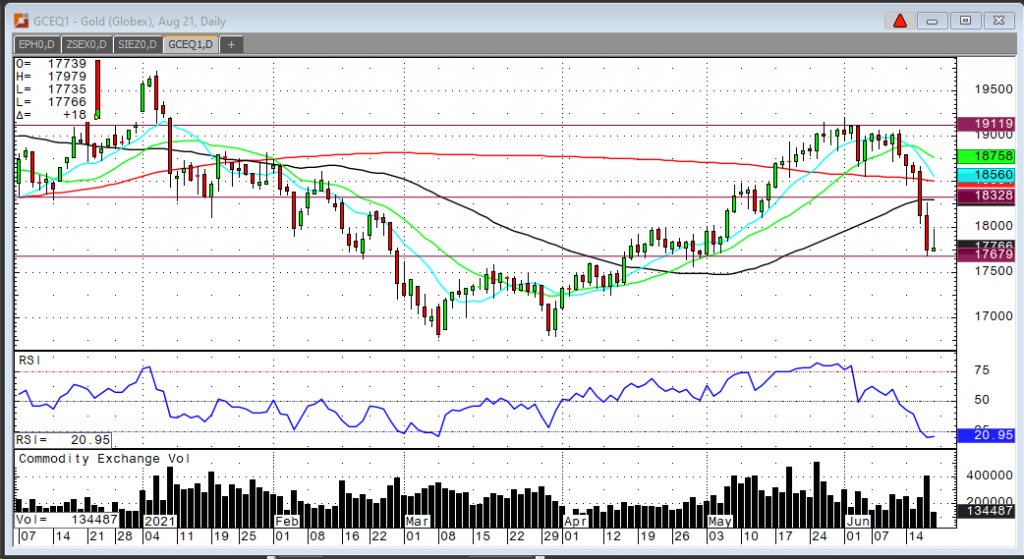
Well the Fed got the ball rolling with a shift in their stance on inflation and rate hikes. We shouldn’t be so surprised because anyone who watches commodities can see that there’s inflation. It’s only a question of how long that inflation will last. So, if the Fed is willing to discuss that the conditions for a rate hike may be met earlier than previously anticipated, then logic dictates that the Fed has a better chance of NOT letting inflation run away out of control. That’s the part that surprised traders. A little bit of confidence in the Fed. I’m not there yet. I don’t believe that a super cycle in commodities can be stopped. I know that I sound like a broken record here, but there’s just too many dollars out there. The money supply grew by 25% in 2020. Rate hikes are still two years away! Gold took off $100 way too fast and should find some decent support around the $1,765 range. So between the Fed announcement, the Dollar rally and all the technical chart damage to gold, I think that there’s another opportunity to buy gold before the big rally.
Gold Aug '21 Daily Chart If you have any questions or would like to discuss the markets further, please feel free to contact me at 800-826-4124 or fcholly@rjofutures.com. Metals - Expect Sideways Movement in Silver
Expect Sideways Movement in Silver
By: Eli Tesfaye, Senior Market StrategistPosted Jun 18, 2021 10:54AM CT
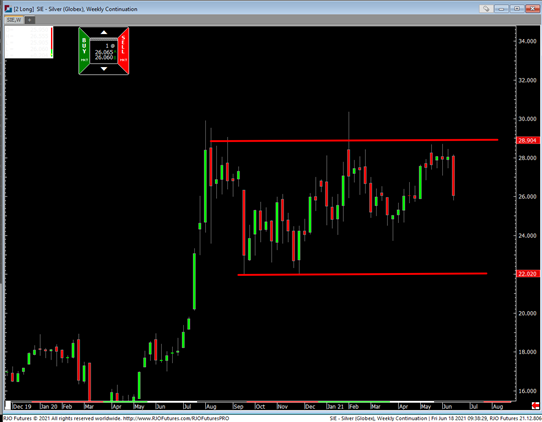
Silver is under pressure this week from a strong dollar. The Fed's hawkish stand from this week's FOMC meeting got metals on the defensive. Currently, silver is at $26.11, up 25 cents. Is that a dead cat bounce? But the chart damage is evident, as seen below on a weekly continuation chart. The bulls will continue to fight to the upside until the Fed actually raises rates. For now, I expect to see sideways to lower price action until the dollar finishes the upside correction. Again, these sideways markets do provide trading opportunities using options. Please reach out to me.
Silver Weekly Chart If you have any questions or would like to discuss the markets further, please feel free to contact me at 800-367-7290 or etesfaye@rjofutures.com. Energy - Oil Slips, but Holds $70
Oil Slips, but Holds $70
By: Alex Turro, Senior Market StrategistPosted Jun 18, 2021 10:03AM CT
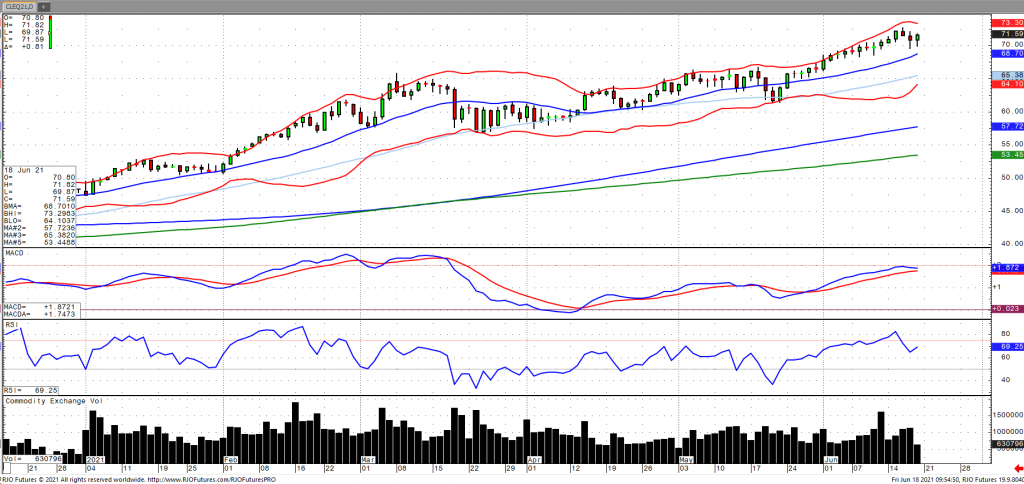
The oil market came under pressure from multi year highs on Thursday as the US Dollar rallied from a more ‘hawkish’ tilt by the Federal Reserve on Wednesday. Oil stockpiles fell sharply by 7.4 million barrels, according to the EIA, as refineries continued to increase operations (US refinery rate at 92.6%), suggesting further improvement in demand prospects. In addition, oil inventories in Europe have reported to have declined by 5.4% last week, lending to the idea of further tightening of global supply. Also lending support were reports that Chinese refinery throughput rose 4.4% in May from year ago levels. Iran is set to have presidential elections on Friday with the outlook for a flood of Iranian supply coming back online becoming increasingly more fleeting. The market remains bullish trend with today’s range seen between 68.66- 72.87.
Crude Oil Aug '21 Daily Chart If you have any questions or would like to discuss the markets further, please feel free to contact me at 800-438-4805 or aturro@rjofutures.com. Softs - Macro Data Controls Market and Cocoa Futures
Macro Data Controls Market and Cocoa Futures
By: Peter MoosesPosted 06/18/2021
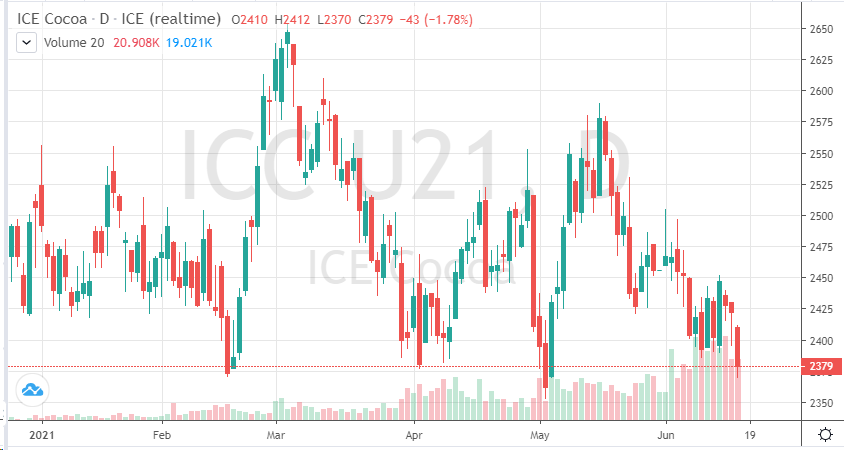
Cocoa
continues its recent downtrend, and this trend was accelerated after Chairman
Powell announced a rate hike would come sooner than expected for the US. All
markets appeared to take a hit after this announcement. Many agriculture
markets were hit the hardest.
Cocoa
futures dropped to test the lows put in early this year. The weakened Euro and
Pound versus the Dollar hurt the potential of a short-term recovery in the
demand for cocoa. Although vaccinations continue and restrictions are lifted,
the demand for chocolate has not returned strong enough. Grinding data will
continue to be critical.
Weather
is also bearish in Ivory Coast. Rains have moved in and have helped the crops
which may produced higher output.
Continue to anticipate a stronger global recovery as we head into Q3. If that occurs, look for cocoa prices to head back to 2500. For now, the day to day trade will continue to be volatile and based on macro data.
On
the heels of mid-Sep-to-early-Oct's steeper, accelerated, 3rd-wave-looking
recovery, the past week-and-a-half's boringly lateral chop is first considered
a corrective/consolidative event that warns of a continuation of the uptrend
that preceded it to new highs above 04-Oct's 891.0 high. This count
remains consistent with our broader base/correction/recovery count introduced
in 13-Sep's Technical Blog following that
day's bullish divergence in short-term momentum above 07-Sep's 809.5 minor
corrective high detailed in the hourly chart below.
The
important takeaway from this month's lateral, sleepy price action is the
definition of Wed's 851.5 low as
the end or lower boundary of a suspected 4th-Wave correction. A failure
below 851.5 will confirm a bearish divergence in daily momentum and defer or
threaten a bullish count enough to warrant non-bullish decisions like
long-covers. A failure below 851.5 will not
necessarily negate a broader bullish count, but it will threaten it enough to
warrant defensive measures as the next pertinent technical levels below 851.5 are
13-Sep's prospective minor 1st-Wave high at 813.8 and obviously 08-Sep's 766.0
low. And making non-bullish decisions "down there" is
sub-optimal to say the least. Per such, both short- and longer-term
commercial traders are advised to pare or neutralize bullish exposure on a
failure below 851.5, acknowledging and accepting whipsaw risk- back above 04-Oct's
891.0 high- in exchange for much deeper and sub-optimal nominal risk below
766.0.
On
a broader scale, the daily log scale chart above shows the developing potential
for a bearish divergence in daily momentum that will be considered confirmed
below 851.5. This chart also shows the past month's recovery thus far
stalling in the immediate neighborhood of the (888.0) Fibonacci
minimum 38.2% retrace of Apr-Sep's entire 1128 - 766 decline). COMBINED
with a failure below 851.5, traders
would then need to be concerned with at least a larger-degree correction pf the
past month's rally and possibly a resumption of Apr-Sep's major downtrend.
Until
and unless the market fails below 851.5 however, we would
remind longer-term players of the key elements on which our bullish count is
predicated:
a confirmed bullish divergence in WEEKLY momentum
(below)
amidst
an
historically low 11% reading in out RJO Bullish Sentiment Index and
a
textbook complete and major 5-wave Elliott sequence down from 29-Apr's
1128 high to 08-Sep's 766.0 low.
Thus
far, the market is only a month into correcting a 4-MONTH, 32% drawdown, so
further and possibly protracted gains remain well within the bounds of a major
(suspected 2nd-Wave) correction of Apr-Sep's decline within an even more
massive PEAK/reversal process from 17-May's 1219 high on an active continuation
basis below.
These
issues considered, a bullish policy and exposure remain advised with a failure
below 851.5 required to defer or threaten this call enough to warrant moving to
a neutral/sideline position. In lieu of such weakness, we anticipate a
continuation of the past month's rally to new highs and potentially significant
gains above 891.0.
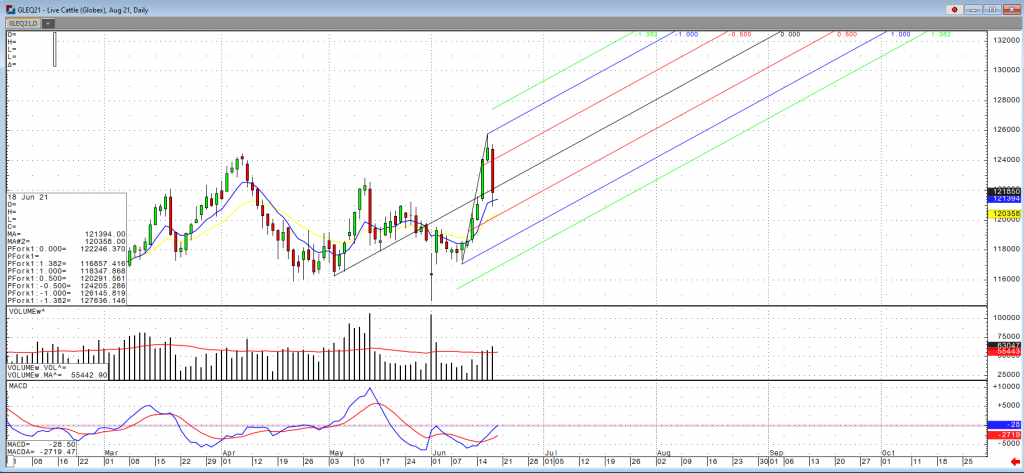
Agricultural - Selloff in Live Cattle
Selloff in Live Cattle
By: Peter McGinnPosted 06/18/2021
Yesterday’s market moves were eye
opening to say the least with most of the AG markets being down anywhere
between 5-7%. The cattle market specifically experienced a massive long
liquidation sell-off that was primarily led by other outside market forces.
After we get the bookings done for July 4th, beef prices usually
trend to the downside but with the year we are seeing this might not happen
with demand factors giving this market support. Cash prices are still looking
strong and trending higher but traders are expecting a short term downside with
the market being in slightly overbought territory and the outside market forces
putting pressure on the market. Cash live cattle are trading higher this week.
The 5-area weighted average price on Thursday was 123.44 versus 120.00 last
week. In Nebraska 1,176 head traded at 124. August cattle closed sharply lower
on the session and gave back all of the gains of the previous 2 sessions
yesterday and a bit more.
US beef export sales for the week ending June 10 came in at 12,828 tonnes, down from 16,075 the previous week and below the average of the previous four weeks at 19,984. Cumulative sales for 2021 have reached 646,076 tonnes, up from 484,275 a week ago and the highest on record. The five-year average is 462,601. The largest buyer this week was Japan at 4,379 tonnes, followed by China at 3,581, South Korea at 1,707, and Taiwan at 1,217. South Korea has purchased the most from the US so far in 2021 at 175,493 tonnes, followed by Japan at 158,210 and China at 102,402. The USDA estimated cattle slaughter came in at 120,000 head yesterday. This brings the total for the week so far to 477,000 head, up from 476,000 last week and 471,000 a year ago. For the month of May, China beef imports from all locations reached 170,000 tons, up 17.3% from a year ago. This pushed year-to-date beef imports to 970,000 tons, up 18.6% from last year's pace.
Live Cattle Aug '21 Daily Chart
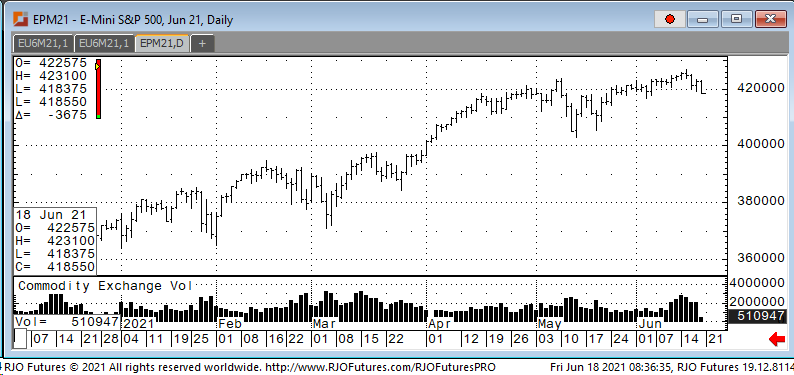
Equity - Stock Futures Down Again Head for Fifth Day of Losses
Stock Futures Down Again Head for Fifth Day of Losses
By: Jeff Yasak, Senior Market StrategistPosted Jun 18, 2021 8:55AM CT
U.S. stock futures dropped Friday, putting the
Dow on pace for its worst weekly performance since the end of January. Futures
tied to the Dow Jones Industrial Average fell 0.8%. The Blue-chip index fell
1.9% this week, leaving it poised for its worst showing since it retreated
almost 3.3% in the last week of January. This
morning also saw the S&P index down .07%. If it continues the benchmark
index could see an end to a three-week streak of gains. Nasdaq-100 futures traded
0.5% lower, due to a drop in large technology stocks at the opening bell. Traders
are also not as optimistic after Federal
Reserve Bank of St. Louis leader James Bullard said on CNBC that he expects the
first Fed increase in late 2022, due to the fact that they have faced more
inflation than it expected, and policy makers need to be nimble, he added. But
it will take more Fed meetings to organize the debate over reducing its
bond-purchase program.
Support today is checking in at 418500and 416500 with resistance 423000 and 424500.
E-mini S&P 500 Jun '21 Daily chart If you have any questions or would like to discuss the markets further, please feel free to contact me at 888-861-1656 or jyasak@rjofutures.com. Economy - S-T Mo Failure Insufficient to End RBOB Correction, But Beware
S-T Mo Failure Insufficient to End RBOB Correction, But Beware
By: RJO Market InsightsPosted 11/08/2022
Posted on Nov 08, 2022, 07:51 by Dave Toth
In Fri's Technical Webcast we identified a
minor corrective low at 2.6328 from Thur as a mini risk parameter the market
needed to sustain gains above to maintain a more immediate bullish count.
The 240-min chart below shows the market's failure overnight below this level,
confirming a bearish divergence in very short-term momentum. This mo
failure defines Fri's 2.8172 high as
one of developing importance and a parameter from which very short-term traders
can objectively base non-bullish decisions like long-covers.
Given
the magnitude of the past three weeks' broader recovery however, this
short-term momentum failure is of an insufficient scale to conclude anything
more than another correction within this broader recovery from 26-Sep's 2.1877
low. Indeed, overnights failure below 2.6328 only allows us to conclude
the end of the portion of the month-and-a-half rally from 31-Oct's 2.4822 next
larger-degree corrective low. 2.4822 is the
risk parameter this market still needs to fail below to break the uptrend from
18-Oct's 2.3526 low while this 2.3526 low
remains intact as the risk parameter this market needs to fail below to break
the month-and-a-half uptrend. From an
intermediate-to-longer-term perspective, this week's setback falls well within
the bounds of another correction ahead of further gains. This is another
excellent example of the importance of technical and trading SCALE and
understanding and matching directional risk exposure to one's personal risk
profile.
The
reason overnight's admittedly minor mo failure might have longer-term
importance is the 2.8172-area from which it stemmed. In
Fri's Technical Blog we also noted the market's engagement of the
2.8076-to-2.8159-area marked by the 61.8% retrace of Jun0-Sewp's 3.2758 -2.1877
decline and the 1.000 progression of Sep-Oct's initial 2.1877 - 2.6185
(suspected a-Wave) rally from 18-Oct's 2.3526 (suspected b-Wave) low. We
remind longer-term players that because of the unique and compelling confluence
of:
early-Aug's bearish divergence in WEEKLY momentum
amidst
historically
extreme bullish sentiment/contrary opinion levels in our RJO Bullish
Sentiment Index
an
arguably complete and massive 5-wave Elliott sequence from Mar'20's 0.4605
low to Jun's 4.3260 high (as labeled in the weekly log active-continuation
chart below) and
the
5-wave impulsive sub-division of Jun-Sep's (suspected initial 1st-Wave) decline
The
recovery attempt from 26-Sep's 2.1877 low is arguably only a 3-wave (Wave-2)
corrective rebuttal to Jun-Sep's decline within a massive, multi-quarter
PEAK/reversal process. Now granted, due to the magnitude of 2020 -2022's
secular bull market, we discussed the prospect for this (2nd-Wave corrective)
recovery to be "extensive" in terms of both price and time. A
"more extensive" correction is typified by a retracement of 61.8% or
more and spanning weeks or even months following a 3-month decline. Per
such, the (suspected corrective) recovery from 26-Sep's 2.1877 low could easily
have further to go, with commensurately larger-degree weakness than that
exhibited this week (i.e., a failure below at least 2.4822) required
to consider the correction complete. Indeed, the daily log chart above
shows the market thus far respecting former 2.6185-area resistance from 10-Oct
as a new support candidate.
These
issues considered, very shorter-term traders have been advised to move to a neutral/sideline
position following overnight's momentum failure below 2.6328, with a recovery
above 2.8172 required to negate this call, reaffirm the recovery and re-expose
potentially significant gains thereafter. For intermediate- and
longer-term players, a bullish policy and exposure remain advised with a
failure below 2.4822 required to threaten this call enough to warrant
neutralizing exposure. We will be watchful for another bearish divergence
in momentum following a recovery attempt that falls short of Fri's 2.8172 high
that would be considered the next reinforcing factor to a count calling that
2.8172 high the prospective end to the month-and-a-half 2nd-Wave
correction. In lieu of such, a resumption of the current rally to
eventual new highs above 2.8172 should not surprise.
Economy - Futures Market Outlook w/John Caruso - 06/18/2021
Futures Market Outlook w/John Caruso - 06/18/2021
By: John Caruso, Senior Market StrategistPosted Jun 18, 2021 8:42AM CT
Good morning,
Reminder: It’s triple witching day with all the Jun Indices
set to expire at the open today, so be mindful if you’re still in June
Stocks.
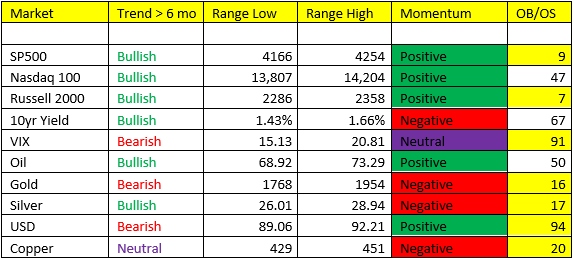
Yesterday’s post Fed action was interesting to say the least. We’re currently sitting on a big time immediate OB signal in the US Dollar following its ramp on J Powell’s “talking about talking about tapering” lingo. And with an OB USD, we’ve got a slew of immediate OS signals in the commodity space this morning.
Yields/Stocks: we got a lot of movement over the past 24hrs in bond yields (10-12bps) but coming into this morning, we’re sitting at 1.48% basically UNCH pre-FOMC meeting. I’m watching the 1.42% level for any signs a near-term Bond yield “breakdown” – but rest assured, bond yields are likely heading markedly higher over the course of the next 6-12months. Maybe the biggest stand out to me was the “flattening of the curve” post Fed where short-term yields rose faster than long-term yields – this is why our 30yr vs 10yr spread missed the mark, but our short 10yr out rights played well. A flattening yield curve usually portends something ominous from a macroeconomic standpoint – this is why it would not shock me to see an immediate-term break down in yields to be honest, followed by an equity correction in July/Aug time period. We’ve seen some commodity deleveraging over the past few sessions, equities may be next. However, I do still think there’s short-term long side trade potential in the near-term for stocks. Head on a swivel.
Energy- I’m on the watch for a pull-back here, we will be buyers of Crude Oil if we get that look. Crude -1.00% pre market hovering around 70 BBL. The inflation trade IS NOT OVER from our perspective, but we likely take a pause in Q3 – and I think we’ve made this abundantly clear from our “Shallow” Scenario 4 in Q3 calls.
Metals- We sent out the Silver buy yesterday, we did have a very small existing long position for the record. We like metals here, specifically IF we are going to see a minor “pause” in the inflation cycle, but inflation OR Stagflation rather, likely reignites again in Q4. If you’re having trouble following my outlook….its a minor slowdown in Q3 followed by a re-start of the REFLATION/INFLATION trade in Q4. Scenario 3 (STAGFLATION) in Q4 is the call – this is where Gold and Silver BULL markets live. We had the STAGFLATION Call on in Q3 of last year, and we saw some pretty materially gains in Gold and Silver during that time period. This doesn’t mean we can’t probe lower in the immediate-term but if Bond yields sniff out a slowdown and begin to back-up, this would make a very strong case for DOWN RATES = DOWN Dollar, UP Gold, UP Silver. With that said, we could eat some garbage in the near-term – stay small and watch what bond yields do from here.
Good luck,
Notable: *A higher high in the Gold and Silver range is registering as the market squeezes traders that CHASED at the highs.
*A lot of “yellow” highlights below on immediate OB and OS signals.
If you have any questions or would like to discuss the markets further, please feel free to contact me at 800-669-5354 or jcaruso@rjofutures.com.