New Special Report: Inflation, How Much is Too Much?
With so much money in the market, coupled with weakened supply chains and workforces due to the fallout of Covid-19, we are seeing a rampant run on inflation. Prices from everything to lumber, oil, and groceries are up. Learn why this is happening, how long it will go on for, and how to protect yourself with this Special Report!
4th of July: Freedom From Commissions
Receive free commissions when you open and fund an account in the month of July! This is one firecracker you don’t want to miss!
The Markets
Metals - Golden Cross in Gold?
Golden Cross in Gold?
By: Frank J. Cholly, Senior Market StrategistPosted Jul 9, 2021 9:07AM CT
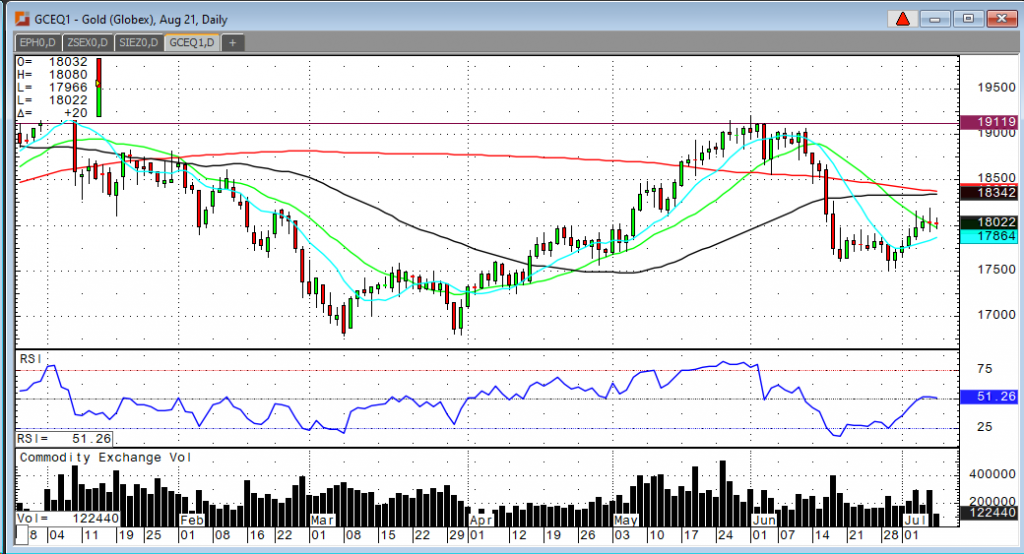
Look for gold to take a breather before the next leg up. It will not take much in terms of a rally to cause the 50 DMA to cross through and above the 200 DMA. Gold needs to push thru the $1,820 level and we should quickly be challenging the $1,850 range. At that point traders will start looking at a “Golden Cross”. The “Golden Cross” is a very strong buy signal in gold. We do need to see a close above $1,820 for some confirmation that the gold rally is going to follow through. The US Dollar and of course the Treasury yields are markets that you must pay some attention to. I’m somewhat surprised by the recent big move down in yields. I think rates need to move higher over time and that inflation is unavoidable regardless of rate hikes. Inflation will be the catalyst that takes gold back above $2,000 and beyond to new all-time highs.
Gold Aug '21 Daily Chart If you have any questions or would like to discuss the markets further, please feel free to contact me at 800-826-4124 or fcholly@rjofutures.com. Energy - Oil Rebounds Following Inventory Decline
Oil prices have rebounded off their Thursday low following a greater than expected draw in both oil and gasoline inventories. Oil inventories fell -6.9 million barrels for the seventh consecutive week with gasoline inventories falling l -6.1 million barrels despite a refinery utilization rate of 92.2%, suggesting strong domestic demand ahead, according to the EIA. This comes amidst a fallout in discussion within OPEC+ as the market continues to assess global oil supplies with disagreements regarding output between Saudi Arabia and the United Arab Emirates continuing to persist with a third of UAE’s production now sitting idle – more than any other OPEC+ nation. This is coupled with the prospect of more Iranian oil coming back online as economic sanctions could potentially be lifted in exchange for nuclear restrictions. Concerns regarding a resurgence of the coronavirus and the Delta variant remain as Japan declared a state of emergency prior to the start of the Olympic games. The market remains bullish trend with today’s range seen between 71.49 – 75.85.
Crude Oil Aug '21 Daily Chart
If you have any questions or would like to discuss the markets further, please feel free to contact me at 800-438-4805 or aturro@rjofutures.com. Softs - Coffee Approaching Oversold Levels
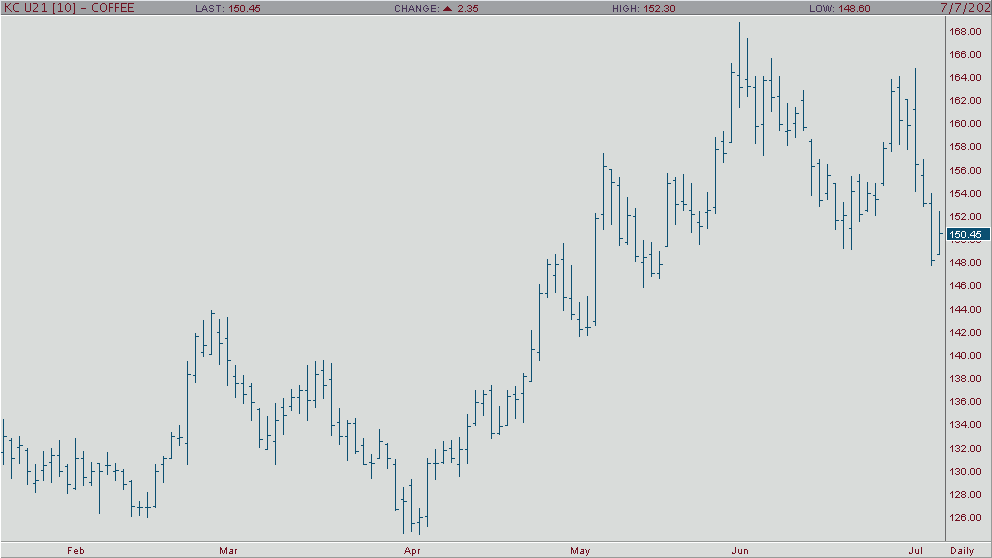
Coffee prices have fallen more than 10% from last weeks
highs, as the market has seen an abrupt change in tone since the start of the
month. While it may still have a bullish supply/demand setup for the longer
term, it could remain on the defensive this week if the risk off mood persists.
September coffee had another range down move on Tuesday and fell to its lowest
levels since May. A pullback in the Brazilian currency to a new 5 week low,
added to the woes as that could encourage Brazilian growers to aggressively
market their product overseas.
The market is back below the 60-day moving average and suggests the longer-term trend could be turning down. The markets close below the 9-day moving average is an indication the shorter term trend remains negative. Resistance comes in at 15125 and 15565 while support is at 14510 and 14325.
Coffee Sep '21 Daily Chart If you have any questions or would like to discuss the markets further, please feel free to contact me at 800-826-2270 or tcholly@rjofutures.com. Agricultural - Bullish Canola Count Intact Above Minimum 851.5
Bullish Canola Count Intact Above Minimum 851.5
By: RJO Market InsightsPosted 10/14/2022
Posted on Oct 14, 2022, 07:42 by Dave Toth
On
the heels of mid-Sep-to-early-Oct's steeper, accelerated, 3rd-wave-looking
recovery, the past week-and-a-half's boringly lateral chop is first considered
a corrective/consolidative event that warns of a continuation of the uptrend
that preceded it to new highs above 04-Oct's 891.0 high. This count
remains consistent with our broader base/correction/recovery count introduced
in 13-Sep's Technical Blog following that
day's bullish divergence in short-term momentum above 07-Sep's 809.5 minor
corrective high detailed in the hourly chart below.
The
important takeaway from this month's lateral, sleepy price action is the
definition of Wed's 851.5 low as
the end or lower boundary of a suspected 4th-Wave correction. A failure
below 851.5 will confirm a bearish divergence in daily momentum and defer or
threaten a bullish count enough to warrant non-bullish decisions like
long-covers. A failure below 851.5 will not
necessarily negate a broader bullish count, but it will threaten it enough to
warrant defensive measures as the next pertinent technical levels below 851.5 are
13-Sep's prospective minor 1st-Wave high at 813.8 and obviously 08-Sep's 766.0
low. And making non-bullish decisions "down there" is
sub-optimal to say the least. Per such, both short- and longer-term
commercial traders are advised to pare or neutralize bullish exposure on a
failure below 851.5, acknowledging and accepting whipsaw risk- back above 04-Oct's
891.0 high- in exchange for much deeper and sub-optimal nominal risk below
766.0.
On
a broader scale, the daily log scale chart above shows the developing potential
for a bearish divergence in daily momentum that will be considered confirmed
below 851.5. This chart also shows the past month's recovery thus far
stalling in the immediate neighborhood of the (888.0) Fibonacci
minimum 38.2% retrace of Apr-Sep's entire 1128 - 766 decline). COMBINED
with a failure below 851.5, traders
would then need to be concerned with at least a larger-degree correction pf the
past month's rally and possibly a resumption of Apr-Sep's major downtrend.
Until
and unless the market fails below 851.5 however, we would
remind longer-term players of the key elements on which our bullish count is
predicated:
a confirmed bullish divergence in WEEKLY momentum
(below)
amidst
an
historically low 11% reading in out RJO Bullish Sentiment Index and
a
textbook complete and major 5-wave Elliott sequence down from 29-Apr's
1128 high to 08-Sep's 766.0 low.
Thus
far, the market is only a month into correcting a 4-MONTH, 32% drawdown, so
further and possibly protracted gains remain well within the bounds of a major
(suspected 2nd-Wave) correction of Apr-Sep's decline within an even more
massive PEAK/reversal process from 17-May's 1219 high on an active continuation
basis below.
These
issues considered, a bullish policy and exposure remain advised with a failure
below 851.5 required to defer or threaten this call enough to warrant moving to
a neutral/sideline position. In lieu of such weakness, we anticipate a
continuation of the past month's rally to new highs and potentially significant
gains above 891.0.
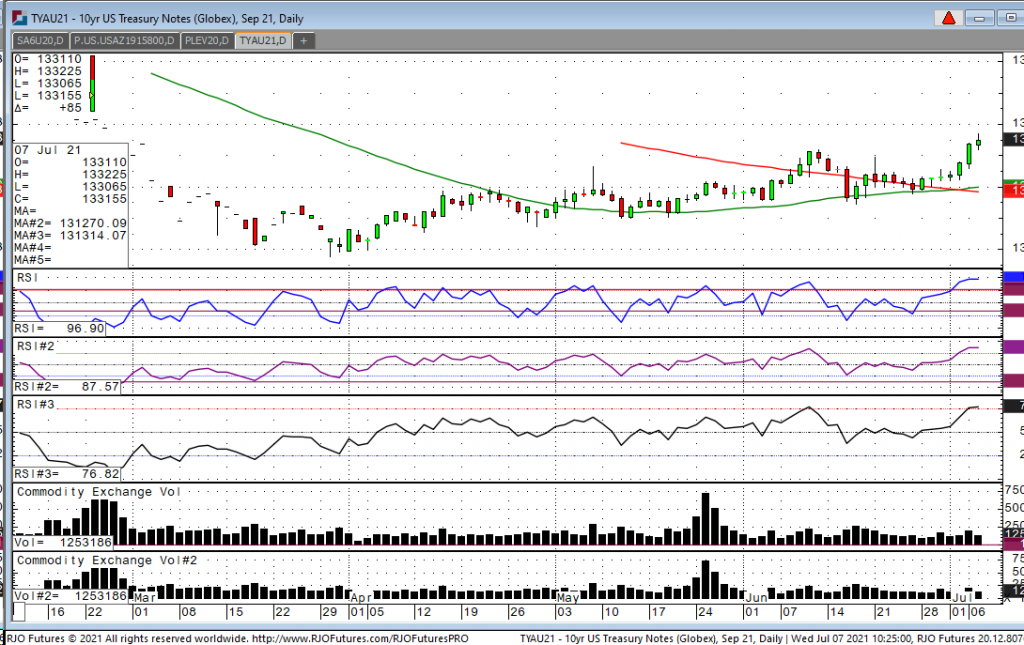
Looking at the September 10-year note this morning, we have seen the rally continue with note trading as high as 133-225 and a low last night at 133-065. As chairman Powell has suggested all along he believes the rise in inflation that we have seen in the past few months, including the big rise last month in the CPI index, should subside and he continues to see the push higher in commodities as transitory. We have certainly seen the price of grains fall back rather substantially. Lumber, which was making all-time highs two months ago, has given back at least half of its gains. Another market that has been on a tear lately has been the price of oil with WTI for August hitting $76.98 a barrel yesterday. This are ongoing talks with OPEC+ about the hope of pumping more oil to halt this commodity from getting out of control. As of yesterday, a few countries are having a hard time agreeing on the amount of production increases there should be and due to the inability to come to an agreement we saw the big spike yesterday. Currently, we see Aug trading at 7180, so were down about $6 from yesterday’s high. Hopefully OPEC will get a deal done soon as something may be in the works behind the scene.
10yr Note Sep '21 Daily Chart If you have any questions or would like to discuss the markets further, please feel free to contact me at 800-826-2270 or gperlin@rjofutures.com. Equity - Stocks Rebounding
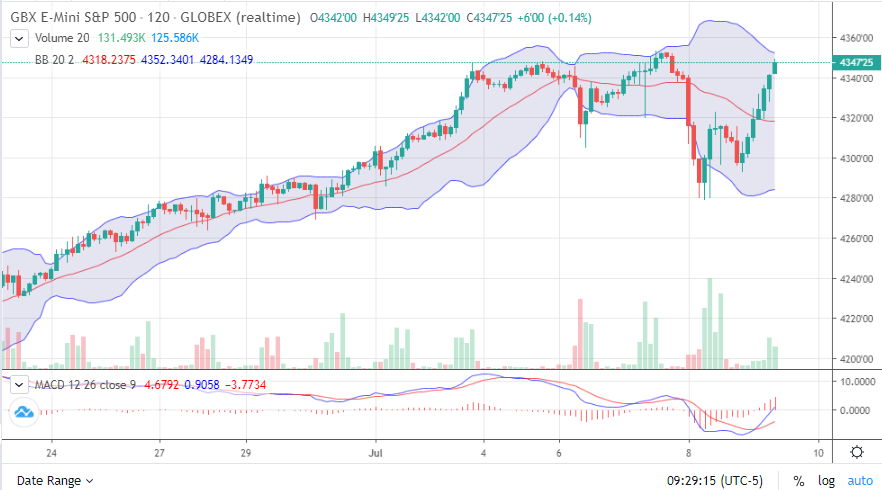
Following yesterday’s selloffs in equity futures, the
markets are recovering nicely. The
Nasdaq is down slightly as we type, but the Dow (+418), Russell (+37.70), and
S&P (+32.75) have all recouped all of yesterday’s losses. Plummeting yields, renewed Coronavirus fears,
and potential government crackdowns on banks and big tech were largely to blame
for the yesterday’s selling. All of
those concerns seem to have been forgotten as we head into the weekend, but it
is fair to argue that we’ll need some more bullish news for this rally to
continue. The Fed on Wednesday expressed
some concern about the pace at which the economy is recovering. Much of that can be attributed to labor shortages
and supply disruptions. Labor shortages
should begin to correct as benefits expire, but the supply disruptions will
likely take a while to get back up to speed.
Next week’s news slate is relatively light, but we’ll get a few gauges on inflation with CPI and PPI coming out Tuesday and Wednesday, respectively. It should however be noted that the Fed cares much more about PCE, which won’t be announced until the 30th. We’ll also have a two-day FOMC meeting that last week of July, and traders will be anxious to see if any more FOMC members have shifted towards tapering sooner rather than later.
E-mini S&P 500 120 Min Chart If you have any questions or would like to discuss the markets further, please feel free to contact me at 800-669-5354 or bdixon@rjofutures.com. Economy - S-T Mo Failure Insufficient to End RBOB Correction, But Beware
S-T Mo Failure Insufficient to End RBOB Correction, But Beware
By: RJO Market InsightsPosted 11/08/2022
Posted on Nov 08, 2022, 07:51 by Dave Toth
In Fri's Technical Webcast we identified a
minor corrective low at 2.6328 from Thur as a mini risk parameter the market
needed to sustain gains above to maintain a more immediate bullish count.
The 240-min chart below shows the market's failure overnight below this level,
confirming a bearish divergence in very short-term momentum. This mo
failure defines Fri's 2.8172 high as
one of developing importance and a parameter from which very short-term traders
can objectively base non-bullish decisions like long-covers.
Given
the magnitude of the past three weeks' broader recovery however, this
short-term momentum failure is of an insufficient scale to conclude anything
more than another correction within this broader recovery from 26-Sep's 2.1877
low. Indeed, overnights failure below 2.6328 only allows us to conclude
the end of the portion of the month-and-a-half rally from 31-Oct's 2.4822 next
larger-degree corrective low. 2.4822 is the
risk parameter this market still needs to fail below to break the uptrend from
18-Oct's 2.3526 low while this 2.3526 low
remains intact as the risk parameter this market needs to fail below to break
the month-and-a-half uptrend. From an
intermediate-to-longer-term perspective, this week's setback falls well within
the bounds of another correction ahead of further gains. This is another
excellent example of the importance of technical and trading SCALE and
understanding and matching directional risk exposure to one's personal risk
profile.
The
reason overnight's admittedly minor mo failure might have longer-term
importance is the 2.8172-area from which it stemmed. In
Fri's Technical Blog we also noted the market's engagement of the
2.8076-to-2.8159-area marked by the 61.8% retrace of Jun0-Sewp's 3.2758 -2.1877
decline and the 1.000 progression of Sep-Oct's initial 2.1877 - 2.6185
(suspected a-Wave) rally from 18-Oct's 2.3526 (suspected b-Wave) low. We
remind longer-term players that because of the unique and compelling confluence
of:
early-Aug's bearish divergence in WEEKLY momentum
amidst
historically
extreme bullish sentiment/contrary opinion levels in our RJO Bullish
Sentiment Index
an
arguably complete and massive 5-wave Elliott sequence from Mar'20's 0.4605
low to Jun's 4.3260 high (as labeled in the weekly log active-continuation
chart below) and
the
5-wave impulsive sub-division of Jun-Sep's (suspected initial 1st-Wave) decline
The
recovery attempt from 26-Sep's 2.1877 low is arguably only a 3-wave (Wave-2)
corrective rebuttal to Jun-Sep's decline within a massive, multi-quarter
PEAK/reversal process. Now granted, due to the magnitude of 2020 -2022's
secular bull market, we discussed the prospect for this (2nd-Wave corrective)
recovery to be "extensive" in terms of both price and time. A
"more extensive" correction is typified by a retracement of 61.8% or
more and spanning weeks or even months following a 3-month decline. Per
such, the (suspected corrective) recovery from 26-Sep's 2.1877 low could easily
have further to go, with commensurately larger-degree weakness than that
exhibited this week (i.e., a failure below at least 2.4822) required
to consider the correction complete. Indeed, the daily log chart above
shows the market thus far respecting former 2.6185-area resistance from 10-Oct
as a new support candidate.
These
issues considered, very shorter-term traders have been advised to move to a neutral/sideline
position following overnight's momentum failure below 2.6328, with a recovery
above 2.8172 required to negate this call, reaffirm the recovery and re-expose
potentially significant gains thereafter. For intermediate- and
longer-term players, a bullish policy and exposure remain advised with a
failure below 2.4822 required to threaten this call enough to warrant
neutralizing exposure. We will be watchful for another bearish divergence
in momentum following a recovery attempt that falls short of Fri's 2.8172 high
that would be considered the next reinforcing factor to a count calling that
2.8172 high the prospective end to the month-and-a-half 2nd-Wave
correction. In lieu of such, a resumption of the current rally to
eventual new highs above 2.8172 should not surprise.
A notable development yesterday was a POSITIVE momentum shift on the WEEKLY chart in the US Dollar Index. Not a favorable development for commodity bulls in the intermediate term I’m afraid. The US dollar and bond yields have essentially been moving in the opposite direction of consensus and this coupled with the flattening of the yield curve recently, we think this is foreshadowing a period of risk off developing in macro. Furthermore, our technical view of the energy space is beginning to sour in our intermediate term outlook. Now, that doesn’t mean we won’t take a shot at a long side, likely short-dated trade in Crude Oil, as a matter of fact we’re close to pulling the trigger here. Momentum indicators remain positive in all time frames, an OS reading of 10 this morning, and we’re closing in on the low end of our range. We still think following a corrective period, energy prices could be a strong buy into year-end.
Fed Minutes and Bond Yields:
The FOMC Minutes expressed some anxieties over tapering QE purchases. The likely starting point will be pairing back their mortgage backed securities purchases in an attempt to cool off the burning hot real estate market. The next 2 Fed meetings, including the Jackson Hole Forum, will likely express a better a time line of the taper. Regarding bond yields, what I do know is this. The US Treasury is set to bring $821B new bond issuances to market in the Q3 2021 – and purchase $240B worth via QE operations. This is opposed to the $280B new bond issuances in Q2, of which the Fed subsequently purchased … $240B worth. Now, doing the first grade math, that’s going to leave a boat load of excess debt just sitting out there up for grabs … at negative real rates too mind you. I’m having a hard time fathoming there could be any sort of demand to purchase long dated debt at meager rates of return, and when adjusted for inflation - a negative rate of return. In my belief, the flood of excess debt carrying meager to negative rates of return still makes purchasing US Treasury Bonds the worst long-term investment on the board, but even still…watch out for the squeeze.
USD vs EUR Outlook:
US Dollar:
- the dollar could easily correct from here, but it’s likely
a buy on the next corrective set-back.
-Momentum has now moved to positive on the weekly
-if we embark on Scenario, the USD is an overweight long
position in the model.
-USD is tracking yields lower this morning, but like the
falling 10yr yield – we don’t think this lasts
-The Fed is leaning Hawkish
Euro:
-the ECB went dovish (pledged more PEPP at their mid-June
meeting)
-the ECB also sounds more like the Fed circa Q3/Q4 2020 – pledging to let inflation “run hot” and above their 2% target for a period of time. BEARISH EURO
-large topping formation and momentum has downshifted to
NEGATIVE on the weekly
We’re in the “witching hour” of markets in my opinion. Trapped between cycles, and the current cycle is likely not going out without a fight. Earnings season is coming upon us, and we still think Scenario 2 continues to fight for more upside in equities and commodities in the near-term. Pay attention, and keep your profit and risk parameters tight – cash is not a terrible option either.
If you have any questions or would like to discuss the markets further, please feel free to contact me at 800-669-5354 or jcaruso@rjofutures.com.