By: Frank J. Cholly, Senior Market StrategistPosted Jul 17, 2020 8:02AM CT
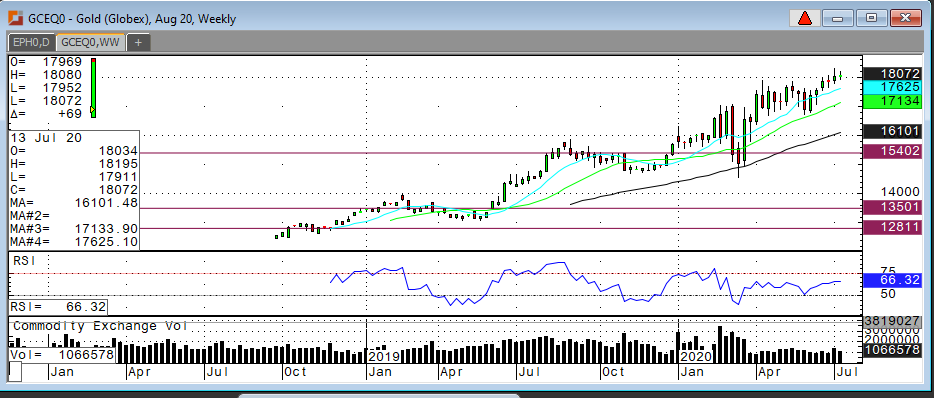
Recent dips in gold futures prices have been well supported around the $1,800 level. Value is more of a range than just one specific price, so it’s entirely possible that a dip reaches levels closer to $1,785 before buyers get more aggressive. The uptrend remains firmly intact at $1,785. With the Fed’s easy money policy gold prices are likely to remain well supported for the next six to twelve months or longer. Global Central Banks, specifically China and India are buying gold. If your intent on being an economic super power then you better be able to back it up with gold holdings similar to what the U.S. is holding. China is holding roughly 33% as much gold as the U.S. That’s an embarrassing level for the Chinese.
Just look at a weekly gold chart! There’s only been one meaningful correction since September 2018, and that’s because of a global pandemic called COVID 19. The gold rally is still alive and kicking. There is no loss of momentum and there’s no reason to doubt that gold will breakout above it’s all-time highs. December gold futures have already put in a contract high of $1,857 on July 8th. I think that this time around, talking about $2,000 gold is not so crazy. It’s way to early to talk about inflation, however, that will be gold’s next chapter in good things to come for precious metals.
Gold Aug '20 Weekly Chart If you have any questions or would like to discuss the markets further, please feel free to contact me at 800-826-4124 or fcholly@rjofutures.com. Energy - Crude Sees Another Week of Sideways Trade
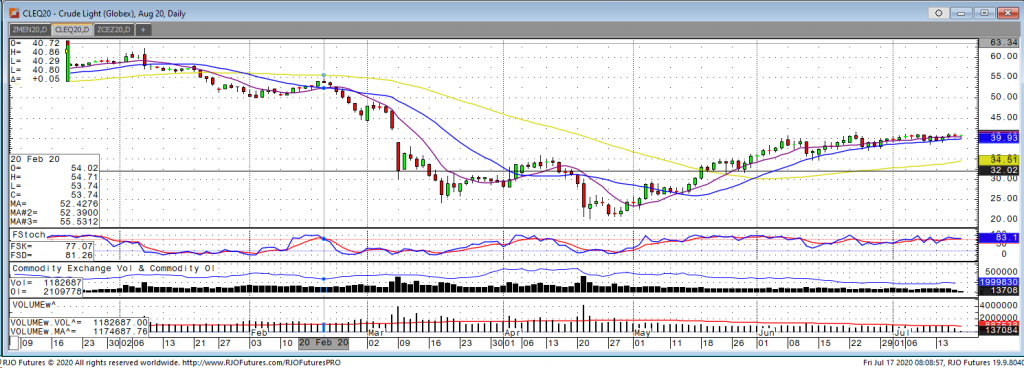
August crude oil saw another week of sideways, choppy trade as in remained in its relatively tight range of $38.50 to $41.25. Although the market did continue its sideways pattern, we are starting to see an increase in bullish fundamentals. Headlines on progress of a vaccine could continue to increase energy demand despite any possible shutdowns a second wave of the virus might have. We also saw a decline of 8.3 million barrels from API crude stocks this week which was more than the estimates. OPEC is currently meeting, and the big question is if they will decide to continue production restraints or begin to ramp up production again.
The August contract traded as high as $41.26 on Wednesday but was unable to hold those gains and is currently looking like it will continue to pullback into the end of the week. The crude market has made a great recovery from the springtime lows but is seeing difficulty in rallying over the $41-$42 area with all the uncertainties that remain. If we see OPEC decide to increase production, a second wave of the virus lead to another round of shutdowns, and demand start to decrease a test and even a break of support at last Friday’s low of $38.54 is possible. It seems despite getting the occasional positive news, currently, crude isn’t able to extend the rally higher.
Crude Oil Aug '20 Daily Chart If you have any questions or would like to discuss the markets further, please feel free to contact me at 800-826-2270 or therrmann@rjofutures.com. Softs - Coffee Struggling to Hold Support
Coffee Struggling to Hold Support
By: Adam TuiaanaPosted 07/15/2020
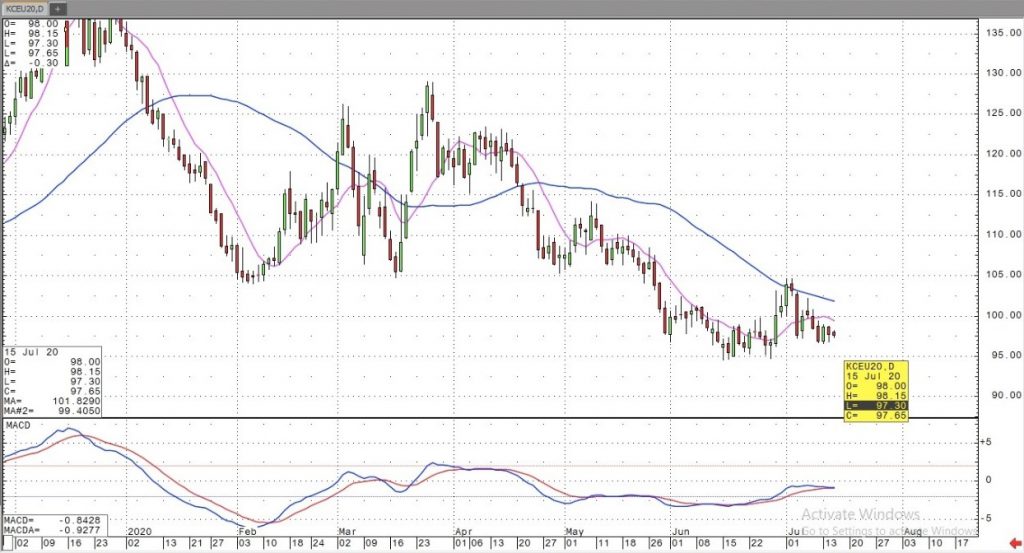
As of the writing of this article, the potential for a vaccine by years end is beginning to look more positive as this morning has the DOW Futures up by nearly 500 points on news that Moderna’s COVID-19 vaccine is reported to be proving effective in leading patients to produce anti-bodies that can neutralize the novel coronavirus, which causes the disease. While this recent news may be sparking a buying frenzy this morning, it’s direct effect on the coffee market remains neutral.
As several states continue to rollback their initial re-openings due to the spread of COVID-19, we need to use common sense with simple math. At the very best, if restaurants that are permitted to remain open are at operating at 25% capacity, home coffee sales are not nearly enough to offset the gaping void of demand left unfilled by restaurants and coffee shops. In addition, favorable weather in key growing areas of Brazil is likely to add some selling pressure to coffee prices.
From a technical perspective, failure to break above the 50-day moving average at the 105 level is likely to be a bearish signal. We now await a re-test of the critical 95 level in order to gauge whether or not coffee prices will continue to suffer more pressure.
On
the heels of mid-Sep-to-early-Oct's steeper, accelerated, 3rd-wave-looking
recovery, the past week-and-a-half's boringly lateral chop is first considered
a corrective/consolidative event that warns of a continuation of the uptrend
that preceded it to new highs above 04-Oct's 891.0 high. This count
remains consistent with our broader base/correction/recovery count introduced
in 13-Sep's Technical Blog following that
day's bullish divergence in short-term momentum above 07-Sep's 809.5 minor
corrective high detailed in the hourly chart below.
The
important takeaway from this month's lateral, sleepy price action is the
definition of Wed's 851.5 low as
the end or lower boundary of a suspected 4th-Wave correction. A failure
below 851.5 will confirm a bearish divergence in daily momentum and defer or
threaten a bullish count enough to warrant non-bullish decisions like
long-covers. A failure below 851.5 will not
necessarily negate a broader bullish count, but it will threaten it enough to
warrant defensive measures as the next pertinent technical levels below 851.5 are
13-Sep's prospective minor 1st-Wave high at 813.8 and obviously 08-Sep's 766.0
low. And making non-bullish decisions "down there" is
sub-optimal to say the least. Per such, both short- and longer-term
commercial traders are advised to pare or neutralize bullish exposure on a
failure below 851.5, acknowledging and accepting whipsaw risk- back above 04-Oct's
891.0 high- in exchange for much deeper and sub-optimal nominal risk below
766.0.
On
a broader scale, the daily log scale chart above shows the developing potential
for a bearish divergence in daily momentum that will be considered confirmed
below 851.5. This chart also shows the past month's recovery thus far
stalling in the immediate neighborhood of the (888.0) Fibonacci
minimum 38.2% retrace of Apr-Sep's entire 1128 - 766 decline). COMBINED
with a failure below 851.5, traders
would then need to be concerned with at least a larger-degree correction pf the
past month's rally and possibly a resumption of Apr-Sep's major downtrend.
Until
and unless the market fails below 851.5 however, we would
remind longer-term players of the key elements on which our bullish count is
predicated:
a confirmed bullish divergence in WEEKLY momentum
(below)
amidst
an
historically low 11% reading in out RJO Bullish Sentiment Index and
a
textbook complete and major 5-wave Elliott sequence down from 29-Apr's
1128 high to 08-Sep's 766.0 low.
Thus
far, the market is only a month into correcting a 4-MONTH, 32% drawdown, so
further and possibly protracted gains remain well within the bounds of a major
(suspected 2nd-Wave) correction of Apr-Sep's decline within an even more
massive PEAK/reversal process from 17-May's 1219 high on an active continuation
basis below.
These
issues considered, a bullish policy and exposure remain advised with a failure
below 851.5 required to defer or threaten this call enough to warrant moving to
a neutral/sideline position. In lieu of such weakness, we anticipate a
continuation of the past month's rally to new highs and potentially significant
gains above 891.0.
Agricultural - Grain Futures Update w/Stephen Davis - 07/17/202
Grain Futures Update w/Stephen Davis - 07/17/202
By: Stephen DavisPosted 07/17/2020
Stephen Davis discusses the latest news in the grain markets.Currency - USD Showing Minor Corrective Action
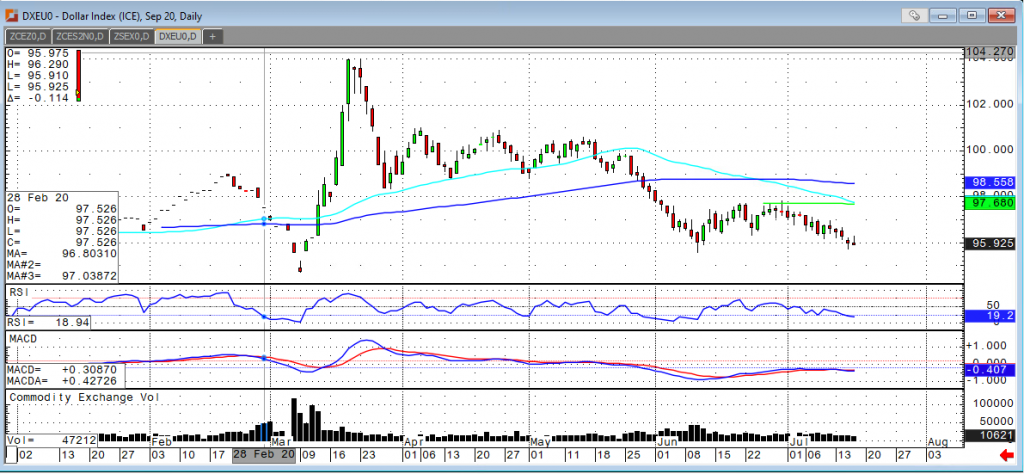
Dollar: Earlier this morning, there was obviously enough economic uncertainty to provide the dollar with a bounce, but this can also be a simple technical bounce off of an oversold condition from a 4-day decline. If data is looked at as slightly better than expected, we may see a test of resistance at 96.53. Resistance is at 96.23 and 96.47 while support is at 95.75
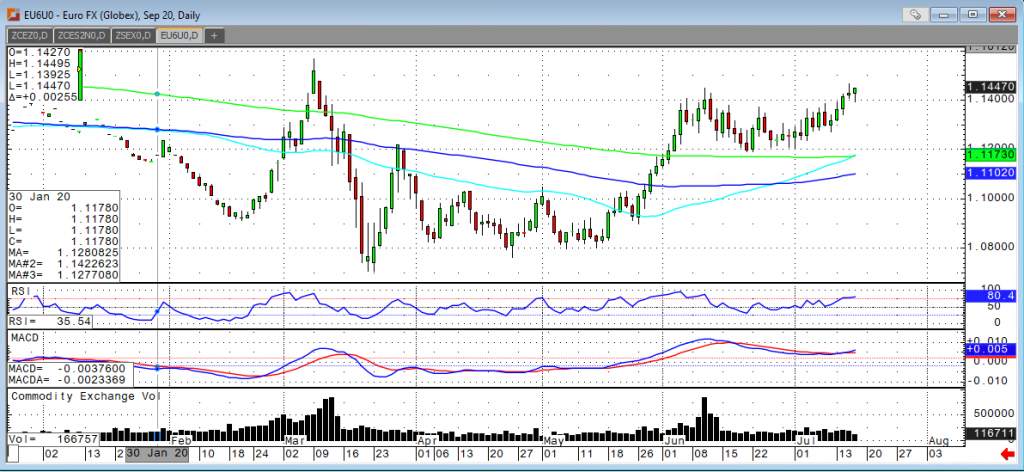
Euro: As indicated in the dollar paragraph, overnight uncertainty does not appear to be extreme, and therefore the magnitude of the corrective action in the euro should also be limited today. The question mark for the euro is if the ECB will continue to fail to act and then somewhat weak European inflation data leaves the bears with the fundamental edge. Resistance comes in at 114585 and 114935, while support comes in at 113975 and 113715.
USD Sep '20 Daily ChartEuro FX Sep '20 Daily Chart If you have any questions or would like to discuss the markets further, please feel free to contact me at 800-826-2270 or tcholly@rjofutures.com. Interest Rates - Interest Rates Remain Resilient
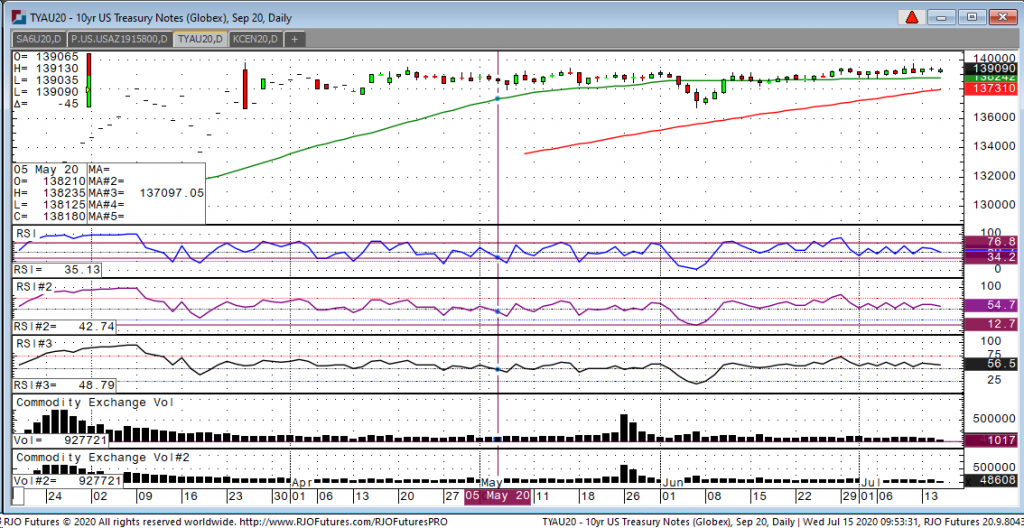
The recent resiliency in the notes despite a solid run in the S&P 500 has been a welcome to surprise. Today, we have seen a high in the Sep notes of 139-13 and a low of 139-035 and we are currently trading at 139.09. Economic numbers are starting to weaken a bit after last month’s very strong numbers across the board, especially after the employment numbers. In my opinion, interest rats have two things going for them. The first being while rates in the U.S. are low, they are still comparatively better than European rates, which are still negative, so you have overseas investors looking at U.S. notes. The second reason is unemployment benefits are set to cease at the end of July and we will see a slowing in spending.
10-Year Note Sep '20 Daily Chart If you have any questions or would like to discuss the markets further, please feel free to contact me at 800-826-2270 or gperlin@rjofutures.com. Equity - Stocks Higher to Start
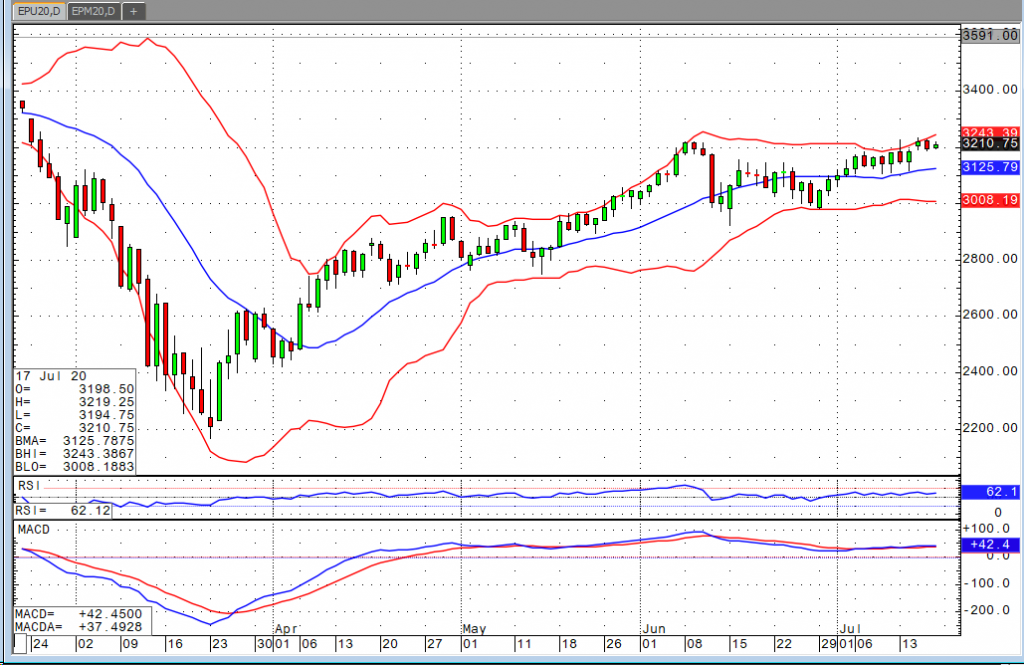
The indices are all up about half a percent or more in the morning’s early stages. Earnings, Covid, and China continue to dominate the headlines. Covid cases are exploding. While we’ve learned a good deal over the past four or five months about who is most at risk, what we can do to try and prevent contracting and/or spreading the disease, we are not seeing the downturn we had hoped for. There are several reasons for this, but I’m not really looking to go down that road here. Depending on the narrative you want to follow, you can find reasons to be optimistic or pessimistic. What matters here though is that the market continues to discount the threat. We’ve seen new highs for the recovery in the S&P and new all-time highs for the Nasdaq this week. Despite this, it is safe to say there is increasing cause for concerns as we’re hearing talks of reversals of re-openings (Gov Abbot has shot down the idea for Texas), schools not opening in the fall, etc. The market seems optimistic about vaccine prospects, but if businesses are going to have to continue to operate below capacity, the market will have to acknowledge that at some point. We saw that on Monday when California announced it was tightening back up, but the dip buyers got paid yet again.
E-mini S&P 500 Daily Chart If you have any questions or would like to discuss the markets further, please feel free to contact me at 800-669-5354 or bdixon@rjofutures.com. Economy - S-T Mo Failure Insufficient to End RBOB Correction, But Beware
S-T Mo Failure Insufficient to End RBOB Correction, But Beware
By: RJO Market InsightsPosted 11/08/2022
Posted on Nov 08, 2022, 07:51 by Dave Toth
In Fri's Technical Webcast we identified a
minor corrective low at 2.6328 from Thur as a mini risk parameter the market
needed to sustain gains above to maintain a more immediate bullish count.
The 240-min chart below shows the market's failure overnight below this level,
confirming a bearish divergence in very short-term momentum. This mo
failure defines Fri's 2.8172 high as
one of developing importance and a parameter from which very short-term traders
can objectively base non-bullish decisions like long-covers.
Given
the magnitude of the past three weeks' broader recovery however, this
short-term momentum failure is of an insufficient scale to conclude anything
more than another correction within this broader recovery from 26-Sep's 2.1877
low. Indeed, overnights failure below 2.6328 only allows us to conclude
the end of the portion of the month-and-a-half rally from 31-Oct's 2.4822 next
larger-degree corrective low. 2.4822 is the
risk parameter this market still needs to fail below to break the uptrend from
18-Oct's 2.3526 low while this 2.3526 low
remains intact as the risk parameter this market needs to fail below to break
the month-and-a-half uptrend. From an
intermediate-to-longer-term perspective, this week's setback falls well within
the bounds of another correction ahead of further gains. This is another
excellent example of the importance of technical and trading SCALE and
understanding and matching directional risk exposure to one's personal risk
profile.
The
reason overnight's admittedly minor mo failure might have longer-term
importance is the 2.8172-area from which it stemmed. In
Fri's Technical Blog we also noted the market's engagement of the
2.8076-to-2.8159-area marked by the 61.8% retrace of Jun0-Sewp's 3.2758 -2.1877
decline and the 1.000 progression of Sep-Oct's initial 2.1877 - 2.6185
(suspected a-Wave) rally from 18-Oct's 2.3526 (suspected b-Wave) low. We
remind longer-term players that because of the unique and compelling confluence
of:
early-Aug's bearish divergence in WEEKLY momentum
amidst
historically
extreme bullish sentiment/contrary opinion levels in our RJO Bullish
Sentiment Index
an
arguably complete and massive 5-wave Elliott sequence from Mar'20's 0.4605
low to Jun's 4.3260 high (as labeled in the weekly log active-continuation
chart below) and
the
5-wave impulsive sub-division of Jun-Sep's (suspected initial 1st-Wave) decline
The
recovery attempt from 26-Sep's 2.1877 low is arguably only a 3-wave (Wave-2)
corrective rebuttal to Jun-Sep's decline within a massive, multi-quarter
PEAK/reversal process. Now granted, due to the magnitude of 2020 -2022's
secular bull market, we discussed the prospect for this (2nd-Wave corrective)
recovery to be "extensive" in terms of both price and time. A
"more extensive" correction is typified by a retracement of 61.8% or
more and spanning weeks or even months following a 3-month decline. Per
such, the (suspected corrective) recovery from 26-Sep's 2.1877 low could easily
have further to go, with commensurately larger-degree weakness than that
exhibited this week (i.e., a failure below at least 2.4822) required
to consider the correction complete. Indeed, the daily log chart above
shows the market thus far respecting former 2.6185-area resistance from 10-Oct
as a new support candidate.
These
issues considered, very shorter-term traders have been advised to move to a neutral/sideline
position following overnight's momentum failure below 2.6328, with a recovery
above 2.8172 required to negate this call, reaffirm the recovery and re-expose
potentially significant gains thereafter. For intermediate- and
longer-term players, a bullish policy and exposure remain advised with a
failure below 2.4822 required to threaten this call enough to warrant
neutralizing exposure. We will be watchful for another bearish divergence
in momentum following a recovery attempt that falls short of Fri's 2.8172 high
that would be considered the next reinforcing factor to a count calling that
2.8172 high the prospective end to the month-and-a-half 2nd-Wave
correction. In lieu of such, a resumption of the current rally to
eventual new highs above 2.8172 should not surprise.
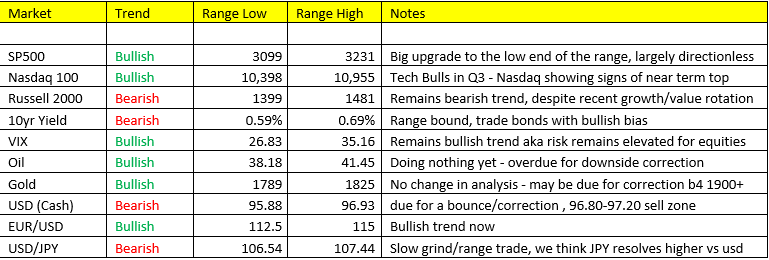
Stocks- Chopped lower mostly yesterday. China and Europe were able to eke out gains overnight on what appeared to be a rather uneventful session. We’re really in a directionless market for the past 10 days in US stocks with upside bias over the last 3 days. The VIX remains elevated and bullish trend. The VXN (Nasdaq Volatility) has also broken out to bullish trend, signaling perhaps some impending downside in the Nasdaq. Netflix missed on EPS, gained on revenue, but guided down. Microsoft earnings will be come in to focus early next week. Initials claims were +1.3M yesterday which is just mind boggling to thing how Fed liquidity has totally obfuscated the importance of employment within the economy.
Covid-19- shattered its one day record for new cases in the US at 77K on Thursday. Total cases are now 3.5M in the US. C19 hasn’t mattered to markets, in large due to well-timed/placed vaccine news, but this is clearly not getting better, which will only continue to reflect reality, and continued disconnect between the economy and markets. Put on your masks please.
Metals: Back in fill late yesterday/overnight in metals. Because many ask, I’ll tell, silver range is 1994-1867. So I’m focused on the low end of the range at the moment, even though silver has offered little in the way of any correction to buy into – but we think one may be coming soon. Gold and silver are markets we believe you just have to own at the moment for better or worse with the economic backdrop. Copper bouncing back overnight to 2.90.
Currencies- We also mentioned yesterday there’s a window where the dollar could correct some within its bearish trend, not yet however, Dollar fell back under 96.00 overnight.
The Cycle- Stagflation remains the call, for those that are new that’s Growth slowing/Inflation accelerating, or our Scenario 3 set up. Material costs continue to rise for producers, all the while the higher costs get passed on to you and I….the consumer. We see no reason to update this call here, it’s been correct all the way.
If you have any questions or would like to discuss the markets further, please feel free to contact me at 800-669-5354 or jcaruso@rjofutures.com.