By: Frank J. Cholly, Senior Market StrategistPosted Jul 31, 2020 8:21AM CT
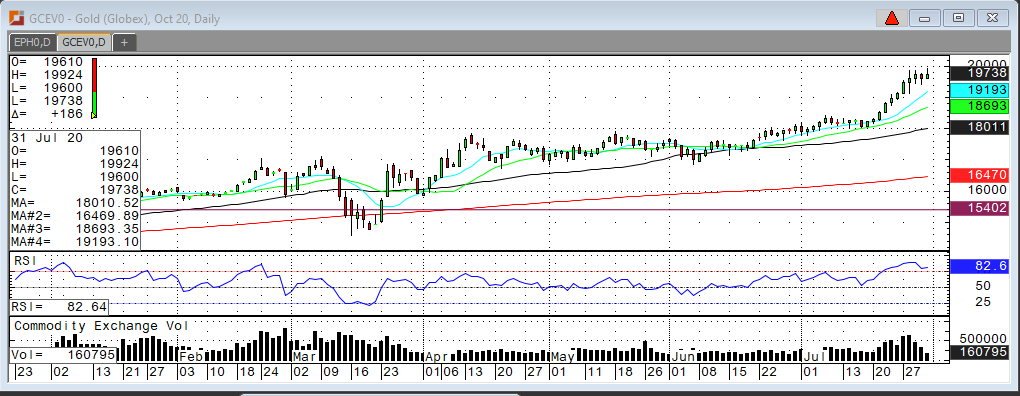
As the week and the month come to an end today, we see fresh new highs in the gold futures and fresh new contract lows in the Dollar Index. At the conclusion of the FOMC Meeting this week, Chairman Powell made it crystal clear that the Fed is committed to using its full range of tools to help our economy recover during this health crisis. The Fed is not even thinking about when they may raise rates. None of this was a “surprise” but everyone wanted to hear it. This is helping to support gold…dovish Fed and dollar weakness.
Furthermore, Gold ETF purchases so far this year have
already eclipsed the last three years combined. Meanwhile, due to the collapse
of the global economy, physical demand naturally has been weak from the likes
of China and India. As those economies begin to recover, one could expect
demand for physical gold to return to normal levels.
Ups and downs along the way should be expected. Nothing should just go straight up. A healthy bull market rebounds after corrections. It’s my opinion that we are in the early stages of the next big commodity bull market. It starts with gold. One day, as a result of everything the Fed has been doing for far too long, inflation will awaken and commodities will be the “place to be”.
Gold Oct '20 Daily Chart If you have any questions or would like to discuss the markets further, please feel free to contact me at 800-826-4124 or fcholly@rjofutures.com. Metals - Silver Should Pull Up
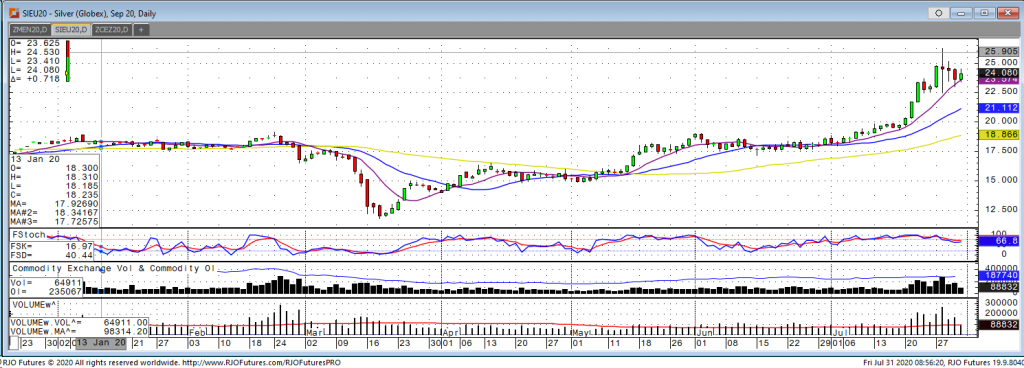
This week in the September silver market we saw a positive start trading to new recent highs on Monday followed by a wild trading day on Tuesday with a daily low and high of 22.46 and 26.275. After Tuesday’s slightly lower close of 24.525, the market sold off to a low of 23.00 on Thursday but is making an effort to re gain some of those losses to start today. The trend lower in the U.S. dollar and uncertainty in the spread of virus cases should continue the safe haven interest in gold and silver. Gold making new all-time highs this week and the continued inflows into silver ETFs, adding over 5 million ounces yesterday, should provide support. Silver would need to see a bullish push over 25.12 in order to continue the rally to test Tuesday’s high of 26.275. September silver would need to hold support at 23.40 and a close below 23.00 would reverse the short-term trend back to the downside. As long as the US dollar remains weak and gold continues to run, the silver market should be pulled up as well.
If you have any questions or would like to discuss the markets further, please feel free to contact me at 800-826-2270 or therrmann@rjofutures.com. Energy - Oil Prices Rebound Despite Economic Headwinds
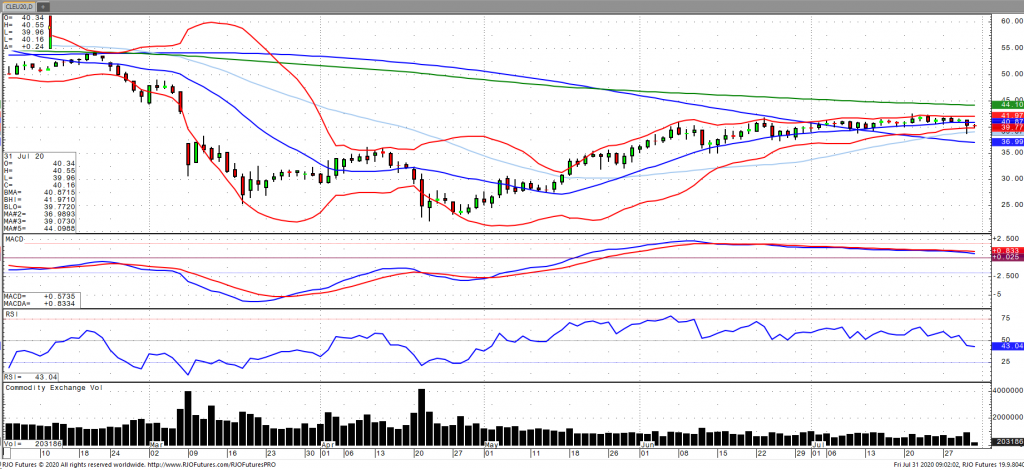
Oil prices are bouncing back after hitting a three-week low on Thursday as the US economy declined by the worst print on record of a 32.9% annualized rate. Concerns regarding demand destruction are reemerging as new corona cases continue to surge globally as producers are set to increase output. OPEC+ are set to increase output of about 1.5 million barrels a day in August, easing some of the supply restrictions. This comes amid the largest one week decline in oil stocks since December, according to the EIA. Global economic outlook appears to be fleeting (once again) amid increasing infections as demand plateaus, which coupled with more supply coming back online may test near term market sentiment. The market remains bullish trend with today’s range seen between 39.47 – 42.40.
Crude Oil Sep '20 Daily Chart If you have any questions or would like to discuss the markets further, please feel free to contact me at 800-438-4805 or aturro@rjofutures.com. Softs - Strength in Coffee
Strength in Coffee
By: Adam TuiaanaPosted 07/29/2020
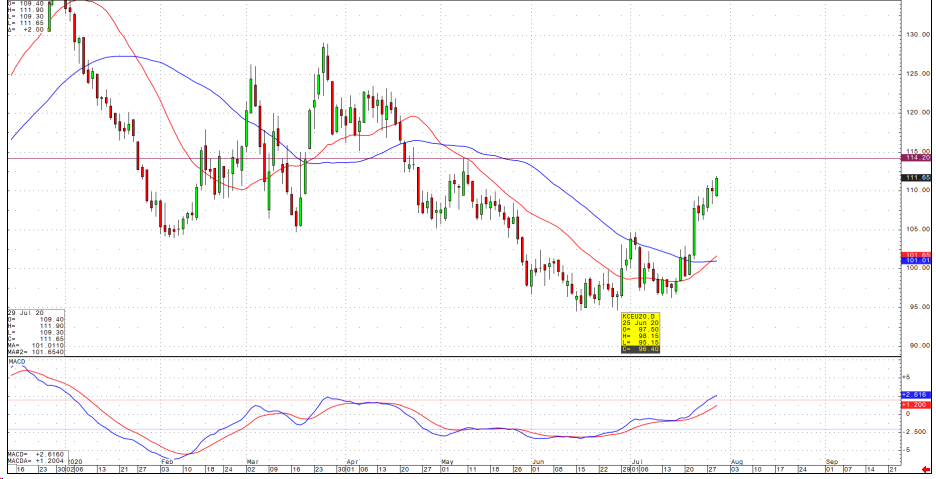
A cross of the 25-day MA up through the 50-day MA has sparked a strong rally in September coffee. We continue to hear reports of less wet weather in key growing areas of Brazil that had initially provided somewhat of a bearish outlook. As we continue to battle against COVID-19, stay at home coffee purchases continue to stay solid. September coffee prices are targeting the 115 level, and with a weakening U.S. dollar, we should likely see an inverse push higher on most commodities.
As several States continue to rollback their initial re-openings due to the spread of COVID-19, we need to be mindful that until we are fully operational and back to normal, sporadic and volatile price action will continue to take center stage in commodities. Until that day when restaurants are permitted increase their level of capacity (or even remain open), home coffee sales will not be nearly enough to offset the gaping void of demand left unfilled by restaurants and coffee shops. In addition, many of these restaurants and coffee shops may never return. From a technical perspective, we await a retest of the 115 level in order to see whether this rally may turn into a reversal up.
On
the heels of mid-Sep-to-early-Oct's steeper, accelerated, 3rd-wave-looking
recovery, the past week-and-a-half's boringly lateral chop is first considered
a corrective/consolidative event that warns of a continuation of the uptrend
that preceded it to new highs above 04-Oct's 891.0 high. This count
remains consistent with our broader base/correction/recovery count introduced
in 13-Sep's Technical Blog following that
day's bullish divergence in short-term momentum above 07-Sep's 809.5 minor
corrective high detailed in the hourly chart below.
The
important takeaway from this month's lateral, sleepy price action is the
definition of Wed's 851.5 low as
the end or lower boundary of a suspected 4th-Wave correction. A failure
below 851.5 will confirm a bearish divergence in daily momentum and defer or
threaten a bullish count enough to warrant non-bullish decisions like
long-covers. A failure below 851.5 will not
necessarily negate a broader bullish count, but it will threaten it enough to
warrant defensive measures as the next pertinent technical levels below 851.5 are
13-Sep's prospective minor 1st-Wave high at 813.8 and obviously 08-Sep's 766.0
low. And making non-bullish decisions "down there" is
sub-optimal to say the least. Per such, both short- and longer-term
commercial traders are advised to pare or neutralize bullish exposure on a
failure below 851.5, acknowledging and accepting whipsaw risk- back above 04-Oct's
891.0 high- in exchange for much deeper and sub-optimal nominal risk below
766.0.
On
a broader scale, the daily log scale chart above shows the developing potential
for a bearish divergence in daily momentum that will be considered confirmed
below 851.5. This chart also shows the past month's recovery thus far
stalling in the immediate neighborhood of the (888.0) Fibonacci
minimum 38.2% retrace of Apr-Sep's entire 1128 - 766 decline). COMBINED
with a failure below 851.5, traders
would then need to be concerned with at least a larger-degree correction pf the
past month's rally and possibly a resumption of Apr-Sep's major downtrend.
Until
and unless the market fails below 851.5 however, we would
remind longer-term players of the key elements on which our bullish count is
predicated:
a confirmed bullish divergence in WEEKLY momentum
(below)
amidst
an
historically low 11% reading in out RJO Bullish Sentiment Index and
a
textbook complete and major 5-wave Elliott sequence down from 29-Apr's
1128 high to 08-Sep's 766.0 low.
Thus
far, the market is only a month into correcting a 4-MONTH, 32% drawdown, so
further and possibly protracted gains remain well within the bounds of a major
(suspected 2nd-Wave) correction of Apr-Sep's decline within an even more
massive PEAK/reversal process from 17-May's 1219 high on an active continuation
basis below.
These
issues considered, a bullish policy and exposure remain advised with a failure
below 851.5 required to defer or threaten this call enough to warrant moving to
a neutral/sideline position. In lieu of such weakness, we anticipate a
continuation of the past month's rally to new highs and potentially significant
gains above 891.0.
Agricultural - Grain Futures Update w/Stephen Davis 07/31/2020
Grain Futures Update w/Stephen Davis 07/31/2020
By: Stephen DavisPosted 07/31/2020
Stephen Davis discusses the latest movements in the grain market. China has been buying U.S. grains lately and we hope to see that continue.Currency - Currencies Likely to Take Direction from Initial Claims
Currencies Likely to Take Direction from Initial Claims
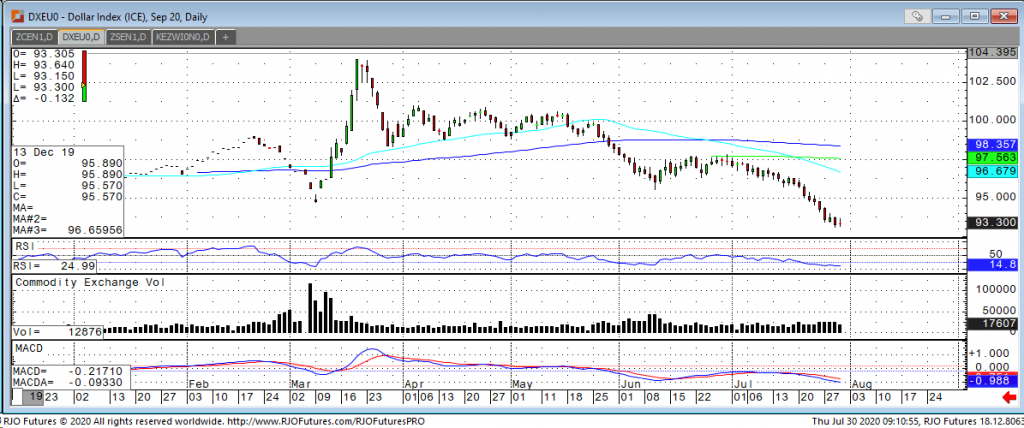
USD: We attribute yesterdays spike low and slightly higher trade as a temporary technical reaction in the dollar. However, the USD will made a critical decision this morning after initial claims, and began trading lower again. Lingering hope of stimulus from U.S. congressional programs should halt the slide lower in the dollar. Traders can look for a bounce back to 9380 or so, but beware of more downside from there.
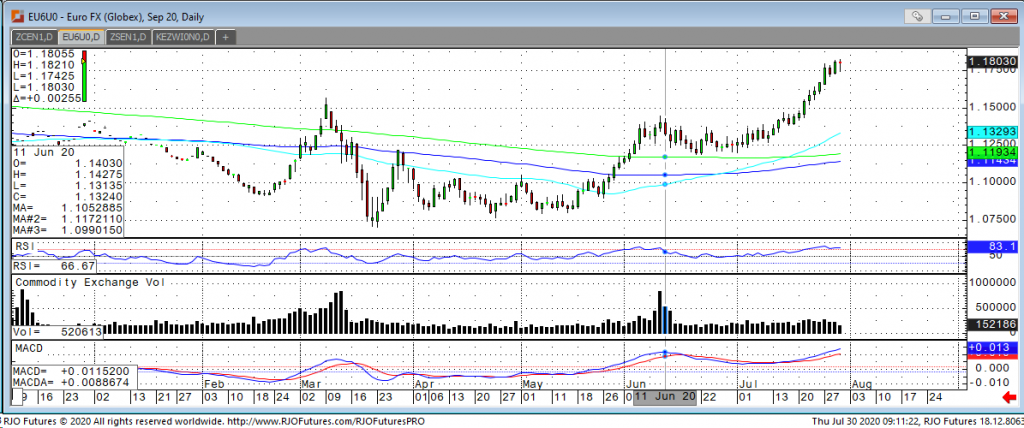
Euro: The euro deserves a measure of corrective action following the breakneck gains throughout July. We suspect that the net take away from German economic data overnight adds to the liquidation tilt this morning. The key event of the day is likely to take place after initial claims with recent action in the euro suggesting a concerning claims report can lift the euro. Suggesting that buyers wait for below 117150 to enter the long side.
USD Sep '20 Daily ChartEuro FX Sep '20 Daily If you have any questions or would like to discuss the markets further, please feel free to contact me at 800-826-2270 or tcholly@rjofutures.com. Interest Rates - Treasuries Waiting on Today's Fed Announcement
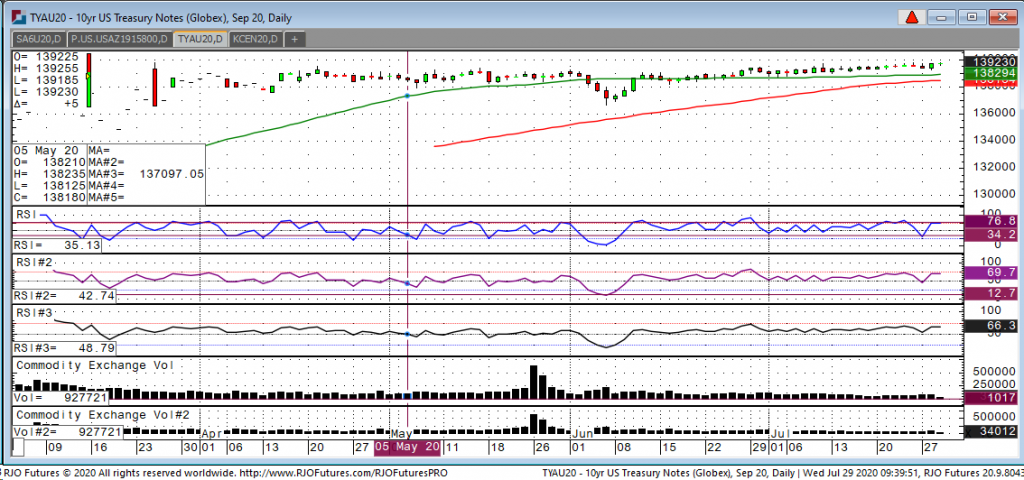
Looking at the September 10-year note this morning, we have seen a high of 139-25 and a low of 139-185. The whole treasury complex has seen a very narrow range for the past two weeks. The market is coiling which normally means we should see a breakout soon. Most markets have been in summer mode recently except the USD and the metals complex, the dollar hit a ten-year low yesterday. If this move should continue, we could see a major trend reversal in notes to the downside. Most traders view a sharply lower dollar as a sign of inflation which could rally rates and push prices lower in the treasuries. As stated earlier, the Fed has an announcement today at 1:00pm CSTl on rates. Most believe they will stay consistent with their continued dovish tone but if they hint at a hawkish tone, we could see some market volatility pick up. Traders should use rallies of 16-20 ticks in the notes to establish short position looking for continued weakness in the dollar and hence lower prices in treasuries.
10-Year Note Sep '20 Daily Chart If you have any questions or would like to discuss the markets further, please feel free to contact me at 800-826-2270 or gperlin@rjofutures.com. Equity - Stocks Testing Upper End of Rangers
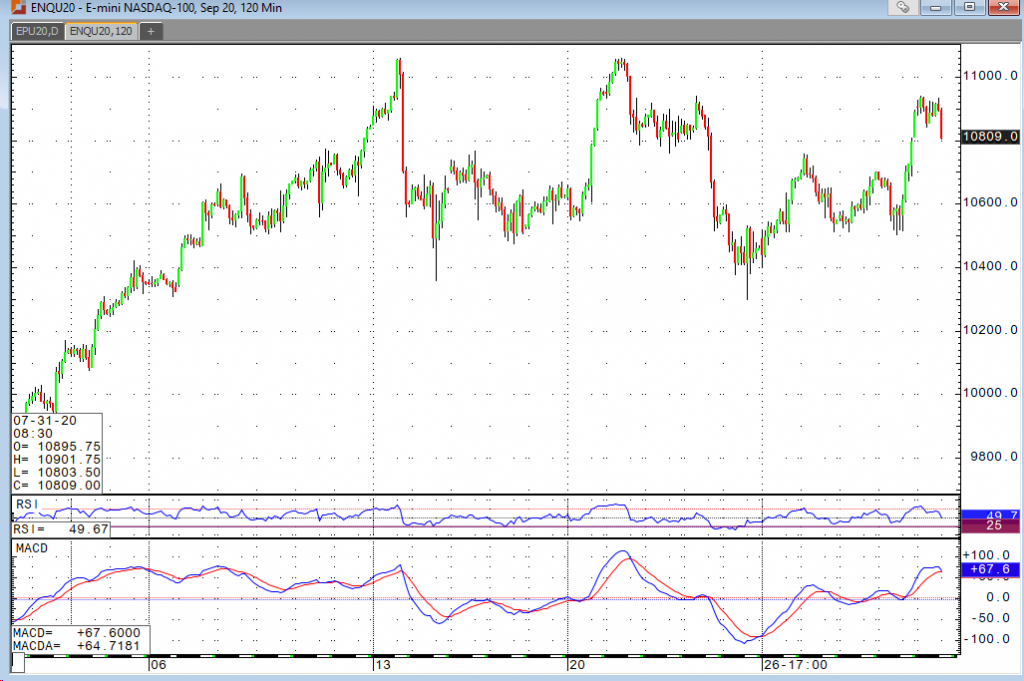
The Nasdaq and S&P are on the rise again following the blowout earnings we saw from the usual suspects in tech. The Nasdaq had been spending the majority of the month in a range (10500-10750) within a range (10350-11050) and is now testing the upper limits of the latter. With earnings figures like we saw yesterday, don’t be surprised if the index prints new highs in short order. The Dow and Russell are the debbie downers of the group, up a measly 0.1% and down 0.5%, respectively. Perhaps they’re having a hard time being optimistic after seeing a GDP reading of -32.9% yesterday, coronavirus numbers continuing to climb, unemployment numbers on the rise, and tensions with China elevating. The overall market continues to discount much of the causes for concern, and why not? The Fed will save us, right? Well so far, the answer is overwhelmingly yes. Powell suggested that they intend to keep rates as is through 2022 and possibly beyond. He also suggested that QE is here to stay and that they’ll continue to inject liquidity as they see fit for the foreseeable future. Fighting the Fed is a great way to lose money, but I can understand the uneasy feelings that many investors are struggling with. Also keep in mind that we’re likely to see another stimulus package here soon. There’s a lot of posturing going on, but that’s nothing new.
Unemployment benefits are going to get extended. We’re just not quite sure for how long just yet. The deadline is midnight tonight, so maybe we get news on that today. With all that in mind, we continue to look for opportunities to buy dips. At some point or another it will stop working, but until then, that is the plan.
E-mini Nasdaq Sep '20 Daily Chart If you have any questions or would like to discuss the markets further, please feel free to contact me at 800-669-5354 or bdixon@rjofutures.com. Economy - S-T Mo Failure Insufficient to End RBOB Correction, But Beware
S-T Mo Failure Insufficient to End RBOB Correction, But Beware
By: RJO Market InsightsPosted 11/08/2022
Posted on Nov 08, 2022, 07:51 by Dave Toth
In Fri's Technical Webcast we identified a
minor corrective low at 2.6328 from Thur as a mini risk parameter the market
needed to sustain gains above to maintain a more immediate bullish count.
The 240-min chart below shows the market's failure overnight below this level,
confirming a bearish divergence in very short-term momentum. This mo
failure defines Fri's 2.8172 high as
one of developing importance and a parameter from which very short-term traders
can objectively base non-bullish decisions like long-covers.
Given
the magnitude of the past three weeks' broader recovery however, this
short-term momentum failure is of an insufficient scale to conclude anything
more than another correction within this broader recovery from 26-Sep's 2.1877
low. Indeed, overnights failure below 2.6328 only allows us to conclude
the end of the portion of the month-and-a-half rally from 31-Oct's 2.4822 next
larger-degree corrective low. 2.4822 is the
risk parameter this market still needs to fail below to break the uptrend from
18-Oct's 2.3526 low while this 2.3526 low
remains intact as the risk parameter this market needs to fail below to break
the month-and-a-half uptrend. From an
intermediate-to-longer-term perspective, this week's setback falls well within
the bounds of another correction ahead of further gains. This is another
excellent example of the importance of technical and trading SCALE and
understanding and matching directional risk exposure to one's personal risk
profile.
The
reason overnight's admittedly minor mo failure might have longer-term
importance is the 2.8172-area from which it stemmed. In
Fri's Technical Blog we also noted the market's engagement of the
2.8076-to-2.8159-area marked by the 61.8% retrace of Jun0-Sewp's 3.2758 -2.1877
decline and the 1.000 progression of Sep-Oct's initial 2.1877 - 2.6185
(suspected a-Wave) rally from 18-Oct's 2.3526 (suspected b-Wave) low. We
remind longer-term players that because of the unique and compelling confluence
of:
early-Aug's bearish divergence in WEEKLY momentum
amidst
historically
extreme bullish sentiment/contrary opinion levels in our RJO Bullish
Sentiment Index
an
arguably complete and massive 5-wave Elliott sequence from Mar'20's 0.4605
low to Jun's 4.3260 high (as labeled in the weekly log active-continuation
chart below) and
the
5-wave impulsive sub-division of Jun-Sep's (suspected initial 1st-Wave) decline
The
recovery attempt from 26-Sep's 2.1877 low is arguably only a 3-wave (Wave-2)
corrective rebuttal to Jun-Sep's decline within a massive, multi-quarter
PEAK/reversal process. Now granted, due to the magnitude of 2020 -2022's
secular bull market, we discussed the prospect for this (2nd-Wave corrective)
recovery to be "extensive" in terms of both price and time. A
"more extensive" correction is typified by a retracement of 61.8% or
more and spanning weeks or even months following a 3-month decline. Per
such, the (suspected corrective) recovery from 26-Sep's 2.1877 low could easily
have further to go, with commensurately larger-degree weakness than that
exhibited this week (i.e., a failure below at least 2.4822) required
to consider the correction complete. Indeed, the daily log chart above
shows the market thus far respecting former 2.6185-area resistance from 10-Oct
as a new support candidate.
These
issues considered, very shorter-term traders have been advised to move to a neutral/sideline
position following overnight's momentum failure below 2.6328, with a recovery
above 2.8172 required to negate this call, reaffirm the recovery and re-expose
potentially significant gains thereafter. For intermediate- and
longer-term players, a bullish policy and exposure remain advised with a
failure below 2.4822 required to threaten this call enough to warrant
neutralizing exposure. We will be watchful for another bearish divergence
in momentum following a recovery attempt that falls short of Fri's 2.8172 high
that would be considered the next reinforcing factor to a count calling that
2.8172 high the prospective end to the month-and-a-half 2nd-Wave
correction. In lieu of such, a resumption of the current rally to
eventual new highs above 2.8172 should not surprise.