How technical analysis differs from trading strategy
Why is price action so important
How to implement a trading strategy
Agricultural Investor Kit
Opportunities Exist in the Ag Markets Right Now –
Have you ever wanted to trade the grain markets but didn’t know where to start? Are you looking for a more informed and disciplined approach to up your trading game? Then this Investor kit is for you! In this comprehensive kit you will find everything you need to help you and take advantage of the opportunities that exist in the grain markets right now!
The Markets
Metals - Gold Correction is a Buying Opportunity
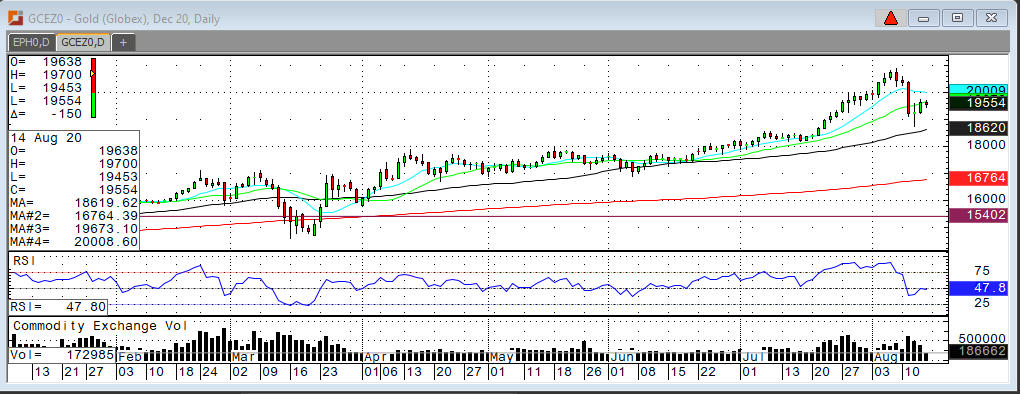
Gold Correction is a Buying Opportunity
By: Frank J. Cholly, Senior Market StrategistPosted Aug 14, 2020 10:03AM CT
No market can just go straight up without any interruption.
Yet, that is what gold did for three straight weeks, moving from $1,820 an
ounce to $2,076 an ounce. So, one can easily make the case that gold was “overbought”.
The market added 14% premium to a $1,800 commodity in three short weeks. He
gold rally reversed on August 7th. That’s a classic “key reversal”
on the daily chart. New all-time high got rejected early in the session and
closed lower than the previous day’s low. That was our sell signal, or at least
a warning to tighten stops and purchase Put protection.
Healthy markets go through corrections. This pullback is
just a correction and the market is likely to consolidate around the $2,000
taking a little breather before continuing to march forward taking out $2,100.
The reasons why I feel so confident about the continuation of the gold rally is
that fiscal stimulus isn’t going away any time soon. Debt is ever mounting. The
Dollar is weakening, and we’ve never lived in a time of greater “uncertainty”!
Volatility is high. Risk management is critical. Working with a professional is advised. Puts work!
Gold Dec '20 Daily Chart If you have any questions or would like to discuss the markets further, please feel free to contact me at 800-826-4124 or fcholly@rjofutures.com. Metals - Silver Seeing Pullback
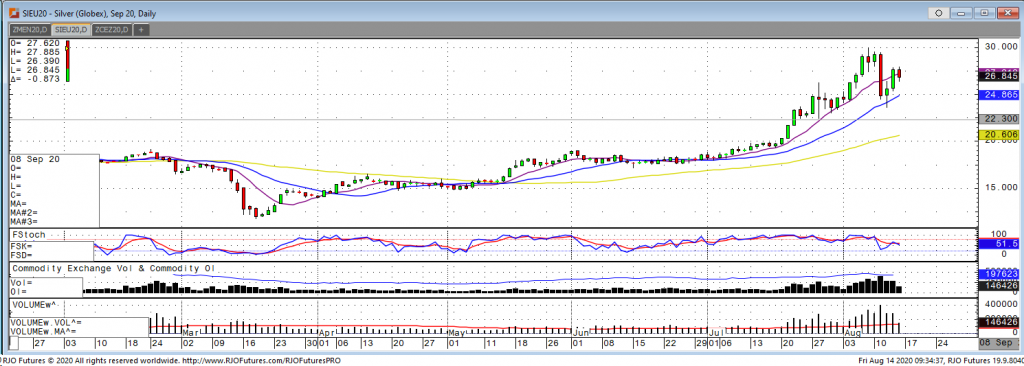
September silver saw a big drop during Tuesday’s session, falling $4.58 off of better than expected U.S. PPI numbers and reports of a Russian COVID vaccine. The overnight session Tuesday/Wednesday posted a low for the week of 23.58, a level not seen since July 31st, before closing positive for the day and continuing to rebound on Thursday. This morning we have seen an initial pull back and the September silver market is currently trading at $26.77. Although the market started today lower it has managed to stay inside Thursday’s range and I feel we will need to hold Thursday’s low today in order to see a continued rally next week. I don’t think a pullback with the U.S. PPI, jobless claims, and vaccine news we saw this week is a bad thing. Especially with the recent run higher and momentum studies showing over bought levels in silver. The Fed is still not looking to raise rates until 2021, stimulus policies will continue, and the recovery from the virus is still going to be a longer term, slower process. Look for silver to continue its run higher in the coming weeks as volatility is here to stay in the near term as it retests recent highs and looks to break through resistance of $30.
Silver Sep '20 Daily Chart If you have any questions or would like to discuss the markets further, please feel free to contact me at 800-826-2270 or therrmann@rjofutures.com. Energy - Oil's Demand Recovery in Focus
Oil's Demand Recovery in Focus
By: Alex Turro, Senior Market StrategistPosted Aug 14, 2020 9:35AM CT
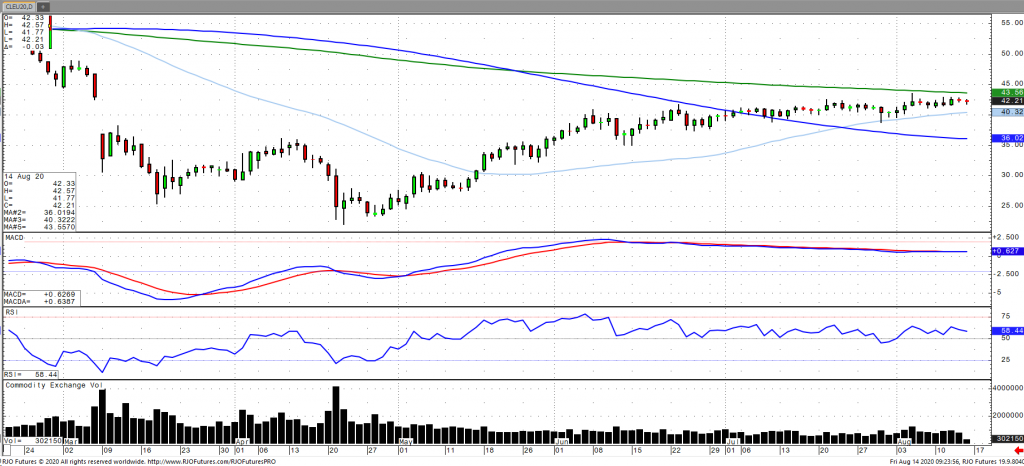
Oil prices are edging lower this morning as doubts regarding the demand recovery continue to persist well as concerns of increasing supply. OPEC+ are set to increase output this month of nearly an additional 2 million barrels a day, which comes as they lower their global oil demand forecast for the remainder of the year. A monitoring committee of OPEC+ are set to meet next week with Russian Energy Minister noting that he does not expect any decision regarding any further output cuts to be made. In addition, the International Energy Agency (EIA) cut their forecast as well down 140k barrels a day due to expectations of reduced air travel. Prices had been supported this week by data from EIA showing crude, gasoline and inventories all fell. The market remains bullish trend with today’s range seen between 40.08 – 42.91.
Crude Oil Sep '20 Daily Chart If you have any questions or would like to discuss the markets further, please feel free to contact me at 800-438-4805 or aturro@rjofutures.com. Softs - Coffee Due For Bounce Back
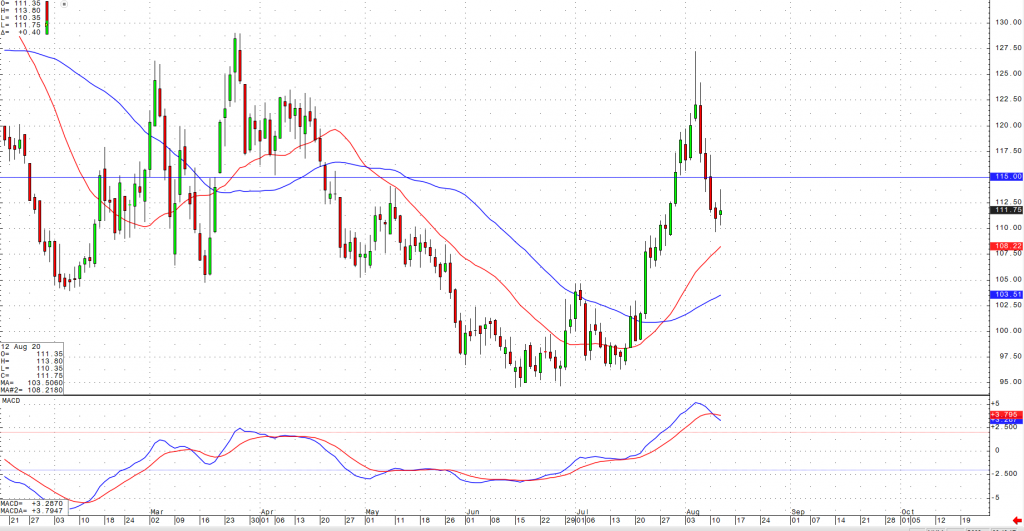
Coffee Due For Bounce Back
By: Adam TuiaanaPosted 08/12/2020
A recent with “risk-off” mentality across the
markets forced some long liquidation of various commodities, including the
price of September coffee. While coffee has experienced a volatile and
significant pullback to lows not seen since mid-May of this year, many traders
believe that with a continued weakening US Dollar and strength in the US
equities market, we should soon see September coffee prices hold support around
the 110 area.
While several States are still struggling with increased COVID-19 cases (due to increased testing capabilities), traders should remain extremely cautious that until our world is fully operational and back to normal, coffee prices will continue to suffer volatile swings and major moves. I’ll say it again, until that day when restaurants are permitted to increase their level of capacity (or even remain open), home coffee sales will not be nearly enough to offset the gaping void of demand left unfilled by restaurants and coffee shops. In addition, many of these restaurants and coffee shops may never return. From a technical perspective, we await a retest of the 120 level should take place over the next week and a close above 127 will be required in order to negate this most recent downturn.
On
the heels of mid-Sep-to-early-Oct's steeper, accelerated, 3rd-wave-looking
recovery, the past week-and-a-half's boringly lateral chop is first considered
a corrective/consolidative event that warns of a continuation of the uptrend
that preceded it to new highs above 04-Oct's 891.0 high. This count
remains consistent with our broader base/correction/recovery count introduced
in 13-Sep's Technical Blog following that
day's bullish divergence in short-term momentum above 07-Sep's 809.5 minor
corrective high detailed in the hourly chart below.
The
important takeaway from this month's lateral, sleepy price action is the
definition of Wed's 851.5 low as
the end or lower boundary of a suspected 4th-Wave correction. A failure
below 851.5 will confirm a bearish divergence in daily momentum and defer or
threaten a bullish count enough to warrant non-bullish decisions like
long-covers. A failure below 851.5 will not
necessarily negate a broader bullish count, but it will threaten it enough to
warrant defensive measures as the next pertinent technical levels below 851.5 are
13-Sep's prospective minor 1st-Wave high at 813.8 and obviously 08-Sep's 766.0
low. And making non-bullish decisions "down there" is
sub-optimal to say the least. Per such, both short- and longer-term
commercial traders are advised to pare or neutralize bullish exposure on a
failure below 851.5, acknowledging and accepting whipsaw risk- back above 04-Oct's
891.0 high- in exchange for much deeper and sub-optimal nominal risk below
766.0.
On
a broader scale, the daily log scale chart above shows the developing potential
for a bearish divergence in daily momentum that will be considered confirmed
below 851.5. This chart also shows the past month's recovery thus far
stalling in the immediate neighborhood of the (888.0) Fibonacci
minimum 38.2% retrace of Apr-Sep's entire 1128 - 766 decline). COMBINED
with a failure below 851.5, traders
would then need to be concerned with at least a larger-degree correction pf the
past month's rally and possibly a resumption of Apr-Sep's major downtrend.
Until
and unless the market fails below 851.5 however, we would
remind longer-term players of the key elements on which our bullish count is
predicated:
a confirmed bullish divergence in WEEKLY momentum
(below)
amidst
an
historically low 11% reading in out RJO Bullish Sentiment Index and
a
textbook complete and major 5-wave Elliott sequence down from 29-Apr's
1128 high to 08-Sep's 766.0 low.
Thus
far, the market is only a month into correcting a 4-MONTH, 32% drawdown, so
further and possibly protracted gains remain well within the bounds of a major
(suspected 2nd-Wave) correction of Apr-Sep's decline within an even more
massive PEAK/reversal process from 17-May's 1219 high on an active continuation
basis below.
These
issues considered, a bullish policy and exposure remain advised with a failure
below 851.5 required to defer or threaten this call enough to warrant moving to
a neutral/sideline position. In lieu of such weakness, we anticipate a
continuation of the past month's rally to new highs and potentially significant
gains above 891.0.
Agricultural - Grain Futures Update w/Stephen Davis - 08/14/2020
Grain Futures Update w/Stephen Davis - 08/14/2020
By: Stephen DavisPosted 08/14/2020
Stephen Davis discusses the grain futures markets. There is a high demand for grain in China amid a food shortage. The U.S.s and China are scheduled to meet Saturday. Hopefully some good comes out of it.Currency - USD Needs Positive Data to Regain Momentum Higher
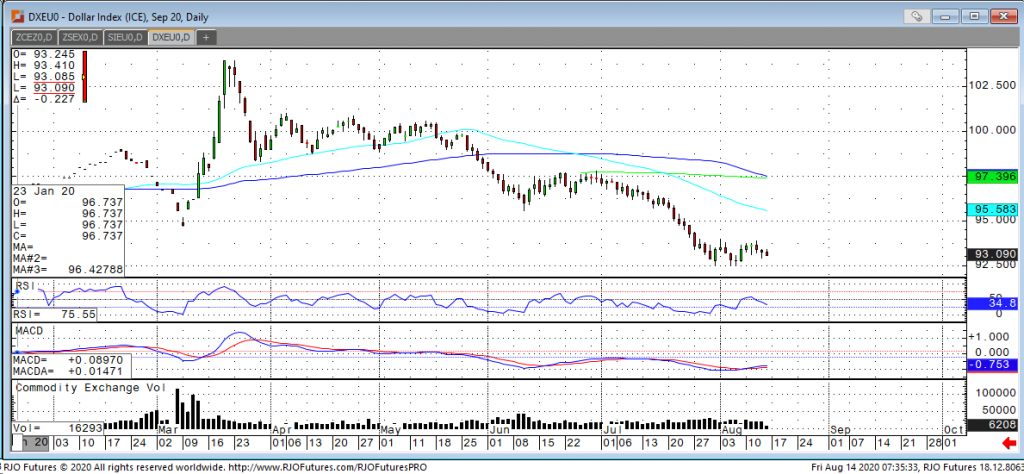
USD Needs Positive Data to Regain Momentum Higher
By: Tony Cholly, Senior Market StrategistPosted Aug 14, 2020 8:08AM CT
The USD has kept in a somewhat tight trading range, but has been unable to hold onto any early strength into this mornings action. The lack of progress being made on Capitol Hill coming up with a new stimulus package is providing support, as well as average Chinese economic data resulting in a negative shift in global risk sentiment. The dollar will need to avoid negative readings in industrial production and retail sales in order to regain some strength heading into the weekend. Near term resistance comes in at 9350 and support at 9303.
If you have any questions or would like to discuss the markets further, please feel free to contact me at 800-826-2270 or tcholly@rjofutures.com. Interest Rates - Interest Rates and the Almighty Dollar
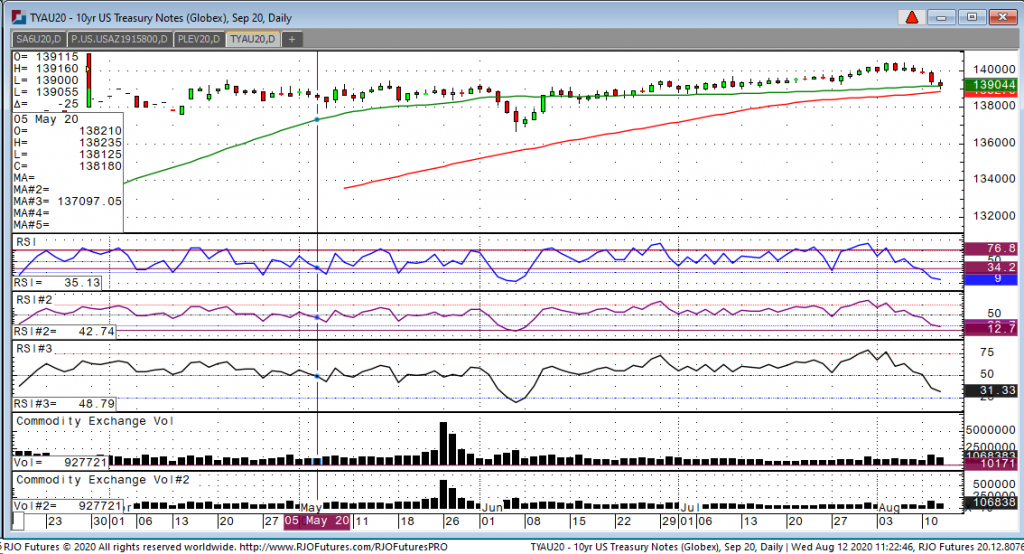
Looking at the September 10-year note, yesterday’s move was significant in terms of breaking the recent uptrend. We had a high yesterday of 139-30 and a low of 139-07 and settled at 139-075. Today’s action is negative with the contract making a lower high, 13916, and a lower low at 139-00, and is currently trading at 139-045. A number traders should be focused on is 139-04 which happens to be the 50-day moving average. A close below the 50-day moving average would be deemed negative. As I have written in the past, of the money being printed by the Federal Reserve has really hurt the dollar and at some point, will create inflation. The big problem that the Fed has created by printing all this money is the fact that they want rates near zero, which will in turn encourage individuals to borrow and increase spending. They are doing this for the purpose of propping up the economy. However, one has to worry if rates start to go up and the economy is still underperforming because of the virus, the Fed might in turn panic because inflation in this type of environment will kill any hopes of a V-shaped recovery.
10-Year note Sep '20 Daily Chart If you have any questions or would like to discuss the markets further, please feel free to contact me at 800-826-2270 or gperlin@rjofutures.com. Equity - Stocks Struggling to Build on Gains
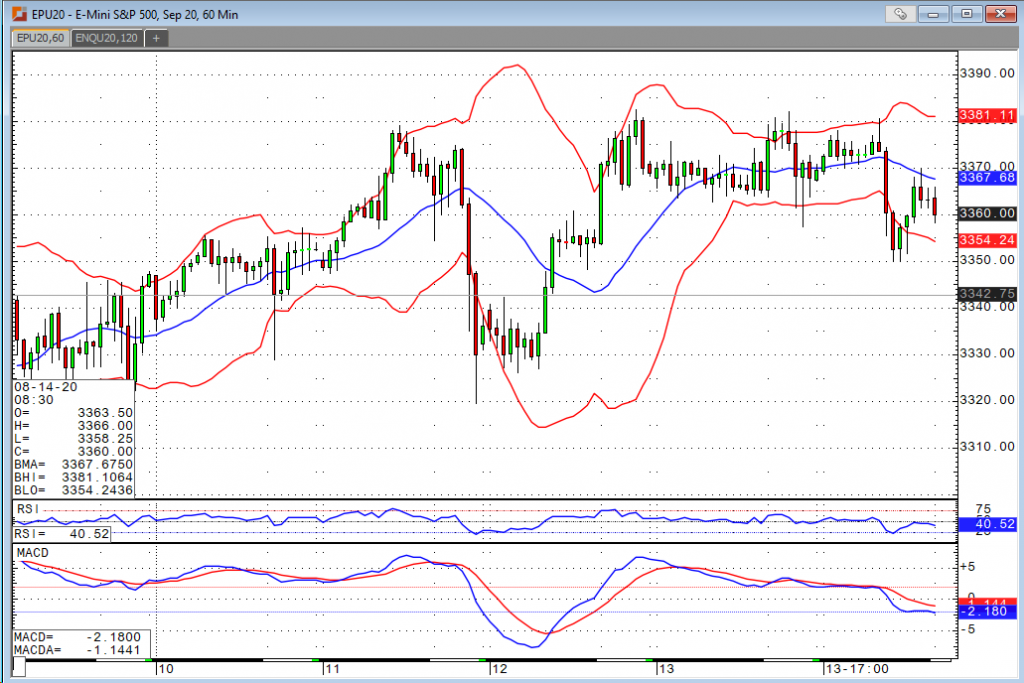
Stocks Struggling to Build on Gains
By: Bill Dixon, Senior Market StrategistPosted Aug 14, 2020 9:02AM CT
The four major U.S. indices are all struggling to print new highs and have seemed to establish solid levels of resistance this week. Following Monday’s and early Tuesday’s trades, I thought we were likely to see a new all-time high in the mini S&P. However, the trade has been rangebound ever since with the market having issues around the 3380 level. We’re seeing overbought readings from several technical indicators, and while we’ve struggled to continue the push higher this week, the selloffs haven’t been all that impressive either. This morning’s retail sales number was a bit mixed. We revised the prior reading higher but missed on the month over month change (1.2% vs. an expected 2.0%). The number less autos was a bit higher than estimated 1.5%, coming in at 1.9%. The data has sent the markets on a downward trend from where they were trading prior to the reading, but we’ll see how the rest of the day shapes up. Consumer sentiment is on deck at 9 CT, and consensus is expecting a reading of 71.9.
E-mini S&P 500 Sep '20 60-Min Chart If you have any questions or would like to discuss the markets further, please feel free to contact me at 800-669-5354 or bdixon@rjofutures.com. Economy - S-T Mo Failure Insufficient to End RBOB Correction, But Beware
S-T Mo Failure Insufficient to End RBOB Correction, But Beware
By: RJO Market InsightsPosted 11/08/2022
Posted on Nov 08, 2022, 07:51 by Dave Toth
In Fri's Technical Webcast we identified a
minor corrective low at 2.6328 from Thur as a mini risk parameter the market
needed to sustain gains above to maintain a more immediate bullish count.
The 240-min chart below shows the market's failure overnight below this level,
confirming a bearish divergence in very short-term momentum. This mo
failure defines Fri's 2.8172 high as
one of developing importance and a parameter from which very short-term traders
can objectively base non-bullish decisions like long-covers.
Given
the magnitude of the past three weeks' broader recovery however, this
short-term momentum failure is of an insufficient scale to conclude anything
more than another correction within this broader recovery from 26-Sep's 2.1877
low. Indeed, overnights failure below 2.6328 only allows us to conclude
the end of the portion of the month-and-a-half rally from 31-Oct's 2.4822 next
larger-degree corrective low. 2.4822 is the
risk parameter this market still needs to fail below to break the uptrend from
18-Oct's 2.3526 low while this 2.3526 low
remains intact as the risk parameter this market needs to fail below to break
the month-and-a-half uptrend. From an
intermediate-to-longer-term perspective, this week's setback falls well within
the bounds of another correction ahead of further gains. This is another
excellent example of the importance of technical and trading SCALE and
understanding and matching directional risk exposure to one's personal risk
profile.
The
reason overnight's admittedly minor mo failure might have longer-term
importance is the 2.8172-area from which it stemmed. In
Fri's Technical Blog we also noted the market's engagement of the
2.8076-to-2.8159-area marked by the 61.8% retrace of Jun0-Sewp's 3.2758 -2.1877
decline and the 1.000 progression of Sep-Oct's initial 2.1877 - 2.6185
(suspected a-Wave) rally from 18-Oct's 2.3526 (suspected b-Wave) low. We
remind longer-term players that because of the unique and compelling confluence
of:
early-Aug's bearish divergence in WEEKLY momentum
amidst
historically
extreme bullish sentiment/contrary opinion levels in our RJO Bullish
Sentiment Index
an
arguably complete and massive 5-wave Elliott sequence from Mar'20's 0.4605
low to Jun's 4.3260 high (as labeled in the weekly log active-continuation
chart below) and
the
5-wave impulsive sub-division of Jun-Sep's (suspected initial 1st-Wave) decline
The
recovery attempt from 26-Sep's 2.1877 low is arguably only a 3-wave (Wave-2)
corrective rebuttal to Jun-Sep's decline within a massive, multi-quarter
PEAK/reversal process. Now granted, due to the magnitude of 2020 -2022's
secular bull market, we discussed the prospect for this (2nd-Wave corrective)
recovery to be "extensive" in terms of both price and time. A
"more extensive" correction is typified by a retracement of 61.8% or
more and spanning weeks or even months following a 3-month decline. Per
such, the (suspected corrective) recovery from 26-Sep's 2.1877 low could easily
have further to go, with commensurately larger-degree weakness than that
exhibited this week (i.e., a failure below at least 2.4822) required
to consider the correction complete. Indeed, the daily log chart above
shows the market thus far respecting former 2.6185-area resistance from 10-Oct
as a new support candidate.
These
issues considered, very shorter-term traders have been advised to move to a neutral/sideline
position following overnight's momentum failure below 2.6328, with a recovery
above 2.8172 required to negate this call, reaffirm the recovery and re-expose
potentially significant gains thereafter. For intermediate- and
longer-term players, a bullish policy and exposure remain advised with a
failure below 2.4822 required to threaten this call enough to warrant
neutralizing exposure. We will be watchful for another bearish divergence
in momentum following a recovery attempt that falls short of Fri's 2.8172 high
that would be considered the next reinforcing factor to a count calling that
2.8172 high the prospective end to the month-and-a-half 2nd-Wave
correction. In lieu of such, a resumption of the current rally to
eventual new highs above 2.8172 should not surprise.