The difference between historical & implied volatility
How to spot regimes of high and low volatility
Which option strategies to apply and when
How to read price action to support your option trades
Agricultural Investor Kit
Opportunities Exist in the Ag Markets Right Now –
Have you ever wanted to trade the grain markets but didn’t know where to start? Are you looking for a more informed and disciplined approach to up your trading game? Then this Investor kit is for you! In this comprehensive kit you will find everything you need to help you and take advantage of the opportunities that exist in the grain markets right now!
The Markets
Metals - Is It Too Soon to Call a Bottom in Gold?
Is It Too Soon to Call a Bottom in Gold?
By: Frank J. Cholly, Senior Market StrategistPosted Sep 25, 2020 9:07AM CT
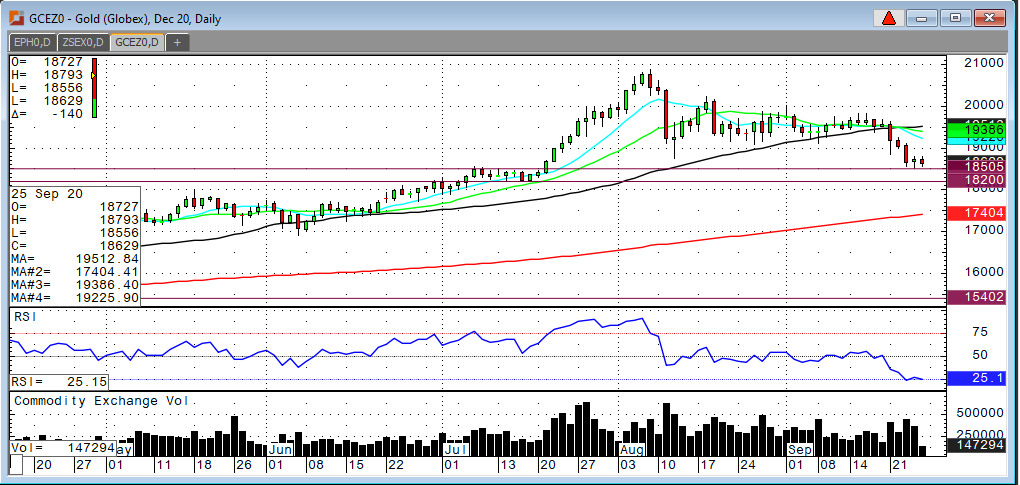
Yes, but you know that it’s just a level on the chart that turns a market around. That level may turn out to be $1,850 in the December gold. $1,850 looks like it’s a decent support level so far. Unfortunately, this is a “rearview mirror” business and we won’t know for sure until it’s behind us. The gold market is oversold and does appear to be losing some momentum. I think that the gold and equity markets are disappointed in a lack of further stimulus. I know there’s a lot of talk about deflation. Fears of a slowing global economy and another UK lockdown. However, I do believe that there is a good long term buy level somewhere between $1,860 to $1,820. This is a correction. Not a reversal! Even without an immediate additional stimulus package, there’s a ton of money out there. The Dollar rally will likely fizzle out at .9500. Rising debt and deficit won’t suddenly evaporate. Uncertainty doesn’t suddenly become clear! The Fed is committed to keeping rates low for long and allowing inflation to overshoot their target rate. Gold is still something that we all should want to own, and this dip is a good buying opportunity.
Gold Dec '20 Daily Chart If you have any questions or would like to discuss the markets further, please feel free to contact me at 800-826-4124 or fcholly@rjofutures.com. Metals - Silver Having a Bad Week
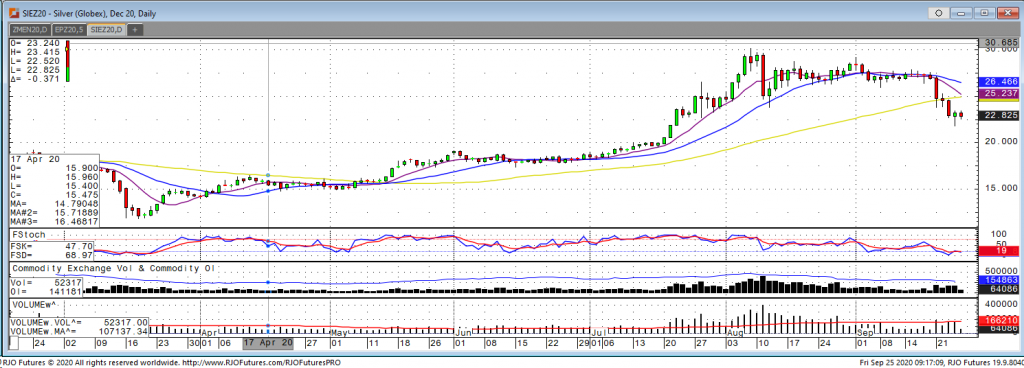
The December silver contract opened the week with a big down day, breaking through support of 26.60 and 24.91. We saw the market continue lower throughout the week as it followed the stock market lower, both being pushed by the rising US dollar. There was a glimmer of hope on Thursday when the market closed green despite putting in the weekly low. This morning Dec silver is off its overnight lows but still negative for the day. Although the Fed said this week they will continue to do whatever is necessary, Powell looked to Congress to provide fiscal support for the economy which shows that there could be continued demand destruction and negative views towards physical commodities. The rally in the US dollar looks to continue which will give silver bears the edge in the coming weeks ahead, especially if Trump enacts tariffs against China as mentioned this week. The December silver contract needs to hold above 22.55 as a break of that would likely cause a washout to 19.80 and then 18.00 if the move lower continues. The bulls are wanting to see trade above what now is resistance at 24.91 to regain the trend to the upside. Right now with all the uncertainty in the upcoming election, possible economic slowing, and rising U.S. dollar all signs point to the bears being in control for the time being.
Silver Dec '20 Daily Chart
If you have any questions or would like to discuss the markets further, please feel free to contact me at 800-826-2270 or therrmann@rjofutures.com. Energy - Crude Steady Despite Faltering Demand Outlook
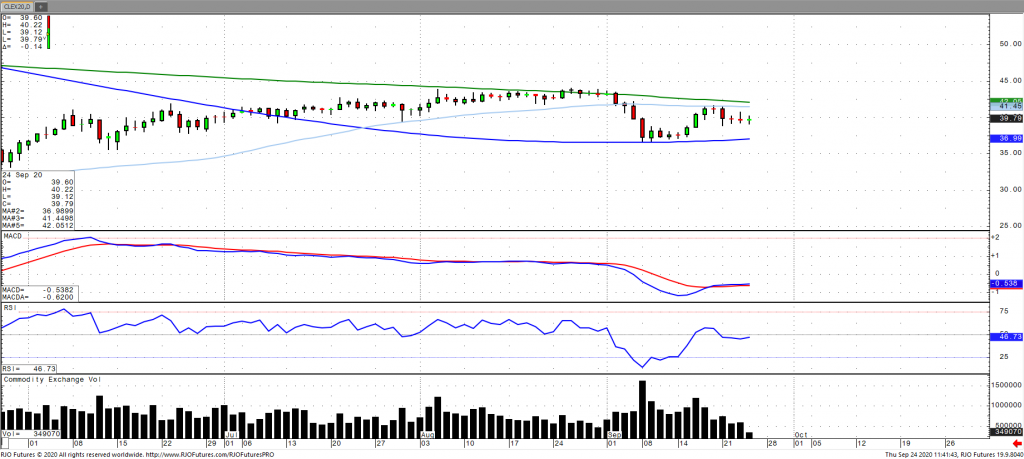
Oil prices are holding steady and are recovering off their lows early Thursday as the U.S. dollar is relieving some of its downward pressure with a current strong inverse correlation on a trending basis (90 day) with oil (Brent) of -0.71. The U.S. dollar has rallied over the course of the last couple sessions amidst a resurgence in coronavirus cases, which had many turning to safer assets. Demand prospects continue to be weak as renewed outbreak concerns in Europe continue to undermine the case for a steadfast recovery in global growth. Minimal support may have been garnered from a decline in weekly inventories, which more than likely may have been a result of productions shutdowns in the Gulf over the course of the last couple weeks. Regarding the supply side, Libya is expected to ramp up production likely boosting output to 260k bpd by next week. Oil volatility (OVX) has now broken out above trend (~39.50) with WTI now bearish trend with today’s range seen between 36.43 – 40.90
Crude Oil Nov '20 Daily Chart If you have any questions or would like to discuss the markets further, please feel free to contact me at 800-438-4805 or aturro@rjofutures.com. Softs - Coffee Gets Grounded
Coffee Gets Grounded
By: Adam TuiaanaPosted 09/23/2020
December coffee prices have taken and incredible
hit over the last couple of weeks as on year production forecast for Brazilian
coffee is near-record high levels. This overwhelming bearish-supply side news
is surfacing during ongoing confusion and volatility, relating to re-emerging
COVID 19 shutdowns in the UK. The issue
continues to be the lack of secure demand to meet this supply, which is
currently pricing in a glut.
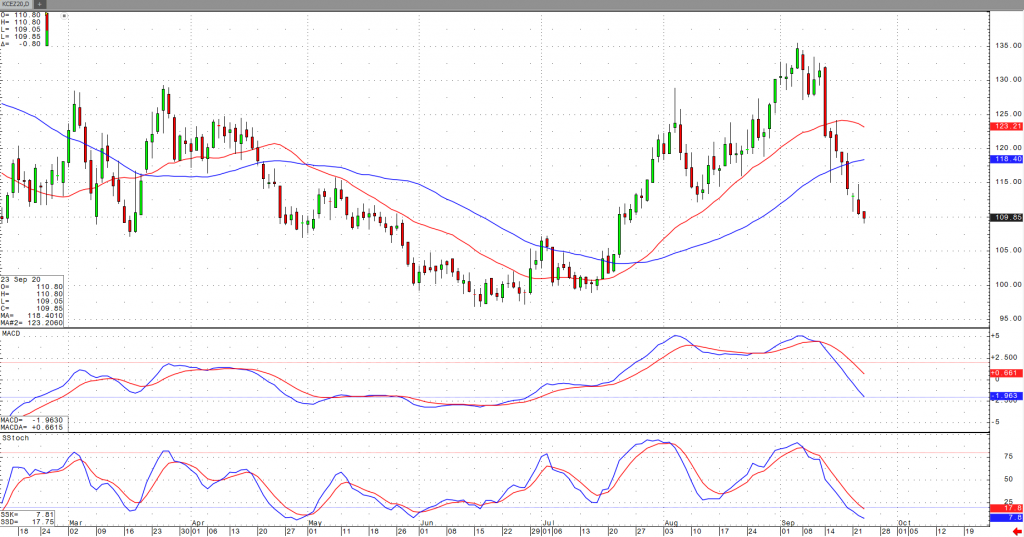
The U.S. dollar continues to garner strength, with many traders noting a clear upside breakout above resistance levels, and as a result, most all commodities have experienced a strong selloff. As we continue to struggle with revenues of restaurants, bars and coffee shops being weighed down severely by limited occupancy, more and more of these types of businesses are filing for bankruptcy and will never return. This is lack of demand that will leave an enormous void in the marketplace. From a technical perspective, a recent dive below the 50-day MA at the 118 level, should be viewed as continued bearish, but such an aggressive selloff should result in a subsequent correction back to the 118 level. Until more demand news surfaces, I would expect a continued selloff at this time.
On
the heels of mid-Sep-to-early-Oct's steeper, accelerated, 3rd-wave-looking
recovery, the past week-and-a-half's boringly lateral chop is first considered
a corrective/consolidative event that warns of a continuation of the uptrend
that preceded it to new highs above 04-Oct's 891.0 high. This count
remains consistent with our broader base/correction/recovery count introduced
in 13-Sep's Technical Blog following that
day's bullish divergence in short-term momentum above 07-Sep's 809.5 minor
corrective high detailed in the hourly chart below.
The
important takeaway from this month's lateral, sleepy price action is the
definition of Wed's 851.5 low as
the end or lower boundary of a suspected 4th-Wave correction. A failure
below 851.5 will confirm a bearish divergence in daily momentum and defer or
threaten a bullish count enough to warrant non-bullish decisions like
long-covers. A failure below 851.5 will not
necessarily negate a broader bullish count, but it will threaten it enough to
warrant defensive measures as the next pertinent technical levels below 851.5 are
13-Sep's prospective minor 1st-Wave high at 813.8 and obviously 08-Sep's 766.0
low. And making non-bullish decisions "down there" is
sub-optimal to say the least. Per such, both short- and longer-term
commercial traders are advised to pare or neutralize bullish exposure on a
failure below 851.5, acknowledging and accepting whipsaw risk- back above 04-Oct's
891.0 high- in exchange for much deeper and sub-optimal nominal risk below
766.0.
On
a broader scale, the daily log scale chart above shows the developing potential
for a bearish divergence in daily momentum that will be considered confirmed
below 851.5. This chart also shows the past month's recovery thus far
stalling in the immediate neighborhood of the (888.0) Fibonacci
minimum 38.2% retrace of Apr-Sep's entire 1128 - 766 decline). COMBINED
with a failure below 851.5, traders
would then need to be concerned with at least a larger-degree correction pf the
past month's rally and possibly a resumption of Apr-Sep's major downtrend.
Until
and unless the market fails below 851.5 however, we would
remind longer-term players of the key elements on which our bullish count is
predicated:
a confirmed bullish divergence in WEEKLY momentum
(below)
amidst
an
historically low 11% reading in out RJO Bullish Sentiment Index and
a
textbook complete and major 5-wave Elliott sequence down from 29-Apr's
1128 high to 08-Sep's 766.0 low.
Thus
far, the market is only a month into correcting a 4-MONTH, 32% drawdown, so
further and possibly protracted gains remain well within the bounds of a major
(suspected 2nd-Wave) correction of Apr-Sep's decline within an even more
massive PEAK/reversal process from 17-May's 1219 high on an active continuation
basis below.
These
issues considered, a bullish policy and exposure remain advised with a failure
below 851.5 required to defer or threaten this call enough to warrant moving to
a neutral/sideline position. In lieu of such weakness, we anticipate a
continuation of the past month's rally to new highs and potentially significant
gains above 891.0.
Agricultural - Grain Futures Update w/Stephen Davis - 09/25/2020
Grain Futures Update w/Stephen Davis - 09/25/2020
By: Stephen DavisPosted 09/25/2020
Stephen Davis discusses the latest news in the grain markets, including some positive numbers from the corn and soybean markets.Interest Rates - Interest Rate Trend is Narrow
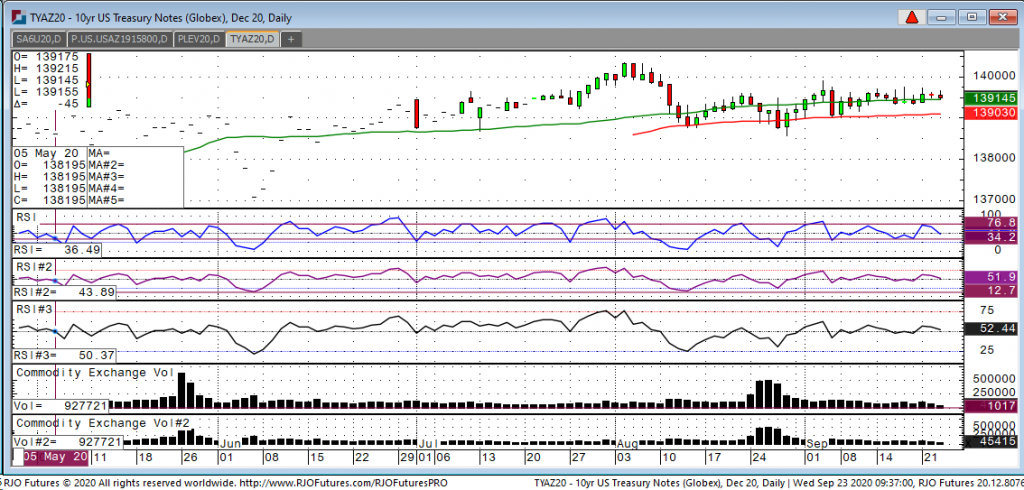
We have been in a very tight range for about a week in the 10-year note, which is a bit surprising due to the volatility that we are seeing in stocks. Although the trading range has been narrowing, it has been a good trade for investors. We as traders can easily spot this type of trade and act on it. We call this type of trade “trading the range” which in simple terms means buying the dips and selling the rallies. Being more precise, traders should look to sell rallies near the top end of the range at 139-22-235 and buy the dip near 139-11-10. It works till it doesn’t. So, I recommend traders to continue to look at these opportunities, but be on guard because the market is coiling, which means the trade could break out of this range and extend in the direction of the move. So, as discussed above, the trend is sideways which means you can buy breaks and sell rallies.
10-Year Note Dec'20 Daily Chart If you have any questions or would like to discuss the markets further, please feel free to contact me at 800-826-2270 or gperlin@rjofutures.com. Equity - Stocks Off Lows In Early Going
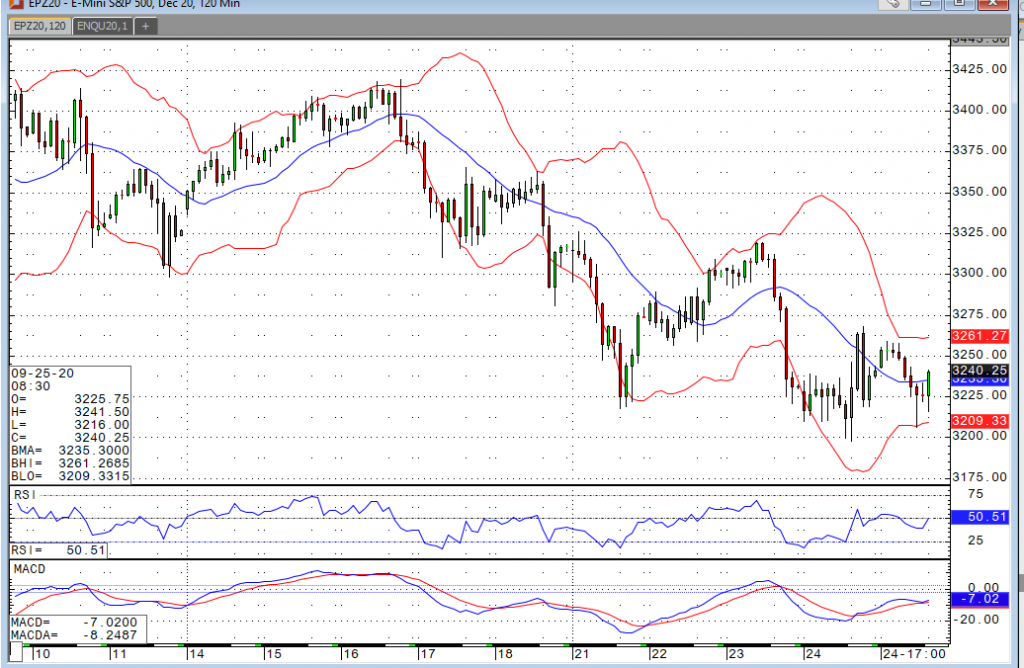
The S&P 500 traded down to the 3210 support level in the wee hours of the morning but has managed to recover nicely. Hopes and rumors of an actual deal on further stimulus have not been able to rally the market, but it looks like it has at least been enough to pump the breaks on the selloff. After those in Washington let the deal deadline pass two and a half months ago, we’ve heard little to suggest the two sides have gotten any closer. However, the tune seems to have changed a bit over the past few days. While talks are ongoing, early indications suggest the two sides are still a trillion dollars apart. We’ll continue to monitor the news for any progress on the matter. For the time being, the market seems to want some actual substance before we see any uptick.
The market is sitting just below the 50% retracement between the 6/29 low and 9/2 high. I believe this level will prove to be support should we make any actual progress towards passing another stimulus package, but politics are ramping up as we head down the final stretch of the election. Absent some kind of a deal, I see 3105 as the next level of support. Either way, it should be a wild five and a half weeks leading up to the election.
E-mini S&P 500 120min Chart If you have any questions or would like to discuss the markets further, please feel free to contact me at 800-669-5354 or bdixon@rjofutures.com. Economy - S-T Mo Failure Insufficient to End RBOB Correction, But Beware
S-T Mo Failure Insufficient to End RBOB Correction, But Beware
By: RJO Market InsightsPosted 11/08/2022
Posted on Nov 08, 2022, 07:51 by Dave Toth
In Fri's Technical Webcast we identified a
minor corrective low at 2.6328 from Thur as a mini risk parameter the market
needed to sustain gains above to maintain a more immediate bullish count.
The 240-min chart below shows the market's failure overnight below this level,
confirming a bearish divergence in very short-term momentum. This mo
failure defines Fri's 2.8172 high as
one of developing importance and a parameter from which very short-term traders
can objectively base non-bullish decisions like long-covers.
Given
the magnitude of the past three weeks' broader recovery however, this
short-term momentum failure is of an insufficient scale to conclude anything
more than another correction within this broader recovery from 26-Sep's 2.1877
low. Indeed, overnights failure below 2.6328 only allows us to conclude
the end of the portion of the month-and-a-half rally from 31-Oct's 2.4822 next
larger-degree corrective low. 2.4822 is the
risk parameter this market still needs to fail below to break the uptrend from
18-Oct's 2.3526 low while this 2.3526 low
remains intact as the risk parameter this market needs to fail below to break
the month-and-a-half uptrend. From an
intermediate-to-longer-term perspective, this week's setback falls well within
the bounds of another correction ahead of further gains. This is another
excellent example of the importance of technical and trading SCALE and
understanding and matching directional risk exposure to one's personal risk
profile.
The
reason overnight's admittedly minor mo failure might have longer-term
importance is the 2.8172-area from which it stemmed. In
Fri's Technical Blog we also noted the market's engagement of the
2.8076-to-2.8159-area marked by the 61.8% retrace of Jun0-Sewp's 3.2758 -2.1877
decline and the 1.000 progression of Sep-Oct's initial 2.1877 - 2.6185
(suspected a-Wave) rally from 18-Oct's 2.3526 (suspected b-Wave) low. We
remind longer-term players that because of the unique and compelling confluence
of:
early-Aug's bearish divergence in WEEKLY momentum
amidst
historically
extreme bullish sentiment/contrary opinion levels in our RJO Bullish
Sentiment Index
an
arguably complete and massive 5-wave Elliott sequence from Mar'20's 0.4605
low to Jun's 4.3260 high (as labeled in the weekly log active-continuation
chart below) and
the
5-wave impulsive sub-division of Jun-Sep's (suspected initial 1st-Wave) decline
The
recovery attempt from 26-Sep's 2.1877 low is arguably only a 3-wave (Wave-2)
corrective rebuttal to Jun-Sep's decline within a massive, multi-quarter
PEAK/reversal process. Now granted, due to the magnitude of 2020 -2022's
secular bull market, we discussed the prospect for this (2nd-Wave corrective)
recovery to be "extensive" in terms of both price and time. A
"more extensive" correction is typified by a retracement of 61.8% or
more and spanning weeks or even months following a 3-month decline. Per
such, the (suspected corrective) recovery from 26-Sep's 2.1877 low could easily
have further to go, with commensurately larger-degree weakness than that
exhibited this week (i.e., a failure below at least 2.4822) required
to consider the correction complete. Indeed, the daily log chart above
shows the market thus far respecting former 2.6185-area resistance from 10-Oct
as a new support candidate.
These
issues considered, very shorter-term traders have been advised to move to a neutral/sideline
position following overnight's momentum failure below 2.6328, with a recovery
above 2.8172 required to negate this call, reaffirm the recovery and re-expose
potentially significant gains thereafter. For intermediate- and
longer-term players, a bullish policy and exposure remain advised with a
failure below 2.4822 required to threaten this call enough to warrant
neutralizing exposure. We will be watchful for another bearish divergence
in momentum following a recovery attempt that falls short of Fri's 2.8172 high
that would be considered the next reinforcing factor to a count calling that
2.8172 high the prospective end to the month-and-a-half 2nd-Wave
correction. In lieu of such, a resumption of the current rally to
eventual new highs above 2.8172 should not surprise.