Energy is something that has been traded and used since the dawn of man and is continually used by billions around the world today. We have assembled this kit with goal of informing you how to make money off these precious commodities. The Energy Investor Kit is complete with detailed fundamental and technical analysis on the energy sector and will teach you how to navigate these ever important and potentially lucrative markets.
RJO Futures PRO Trading Platform
FREE 100k Simulated Trading Account
Experience a trading platform like no other with integrated tools to seamlessly trade and monitor the markets. With a free simulated trading account and personal broker experience, we’ll teach you about futures trading and help you develop a trading strategy.
The Markets
Metals - No Stimulus, No Gold Rally
No Stimulus, No Gold Rally
By: Joshua GravesPosted 10/23/2020
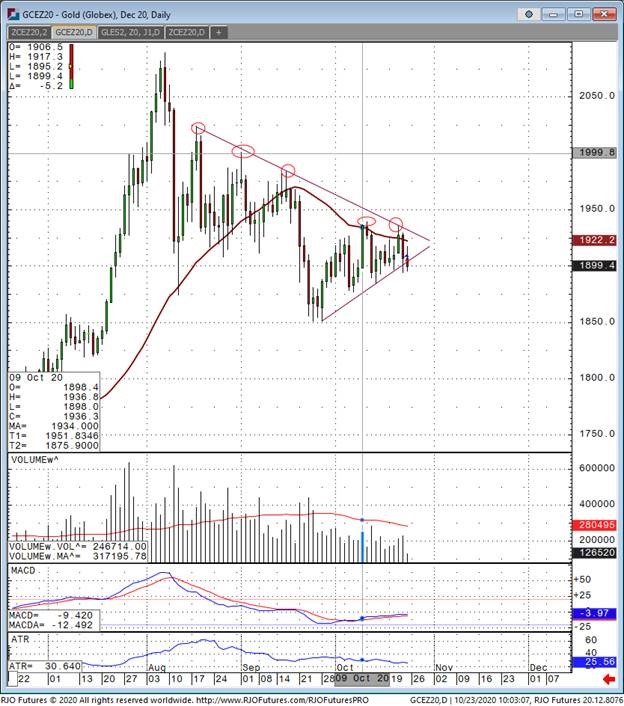
December gold futures continue to draw in buyers on what looks like well below average trading volume over the past few weeks. If there was a chance for gold to rally it was going to be yesterday or really anytime this week with all the back and forth between Speaker Pelosi and Treasury Secretary Mnuchin. There was plenty of infighting among democrats and republicans as a stimulus deal continues to become more and more elusive. I am looking at technical aspects of gold alone at this point and closely watching for an announcement of a stimulus deal potentially being reached. A deal being reached for what appears to be just shy of $2T would surely push gold into a breakout zone which I see as anything above $1940. This is a key level for traders to watch as it’s a significant technical level as it breaches the down trend we have been in since August 18th. Anyone buying gold here is clearly wanting a stimulus package to be passed, but again the chances continue to dwindle with what I would say as 20% chance of a “deal” being reached before the election. Gold this morning is trading as I write this, under the $1900 level and breaking the slight upward trend we’ve in since September 28th. I would say that the trading activity this morning is more concerning as gold is really struggling to hold onto gains and any further slip here will likely trigger selling down to the multi month lows of $1850 in a hurry. Traders should be positioning short with hedge protection with options in place, which can be done quite cheap. Please contact me directly for strategy development.
Gold Dec '20 Daily ChartMetals - Silver Going Sideways
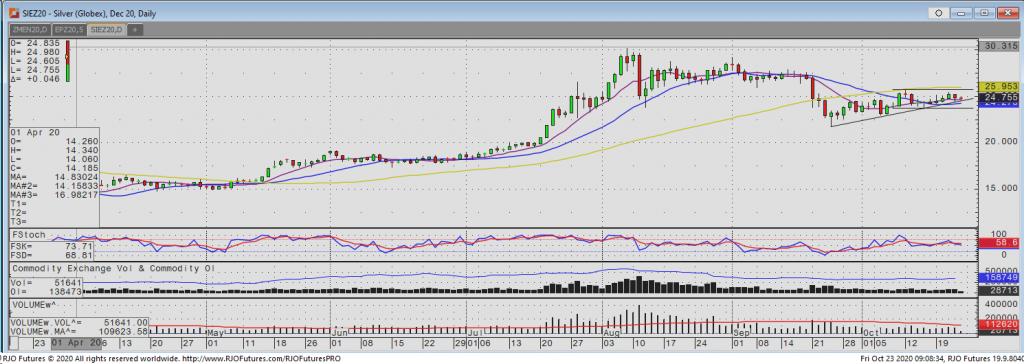
This week we saw the December silver market chop sideways, staying in a range of 24.215 and 25.425, with the high being posted on Wednesday. Even with the US dollar moving lower this week, the silver market seemed to take more focus on the status of a stimulus package and whether it will be passed before the election. Reports of a possible inflationary environment also seemed to be ignored by the silver market this week, an event which would be supportive to both gold and silver if it happened. Even the better than expected US economic data that was seen yesterday was unable to garnish much support. If we were to see a stimulus package agreed upon today, silver should push through resistance and out of this sideways range it has been in since falling to new recent lows in the second part of September. If a stimulus package isn’t passed today and more importantly hinted that it won’t be passed until after the election, then expect to see silver fall lower to support around 23.65-23.85. Resistance comes in around 25.50-25.70 and that’s the area we would need to see the market trade through to re establish the trend to the upside. From a technical standpoint it looks like December silver is going to make a breakout in one direction, I feel that it depends on the fundamental data we receive to determine the direction.
Silver Dec '20 Daily Chart If you have any questions or would like to discuss the markets further, please feel free to contact me at 800-826-2270 or therrmann@rjofutures.com. Energy - Oil Poised for Weekly Decline
Oil Poised for Weekly Decline
By: Alex Turro, Senior Market StrategistPosted Oct 23, 2020 9:50AM CT
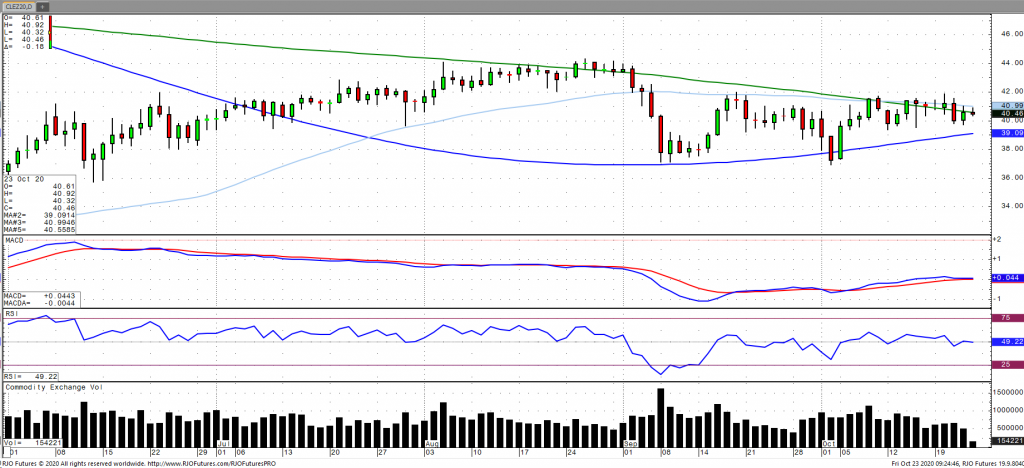
Oil prices have been ticking higher since Wednesday’s losses but have yet to fully recover as a build in weekly gasoline inventories only added further concern to the recovery outlook for fuel demand as corona cases continue to surge. US gasoline stocks rose 1.9 million barrels with the expectation of a 1.8-million-barrel decline, according to the EIA. This has been coupled with a potential new (second) wave of cases that is only continuing to cripple the already faltering demand outlook. Regarding supply, Libyan exports have been continuing to increase with production already recovering to nearly 500k barrels a day with the expectation of those production totals doubling by year end. Some support may have been garnered with reports that Chinese September oil imports rose 17.6% over year ago levels as well as a downward revision in Russian oil output for 2020. Oil volatility (OVX) is starting to signal a lower high with the market teetering the near-term bull/bear line of 40.38 and has transitioned to neutral trend with today’s range seen between 39.35 – 42.14.
Crude Oil Dec '20 Daily Chart If you have any questions or would like to discuss the markets further, please feel free to contact me at 800-438-4805 or aturro@rjofutures.com. Softs - Coffee Needs More Demand
Coffee Needs More Demand
By: Adam TuiaanaPosted 10/21/2020
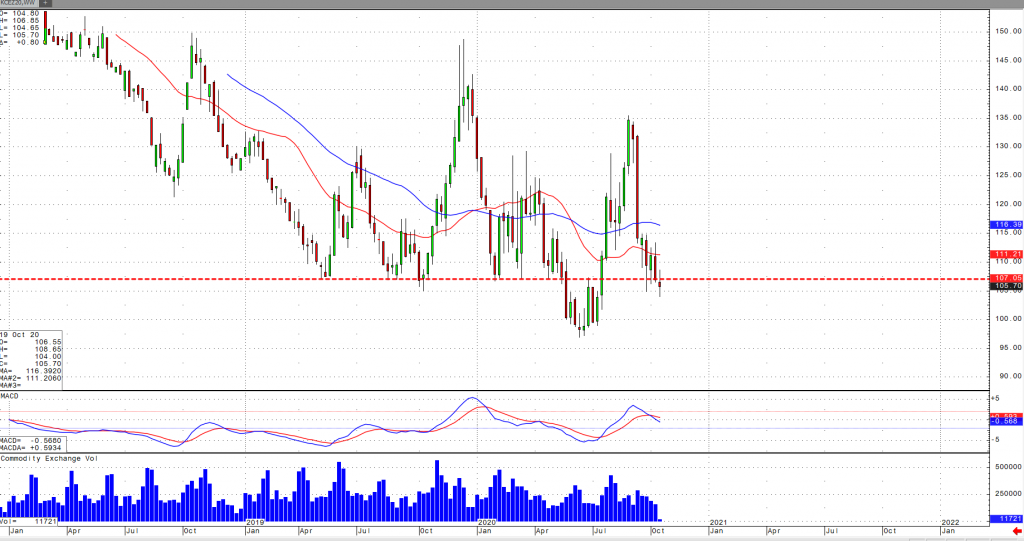
December coffee continues to visit levels that have not been seen since Jun-July of this year, when new Covid-19 cases began to spike to the highest global levels. New lockdown measures through Europe have not helped the demand fundamentals of coffee, and with the US equities markets on a seemingly perpetual “teeter-tottering” basis, we can expect more of the same. Ultra-volatile market swings in commodities due to what has become less of a measure to help Americans with a much-needed stimulus package, but rather a pre-Halloween Horror Story of politicized measures by both Red and Blue parties to jockey for first position in bragging rights related to championing the cause of “The People”. The back and forth negotiations (and non-negotiations) which have dragged on for far too long have taken their toll on this economy from a demand perspective not only for coffee, but several other commodities that hang in the balance. From a technical perspective, December coffee prices have become very comfortable trading well below the 200-day MA (now resting at around the 112 level) is bearish, and likely will see follow through selling to the key support area of 100. We also can also make notice a consolidated bear pennant which if fulfilled (as a continuation pattern), could push December coffee prices to at or about the 100 level. I would expect a continued selloff at this time.
On
the heels of mid-Sep-to-early-Oct's steeper, accelerated, 3rd-wave-looking
recovery, the past week-and-a-half's boringly lateral chop is first considered
a corrective/consolidative event that warns of a continuation of the uptrend
that preceded it to new highs above 04-Oct's 891.0 high. This count
remains consistent with our broader base/correction/recovery count introduced
in 13-Sep's Technical Blog following that
day's bullish divergence in short-term momentum above 07-Sep's 809.5 minor
corrective high detailed in the hourly chart below.
The
important takeaway from this month's lateral, sleepy price action is the
definition of Wed's 851.5 low as
the end or lower boundary of a suspected 4th-Wave correction. A failure
below 851.5 will confirm a bearish divergence in daily momentum and defer or
threaten a bullish count enough to warrant non-bullish decisions like
long-covers. A failure below 851.5 will not
necessarily negate a broader bullish count, but it will threaten it enough to
warrant defensive measures as the next pertinent technical levels below 851.5 are
13-Sep's prospective minor 1st-Wave high at 813.8 and obviously 08-Sep's 766.0
low. And making non-bullish decisions "down there" is
sub-optimal to say the least. Per such, both short- and longer-term
commercial traders are advised to pare or neutralize bullish exposure on a
failure below 851.5, acknowledging and accepting whipsaw risk- back above 04-Oct's
891.0 high- in exchange for much deeper and sub-optimal nominal risk below
766.0.
On
a broader scale, the daily log scale chart above shows the developing potential
for a bearish divergence in daily momentum that will be considered confirmed
below 851.5. This chart also shows the past month's recovery thus far
stalling in the immediate neighborhood of the (888.0) Fibonacci
minimum 38.2% retrace of Apr-Sep's entire 1128 - 766 decline). COMBINED
with a failure below 851.5, traders
would then need to be concerned with at least a larger-degree correction pf the
past month's rally and possibly a resumption of Apr-Sep's major downtrend.
Until
and unless the market fails below 851.5 however, we would
remind longer-term players of the key elements on which our bullish count is
predicated:
a confirmed bullish divergence in WEEKLY momentum
(below)
amidst
an
historically low 11% reading in out RJO Bullish Sentiment Index and
a
textbook complete and major 5-wave Elliott sequence down from 29-Apr's
1128 high to 08-Sep's 766.0 low.
Thus
far, the market is only a month into correcting a 4-MONTH, 32% drawdown, so
further and possibly protracted gains remain well within the bounds of a major
(suspected 2nd-Wave) correction of Apr-Sep's decline within an even more
massive PEAK/reversal process from 17-May's 1219 high on an active continuation
basis below.
These
issues considered, a bullish policy and exposure remain advised with a failure
below 851.5 required to defer or threaten this call enough to warrant moving to
a neutral/sideline position. In lieu of such weakness, we anticipate a
continuation of the past month's rally to new highs and potentially significant
gains above 891.0.
Agricultural - Grain Futures Update w/Stephen Davis - 10/22/2020
Grain Futures Update w/Stephen Davis - 10/22/2020
By: Stephen DavisPosted 10/22/2020
Stephen Davis discusses the latest factors moving the grain markets. Stephen believes that China has no choice but to keep buying U.S. grains which bodes well for us moving forward.Interest Rates - Interest Rates Waiting on Stimulus Package
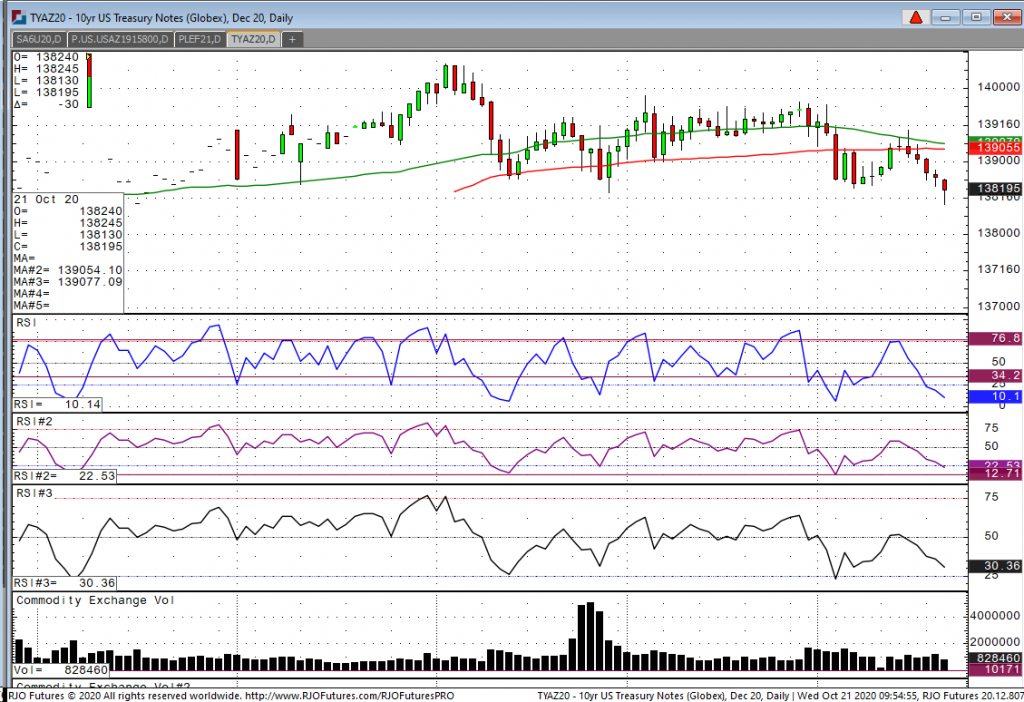
Looking at the last 5 days in the December 10-year, the
market clearly has a bearish tilt with today making five days of consecutive lows
and the contract trading below the 100-day moving average last Thursday at
139-05. Currently, we are trading four-month lows with today reaching 138-13
and we are now trading at 138-19. The
main factors for this move lower is the ongoing talk in Congress that a coronavirus
relief bill will be past at some point. It’s not a matter of if it will be
passed, but rather when. If Biden is
elected, many feel like the number could be bigger in terms of dollars than
what is being discussed now.
This has all contributed to the near-term weakness that we are currently seeing in the note complex. Now switching gears, a bit, the virus is getting much worse now and many in the health industry feel like the major second wave has arrived with autumn coming to an end. That being said, I wouldn’t recommend being to bearish at these levels because if the economy goes back into a partial or full lockdown again to try to curb transmission, the net effect will result in the economy coming to an abrupt halt like we saw in March. So, even though the treasuries are trading terrible, any significant slowdown in the economy can push rates lower and price higher in a very quick move.
10yr Note Dec '20 Daily Chart If you have any questions or would like to discuss the markets further, please feel free to contact me at 800-826-2270 or gperlin@rjofutures.com. Equity - Stimulus Uncertainty Continues
Stimulus Uncertainty Continues
By: Bill Dixon, Senior Market StrategistPosted Oct 23, 2020 9:35AM CT
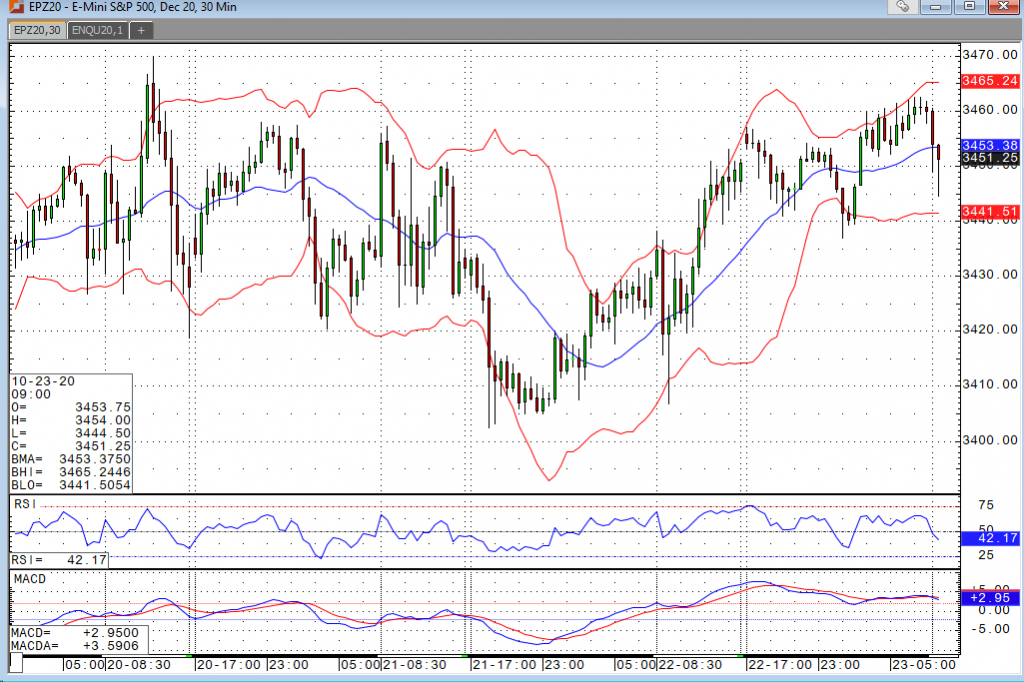
Nearly two and a half months ago, I stopped just short of promising to eat my hat if we didn’t reach some kind of a deal before the August deadline. Here we are just a week and a half away from the election, and now I’m about as certain that nothing will get done leading up to the event. Granted I was wrong then, and perhaps I will be again. The left doesn’t want to give Trump any kind of a victory at this point. The right doesn’t want to throw as much money towards a package as Trump and the left are talking about into the mix. At this point, seeing will be believing, but the market seems to still have some confidence something will get done. I tend to agree, I just feel it will be after the election at this point (regardless of who comes out on top). They say markets are forward looking, and that appears to be the case right now.
Stocks are slightly lower to start things off today in what has been a pretty quiet week. The S&P futures have spent nearly all of the past few sessions trading within a 30 tick range (3425-3455) after failing to reach a new all-time high last week. Given all of the gridlock and uncertainty out there, one has to be impressed that the market continues to hold firm. Many investors seem to be raising cash heading into the election, but I believe they’ll be looking to reallocate those funds into the market should we get a selloff of any significance. Coronavirus cases seem to be spiking again across the globe, and lockdown discussions are back in the news. I doubt we’ll see another selloff of the magnitude we saw in the first quarter, but I continue to feel that dips are buying opportunities.
E-mini S&P 500 Dec 20 60min Chart If you have any questions or would like to discuss the markets further, please feel free to contact me at 800-669-5354 or bdixon@rjofutures.com. Economy - S-T Mo Failure Insufficient to End RBOB Correction, But Beware
S-T Mo Failure Insufficient to End RBOB Correction, But Beware
By: RJO Market InsightsPosted 11/08/2022
Posted on Nov 08, 2022, 07:51 by Dave Toth
In Fri's Technical Webcast we identified a
minor corrective low at 2.6328 from Thur as a mini risk parameter the market
needed to sustain gains above to maintain a more immediate bullish count.
The 240-min chart below shows the market's failure overnight below this level,
confirming a bearish divergence in very short-term momentum. This mo
failure defines Fri's 2.8172 high as
one of developing importance and a parameter from which very short-term traders
can objectively base non-bullish decisions like long-covers.
Given
the magnitude of the past three weeks' broader recovery however, this
short-term momentum failure is of an insufficient scale to conclude anything
more than another correction within this broader recovery from 26-Sep's 2.1877
low. Indeed, overnights failure below 2.6328 only allows us to conclude
the end of the portion of the month-and-a-half rally from 31-Oct's 2.4822 next
larger-degree corrective low. 2.4822 is the
risk parameter this market still needs to fail below to break the uptrend from
18-Oct's 2.3526 low while this 2.3526 low
remains intact as the risk parameter this market needs to fail below to break
the month-and-a-half uptrend. From an
intermediate-to-longer-term perspective, this week's setback falls well within
the bounds of another correction ahead of further gains. This is another
excellent example of the importance of technical and trading SCALE and
understanding and matching directional risk exposure to one's personal risk
profile.
The
reason overnight's admittedly minor mo failure might have longer-term
importance is the 2.8172-area from which it stemmed. In
Fri's Technical Blog we also noted the market's engagement of the
2.8076-to-2.8159-area marked by the 61.8% retrace of Jun0-Sewp's 3.2758 -2.1877
decline and the 1.000 progression of Sep-Oct's initial 2.1877 - 2.6185
(suspected a-Wave) rally from 18-Oct's 2.3526 (suspected b-Wave) low. We
remind longer-term players that because of the unique and compelling confluence
of:
early-Aug's bearish divergence in WEEKLY momentum
amidst
historically
extreme bullish sentiment/contrary opinion levels in our RJO Bullish
Sentiment Index
an
arguably complete and massive 5-wave Elliott sequence from Mar'20's 0.4605
low to Jun's 4.3260 high (as labeled in the weekly log active-continuation
chart below) and
the
5-wave impulsive sub-division of Jun-Sep's (suspected initial 1st-Wave) decline
The
recovery attempt from 26-Sep's 2.1877 low is arguably only a 3-wave (Wave-2)
corrective rebuttal to Jun-Sep's decline within a massive, multi-quarter
PEAK/reversal process. Now granted, due to the magnitude of 2020 -2022's
secular bull market, we discussed the prospect for this (2nd-Wave corrective)
recovery to be "extensive" in terms of both price and time. A
"more extensive" correction is typified by a retracement of 61.8% or
more and spanning weeks or even months following a 3-month decline. Per
such, the (suspected corrective) recovery from 26-Sep's 2.1877 low could easily
have further to go, with commensurately larger-degree weakness than that
exhibited this week (i.e., a failure below at least 2.4822) required
to consider the correction complete. Indeed, the daily log chart above
shows the market thus far respecting former 2.6185-area resistance from 10-Oct
as a new support candidate.
These
issues considered, very shorter-term traders have been advised to move to a neutral/sideline
position following overnight's momentum failure below 2.6328, with a recovery
above 2.8172 required to negate this call, reaffirm the recovery and re-expose
potentially significant gains thereafter. For intermediate- and
longer-term players, a bullish policy and exposure remain advised with a
failure below 2.4822 required to threaten this call enough to warrant
neutralizing exposure. We will be watchful for another bearish divergence
in momentum following a recovery attempt that falls short of Fri's 2.8172 high
that would be considered the next reinforcing factor to a count calling that
2.8172 high the prospective end to the month-and-a-half 2nd-Wave
correction. In lieu of such, a resumption of the current rally to
eventual new highs above 2.8172 should not surprise.
By: John Caruso, Senior Market StrategistPosted Oct 23, 2020 8:48AM CT
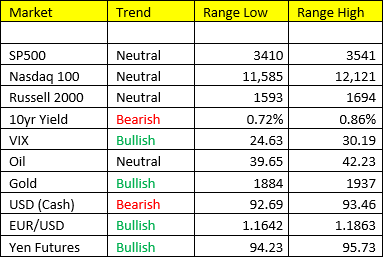
Europe comes into the session higher, but risks of a double dip recession have risen as their Purchasing Managers Index (PMIs) contract under the 50.0 mark to 49.4. Less than 50 signals contraction. A second wave of infections, rolling shutdowns, and hold-over scarring from March and April continue to crunch the Euro Zone economy. Bottom line, Christine Lagarde and the ECB are likely to begin to signal additional stimulus measures at next weeks ECB meeting – we’ll keep our ear to the ground as that meeting draws closer next week. EUR/USD +0.29% this morning.
Oil: since making the pivot back to Scen 3, Growth Slowing /Inflation Accelerating we’ve continued to see the broader commodity complex reflate. The last participating member, and a typical top LONG position in a stagflation environment is Energy. Nat Gas has lived up to its end of the bargain, however Crude Oil, RBOB, and Heating Oil have not. They may be changing soon. The quant indicators are suggesting higher in Oil, as momentum remains positive and structure is supportive. Oil moved to bullish “trade” yesterday (still neutral “trend”). Perhaps there’s a piece of news floating out there to give this market the catalyst it needs to springboard higher. Yesterday’s move in Spdr etf XOP (SP Oil & Gas Expl/Production) may have laid the initial ground work for a rally to follow.
Treasuries: Bond yields are moving, however now signaling immediate overbought at 86bps. This is the part of the Full Investing Cycle where things that have worked consistently for the past 2yrs (we went bullish on treasuries Q4 of 2018) start to underperform. Sort of like our pivot in the Russell 2000 this week, we’ve pivoted in treasuries last week as well, despite Bonds being listed as overweight in Scen 3 in our model. Embrace the non-linearity of this game. Yes we bought Russell and yes we shorted treasuries, and I could certainly flip that position again simply for a trade. Remember, the bond market was nationalized back in March/April. The Fed could easily step at any moment and announce more Treasury purchases.
Question: We’re dancing on a razors edge still in terms of probability risk of Scen 3 vs 4 in Q4 2020 (in favor of Scenario 3). But honestly the biggest question I’m asking myself is when do we flip to Scenario 2 and away from Scenario 3 – well we may be seeing the beginning stages of that trade now as Treasury yield reflate (albeit modestly) and Small cap stocks gather steam higher. We need more time and space to make that call, and certainly wouldn’t mind getting past Nov 3rd. You have to remember, Q1 and Q2 of 2021 will be comparing against the Covid-19 Pandemic data – its assured we will be accelerating in all areas of data on year over year comparison. Steering out of a market squall of the likes we’ve never seen before can be a challenge, but we’re welcoming the challenge.
Good Luck, all the best
If you have any questions or would like to discuss the markets further, please feel free to contact me at 800-669-5354 or jcaruso@rjofutures.com.