Energy is something that has been traded and used since the dawn of man and is continually used by billions around the world today. We have assembled this kit with goal of informing you how to make money off these precious commodities. The Energy Investor Kit is complete with detailed fundamental and technical analysis on the energy sector and will teach you how to navigate these ever important and potentially lucrative markets.
RJO Futures PRO Trading Platform
FREE 100k Simulated Trading Account
Experience a trading platform like no other with integrated tools to seamlessly trade and monitor the markets. With a free simulated trading account and personal broker experience, we’ll teach you about futures trading and help you develop a trading strategy.
The Markets
Metals - Gold Locked and Loaded
Gold Locked and Loaded
By: Joshua GravesPosted 11/06/2020
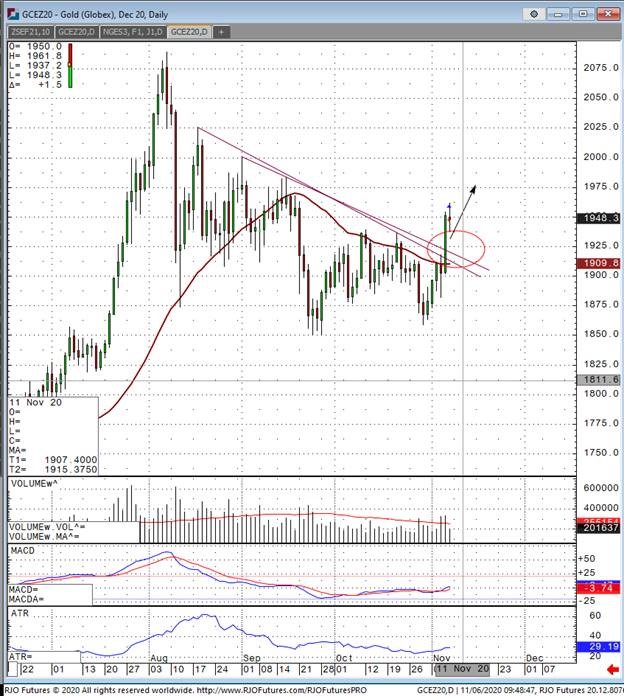
December gold futures have cracked the most important trend line in recent months, as gold is now set to make new highs and once again climb back above the all too important $2000 level. My most recent write up on gold basically stated that unless that trend was broken, and a close was above roughly $1925 or above (breaking the trend line lower) that we would likely see a push higher from that point on. I think the technical aspect for a bullish bet on gold now seems to make sense. Fundamentally, everyone is going to have their own theory on metals often especially. The inflation aspect could very well be the biggest factor here as a Biden presidency might mean even more stimulus than the original bill was calling for. It appears that endless money printing by the fed is going to continue, and once again keep the bullish case longer term for gold alive and well. India and China have been buying quite a bit of gold in the spot market as of recent, and the gold and silver ETF inflows have been increased month over month week after week for quite some time and should continue to support the physical buying. Last but not least the USD index seems to be once again get shoved to the side and new lows are expected sooner than later. Yesterday the December USD index futures hit fresh recent lows and it appears that another close beneath the contract lows will come soon, boosting golds chances at a return to glory. Traders should consider a number of bullish bets but exercise caution as the volatility is nowhere near gone.
Gold Dec '20 Daily ChartMetals - Solid Week for Silver
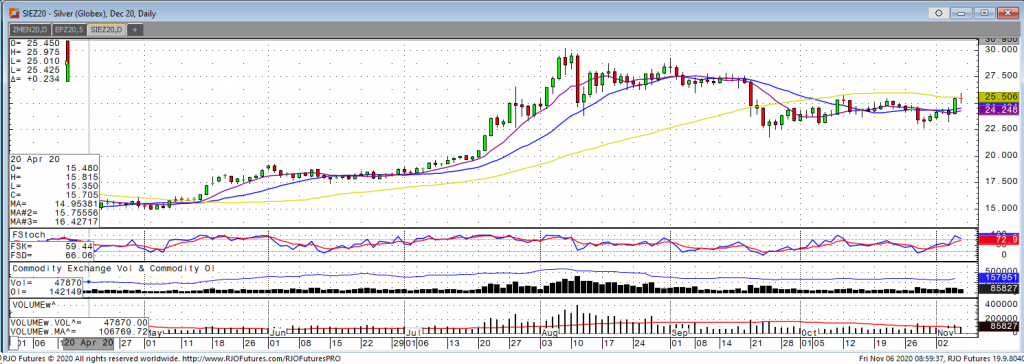
We have seen a positive week for Dec silver with a big up day on Thursday following a pullback on Wednesday. This week’s stock market gains and better than expected US economic data has provided the support needed for silver to rally. Although stocks have started today’s trading session red we have seen a rally of almost 7% this week and US non-farm payrolls came in at 638,000 vs an estimate of 600,000 with the US unemployment rate coming in at 6.9% vs an expected 7.7%. With the US dollar showing signs of continued pressure the silver market should hold this week’s move and look to continue a push to the upside. At this time it looks like Biden will become the next president, but the markets seem to be focusing more on the hopes of another stimulus package which is supportive for silver as well. To see the rally in silver continue we would need to see a continued move lower in the US dollar, a slowing of virus cases, and/or a stimulus package agreed upon. Dec silver traded up to a high of 25.975 today before pulling back some and to keep its momentum we would need to see a close above yesterday’s high of 25.54. Support comes in at 25.00 and the next resistance level is 27.50.
Silver Dec '20 Daily Chart If you have any questions or would like to discuss the markets further, please feel free to contact me at 800-826-2270 or therrmann@rjofutures.com. Energy - Oil Up Too Far, Too Fast
Oil Up Too Far, Too Fast
By: Alex Turro, Senior Market StrategistPosted Nov 6, 2020 9:41AM CT
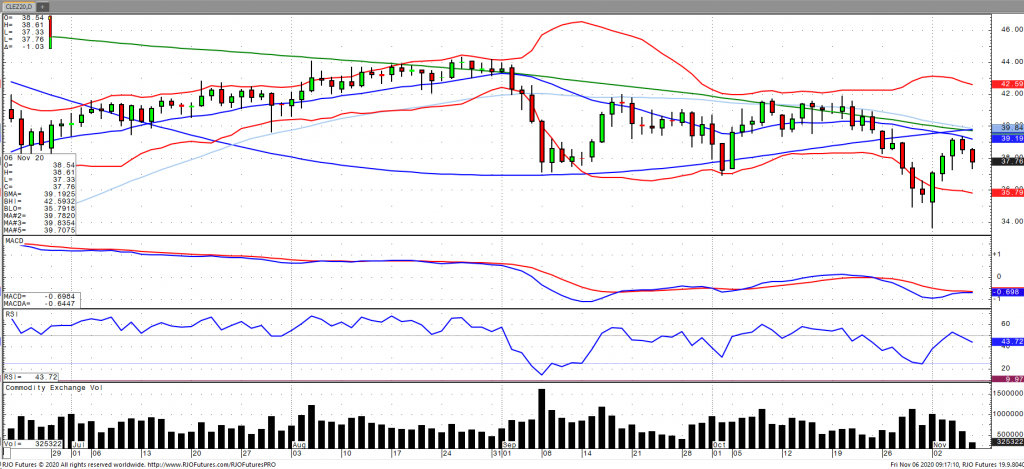
Oil prices are moving lower here in the early session on Friday as increased lockdowns and a surge in cases in Europe and the US have continued to weigh on global demand prospects with additional anxiety related to the drawn-out vote counting in the US election. OPEC+ are considering a differed increase in oil output in January as a ‘second’ wave would continue to add to the already fragile outlook in fuel demand. OPEC+ are set to ease output cuts by 2.2 million bpd in January from the current 7.7 million bpd. Both benchmarks extended gains earlier in the week after weekly US crude inventories fell sharply to a 30-week low, however, the draw was largely attributed to production shutdowns in the Gulf. Oil volatility (OVX) continues to remain elevated with the market remaining bearish trend with today’s range seen between 35.23 – 40.27.
Crude Oil Dec '20 Daily Chart If you have any questions or would like to discuss the markets further, please feel free to contact me at 800-438-4805 or aturro@rjofutures.com. Softs - Coffee Needs Bullish News
Coffee Needs Bullish News
By: Adam TuiaanaPosted 11/04/2020
With continued unrest in the US Elections, added
volatility has struck most all commodity prices, including that of December
coffee. While December coffee prices continue to trade mostly sideways, during
continued increases in Covid 19 cases, it seems clear that December coffee
prices have not received the required fundamental news need it to turn the
market to the upside.
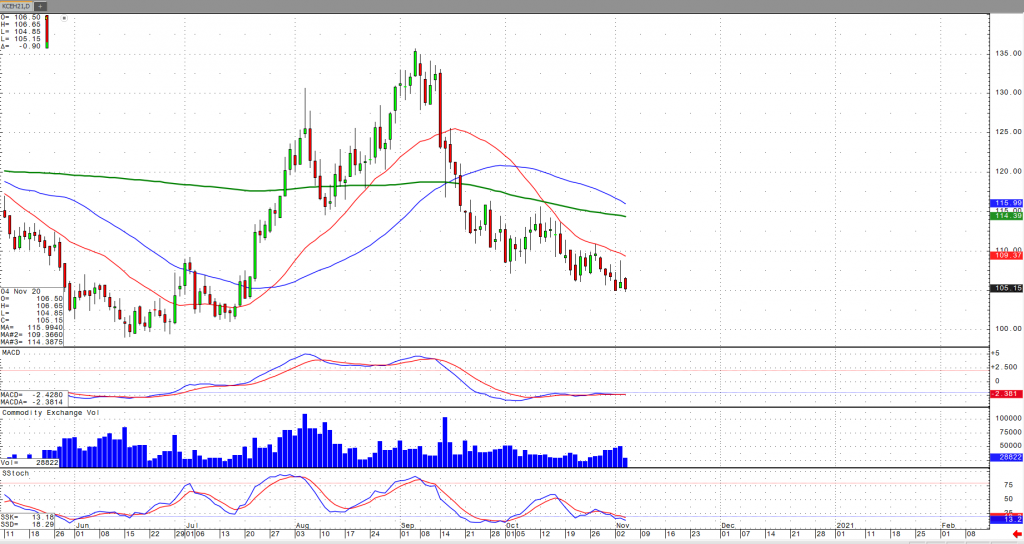
With the realistic potential of a new administration looming, the threat of potential new lockdown measures throughout the US has added some pressure to commodity prices. Although we’ve seen the US stock market has rally over the past 24 hours, likely due to a new administrations potential easing tariff measures against China, more bullish news in the way of coffee demand will be needed to lift coffee prices higher. From a technical perspective, December coffee prices continue to trade well below the 200-day MA (now resting at around the 114 level) which is continued neutral to bearish, and likely will see follow through selling to the key support area of 100.
On
the heels of mid-Sep-to-early-Oct's steeper, accelerated, 3rd-wave-looking
recovery, the past week-and-a-half's boringly lateral chop is first considered
a corrective/consolidative event that warns of a continuation of the uptrend
that preceded it to new highs above 04-Oct's 891.0 high. This count
remains consistent with our broader base/correction/recovery count introduced
in 13-Sep's Technical Blog following that
day's bullish divergence in short-term momentum above 07-Sep's 809.5 minor
corrective high detailed in the hourly chart below.
The
important takeaway from this month's lateral, sleepy price action is the
definition of Wed's 851.5 low as
the end or lower boundary of a suspected 4th-Wave correction. A failure
below 851.5 will confirm a bearish divergence in daily momentum and defer or
threaten a bullish count enough to warrant non-bullish decisions like
long-covers. A failure below 851.5 will not
necessarily negate a broader bullish count, but it will threaten it enough to
warrant defensive measures as the next pertinent technical levels below 851.5 are
13-Sep's prospective minor 1st-Wave high at 813.8 and obviously 08-Sep's 766.0
low. And making non-bullish decisions "down there" is
sub-optimal to say the least. Per such, both short- and longer-term
commercial traders are advised to pare or neutralize bullish exposure on a
failure below 851.5, acknowledging and accepting whipsaw risk- back above 04-Oct's
891.0 high- in exchange for much deeper and sub-optimal nominal risk below
766.0.
On
a broader scale, the daily log scale chart above shows the developing potential
for a bearish divergence in daily momentum that will be considered confirmed
below 851.5. This chart also shows the past month's recovery thus far
stalling in the immediate neighborhood of the (888.0) Fibonacci
minimum 38.2% retrace of Apr-Sep's entire 1128 - 766 decline). COMBINED
with a failure below 851.5, traders
would then need to be concerned with at least a larger-degree correction pf the
past month's rally and possibly a resumption of Apr-Sep's major downtrend.
Until
and unless the market fails below 851.5 however, we would
remind longer-term players of the key elements on which our bullish count is
predicated:
a confirmed bullish divergence in WEEKLY momentum
(below)
amidst
an
historically low 11% reading in out RJO Bullish Sentiment Index and
a
textbook complete and major 5-wave Elliott sequence down from 29-Apr's
1128 high to 08-Sep's 766.0 low.
Thus
far, the market is only a month into correcting a 4-MONTH, 32% drawdown, so
further and possibly protracted gains remain well within the bounds of a major
(suspected 2nd-Wave) correction of Apr-Sep's decline within an even more
massive PEAK/reversal process from 17-May's 1219 high on an active continuation
basis below.
These
issues considered, a bullish policy and exposure remain advised with a failure
below 851.5 required to defer or threaten this call enough to warrant moving to
a neutral/sideline position. In lieu of such weakness, we anticipate a
continuation of the past month's rally to new highs and potentially significant
gains above 891.0.
Agricultural - Grain Futures Update w/Stephen Davis - 11/06/2020
Grain Futures Update w/Stephen Davis - 11/06/2020
By: Stephen DavisPosted 11/06/2020
RJO Futures Senior Market Strategist, Stephen Davis discusses the grain futures market and the action ahead of next week's crops reportCurrency - Futures Market Outlook - 11/06/2020
Futures Market Outlook - 11/06/2020
By: John Caruso, Senior Market StrategistPosted Nov 6, 2020 8:49AM CT
Chasing blue waves, red waves, and other nonsense…..
Well, our Implied volatility signals wound up being correct – ahead of the election Tuesday, we saw MASSIVE implied Volatility PREMIUMS in the stock indices. For those that have been following for a while now, know that when you see IV Premiums, it’s a strong indicator that suggests investors/Wall Street was heavily hedged for the downside. If we know anything about markets, it that they tend to please the least amount of investors. We saw a strong move lower in stocks last week, only to see a massive reversal back higher with the ATHs back within reach. On the other side of that, the Bond market has been showing a massive short position being built in over the past month, typically another counter indicator (at least in the short-term), Bonds made one of their largest percentage moves EVER inside of a day on Tuesday night. Now what are we looking for moving forward? We’ll wait and watch to see if the IV Premiums sweat off (they already are), and turn into DISCOUNTS which is a classic complacency signal, usually coupled with an immediate overbought condition.
Commodities:
Nearly the entire complex is signaling immediate-term overbought. Grains, including Soybeans, Corn, Wheat are all trading at the top end of the range, and we expect buying opportunities will present themselves from better prices. Our Natural Gas position, unfortunately has been front running this OB condition in equities, we’ll address this later – but NG immediately oversold right now (again).
3 Key Markets to Watch:
Gold/Silver- big upgrades in the charts following yesterdays break-out. Platinum prices are also beginning to join in, following there immediate oversold levels last Friday.
Oil- signaled immediate-overbought yesterday, but we’re looking for signs of a bottoming process here. Oil has been certainly the lagging commodity since we went bullish on Commodities back in June.
US Dollar- pounded to the low end of our range, and now immediate oversold. You could easily see a correction in commodity assets in the next coming week or 2 just based off of the immediate-term oversold status of the Dollar. This is important to watch.
If you have any questions or would like to discuss the markets further, please feel free to contact me at 800-669-5354 or jcaruso@rjofutures.com. Currency - Could See a Key Reversal in USD Today
Could See a Key Reversal in USD Today
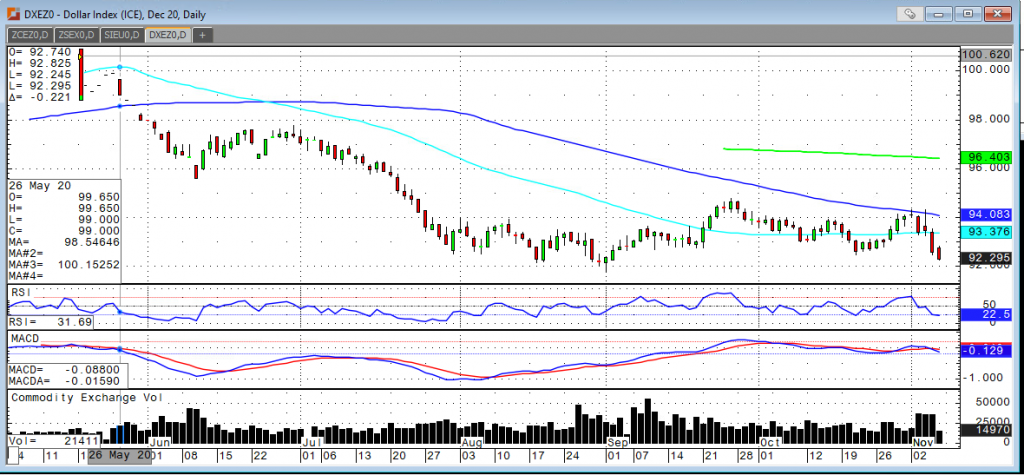
By: Tony Cholly, Senior Market StrategistPosted Nov 6, 2020 8:44AM CT
Despite ongoing bad data and the potential for a
disappointing US monthly non-farm payroll report later today, the dollar broke
out to the lowest level since early September earlier today. We suggest that
position traders prepare to buy the USD after further weakness this morning, as
an extension of record infection counts into next week seems to be likely to
spark a series of lockdowns. These lockdowns should rekindle macro economic
slowing safe haven buying.
Technically speaking, the close under the 60-day MA indicates the longer term tend could be turning downward. The daily stochastics have crossed over down which is also a bearish indicator. Momentum studies trending lower at mid-range should accelerate a move lower if support levels are taken out. The market back below the 18-day MA suggests the intermediate term trend could also be turning down. Resistance comes in at 9310 and 9386 while support is at 9204.
USD Dec '20 Daily Chart If you have any questions or would like to discuss the markets further, please feel free to contact me at 800-826-2270 or tcholly@rjofutures.com. Interest Rates - Interest Rates Trading High as We Await Election Results
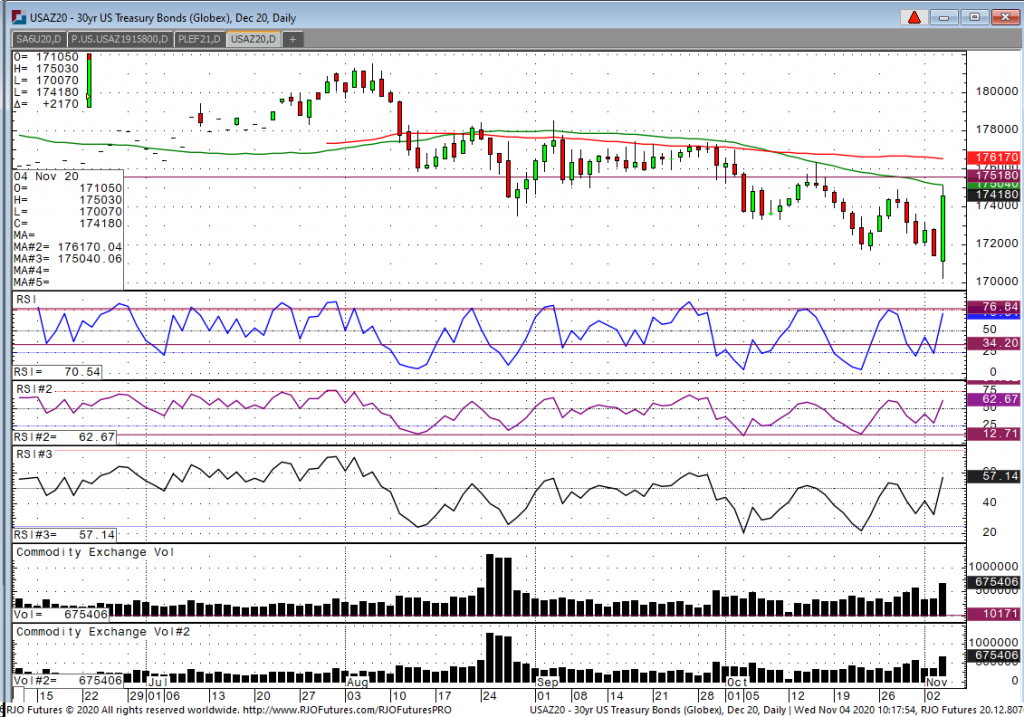
Interest Rates Trading High as We Await Election Results
As of this writing, the December 10-year is trading sharply higher, currently 138-26 and had a range overnight if 137-205 to 139-01. As Globex opened last night, we saw the price plummet right out of the gate on early indications that Biden was ahead, albeit was just as many polls were closing. Traders sold the note because as Biden was leading early, traders view that a Biden stimulus package is going to be significantly larger than Trump’s, hence adding to more money in the people’s hand which will lead to more of the inflation trade. As soon as Mitch McConnel was announced as the winner of the Senate race in Kentucky, we saw the note shoot up as investors immediately sensed gridlock as the republicans retained control of the senate and the note market has continued to be very strong still with the yield on the 10 year at .778 after reaching a high .945 early last night. Currently, we still do not know who won as some key states have not finished counting all ballots. Trump did have a news conference late last night and gave people the hint that he is ready, waiting in the wings to contest the election if Biden does eventually win. If that does happen, the market hates uncertainty and I would expect the note complex to continue to have a bid as long as a winner is not declared.
30yr Note Dec '20 Daily Chart If you have any questions or would like to discuss the markets further, please feel free to contact me at 800-826-2270 or gperlin@rjofutures.com. Equity - Stocks Lower in the Early Going
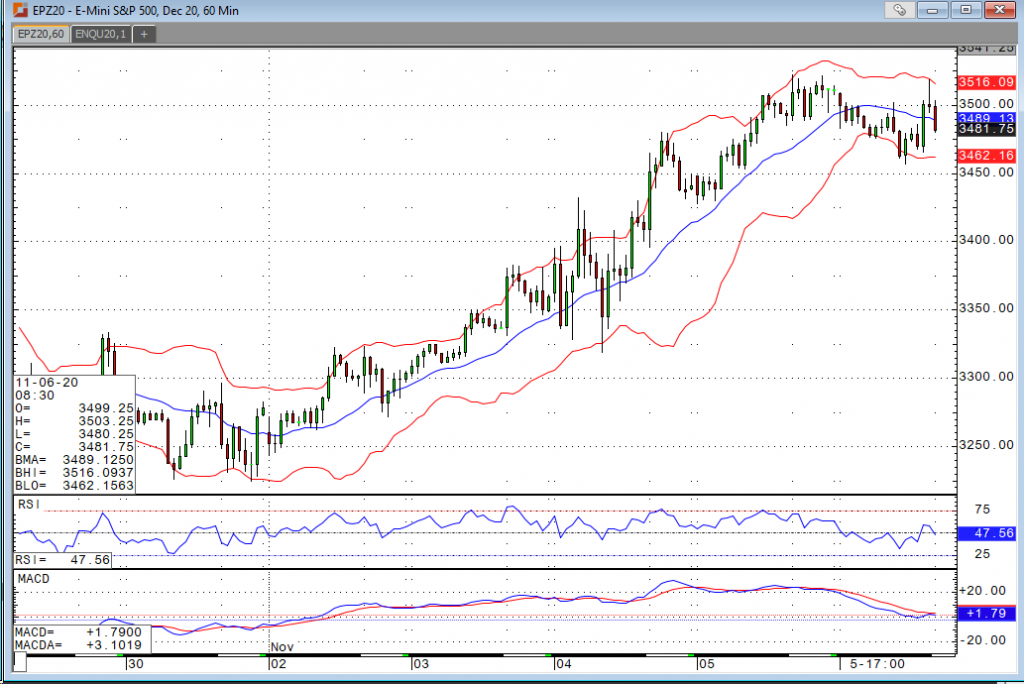
Stocks Lower in the Early Going
By: Bill Dixon, Senior Market StrategistPosted Nov 6, 2020 9:11AM CT
Despite all the election uncertainty, stocks have been on an impressive run. President Trump’s odds for a victory seem to be diminishing by the minute, but we’ll see how long this takes to play out in the courts. It does appear that the GOP will hold the senate and the market seems to be happy with the idea of that. Stocks were lower overnight, but the non-farm payroll data boosted the markets at least temporarily. The labor market added 638,000 jobs (575,000 consensus), and the unemployment rate came in at 6.9% (7.7% consensus). The rally was short-lived, and we’re well into negative territory to kick things off today. We’re overbought technically, and I can’t blame investors for wanting to book some profits ahead of the weekend. The trend is strong to the upside, we’ve seen nice rallies into the end of year holidays in the recent past, so now the question is how low will we be able to get back in?.
E-mini S&P 500 Dec '20 60-Min Chart If you have any questions or would like to discuss the markets further, please feel free to contact me at 800-669-5354 or bdixon@rjofutures.com. Economy - S-T Mo Failure Insufficient to End RBOB Correction, But Beware
S-T Mo Failure Insufficient to End RBOB Correction, But Beware
By: RJO Market InsightsPosted 11/08/2022
Posted on Nov 08, 2022, 07:51 by Dave Toth
In Fri's Technical Webcast we identified a
minor corrective low at 2.6328 from Thur as a mini risk parameter the market
needed to sustain gains above to maintain a more immediate bullish count.
The 240-min chart below shows the market's failure overnight below this level,
confirming a bearish divergence in very short-term momentum. This mo
failure defines Fri's 2.8172 high as
one of developing importance and a parameter from which very short-term traders
can objectively base non-bullish decisions like long-covers.
Given
the magnitude of the past three weeks' broader recovery however, this
short-term momentum failure is of an insufficient scale to conclude anything
more than another correction within this broader recovery from 26-Sep's 2.1877
low. Indeed, overnights failure below 2.6328 only allows us to conclude
the end of the portion of the month-and-a-half rally from 31-Oct's 2.4822 next
larger-degree corrective low. 2.4822 is the
risk parameter this market still needs to fail below to break the uptrend from
18-Oct's 2.3526 low while this 2.3526 low
remains intact as the risk parameter this market needs to fail below to break
the month-and-a-half uptrend. From an
intermediate-to-longer-term perspective, this week's setback falls well within
the bounds of another correction ahead of further gains. This is another
excellent example of the importance of technical and trading SCALE and
understanding and matching directional risk exposure to one's personal risk
profile.
The
reason overnight's admittedly minor mo failure might have longer-term
importance is the 2.8172-area from which it stemmed. In
Fri's Technical Blog we also noted the market's engagement of the
2.8076-to-2.8159-area marked by the 61.8% retrace of Jun0-Sewp's 3.2758 -2.1877
decline and the 1.000 progression of Sep-Oct's initial 2.1877 - 2.6185
(suspected a-Wave) rally from 18-Oct's 2.3526 (suspected b-Wave) low. We
remind longer-term players that because of the unique and compelling confluence
of:
early-Aug's bearish divergence in WEEKLY momentum
amidst
historically
extreme bullish sentiment/contrary opinion levels in our RJO Bullish
Sentiment Index
an
arguably complete and massive 5-wave Elliott sequence from Mar'20's 0.4605
low to Jun's 4.3260 high (as labeled in the weekly log active-continuation
chart below) and
the
5-wave impulsive sub-division of Jun-Sep's (suspected initial 1st-Wave) decline
The
recovery attempt from 26-Sep's 2.1877 low is arguably only a 3-wave (Wave-2)
corrective rebuttal to Jun-Sep's decline within a massive, multi-quarter
PEAK/reversal process. Now granted, due to the magnitude of 2020 -2022's
secular bull market, we discussed the prospect for this (2nd-Wave corrective)
recovery to be "extensive" in terms of both price and time. A
"more extensive" correction is typified by a retracement of 61.8% or
more and spanning weeks or even months following a 3-month decline. Per
such, the (suspected corrective) recovery from 26-Sep's 2.1877 low could easily
have further to go, with commensurately larger-degree weakness than that
exhibited this week (i.e., a failure below at least 2.4822) required
to consider the correction complete. Indeed, the daily log chart above
shows the market thus far respecting former 2.6185-area resistance from 10-Oct
as a new support candidate.
These
issues considered, very shorter-term traders have been advised to move to a neutral/sideline
position following overnight's momentum failure below 2.6328, with a recovery
above 2.8172 required to negate this call, reaffirm the recovery and re-expose
potentially significant gains thereafter. For intermediate- and
longer-term players, a bullish policy and exposure remain advised with a
failure below 2.4822 required to threaten this call enough to warrant
neutralizing exposure. We will be watchful for another bearish divergence
in momentum following a recovery attempt that falls short of Fri's 2.8172 high
that would be considered the next reinforcing factor to a count calling that
2.8172 high the prospective end to the month-and-a-half 2nd-Wave
correction. In lieu of such, a resumption of the current rally to
eventual new highs above 2.8172 should not surprise.