Energy is something that has been traded and used since the dawn of man and is continually used by billions around the world today. We have assembled this kit with goal of informing you how to make money off these precious commodities. The Energy Investor Kit is complete with detailed fundamental and technical analysis on the energy sector and will teach you how to navigate these ever important and potentially lucrative markets.
RJO Futures PRO Trading Platform
FREE 100k Simulated Trading Account
Experience a trading platform like no other with integrated tools to seamlessly trade and monitor the markets. With a free simulated trading account and personal broker experience, we’ll teach you about futures trading and help you develop a trading strategy.
The Markets
Metals - Gold Futures Under Pressure
Gold Futures Under Pressure
By: Frank J. Cholly, Senior Market StrategistPosted Nov 20, 2020 9:13AM CT
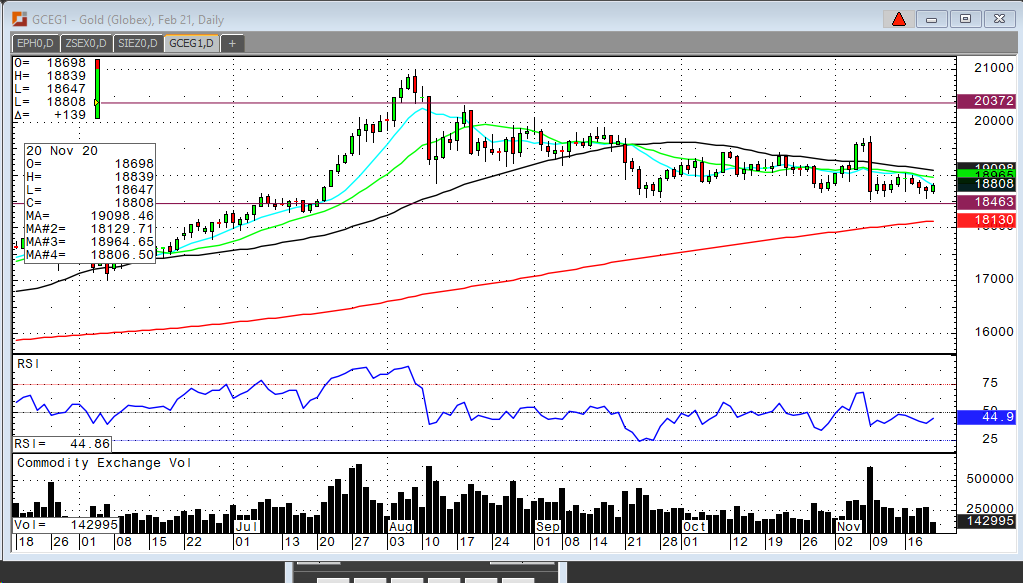
While the $1,850 support level in gold continues to hold, I am beginning to question whether that support level on the chart is enough. Gold futures are going to need some fundamental support. The vaccine announcement was the “stake in the heart” for gold. It doesn’t seem likely that additional stimulus is on its way. Afterall, we haven’t yet used all the stimulus funds from previous packages. The US Dollar still looks vulnerable to me and perhaps a little supportive to gold for the time being. Gold is going to have to see new contract lows in the dollar to recover from the vaccine sell off.
I’m still long-term bullish gold and believe that new contract highs are like first quarter 2021. However, it looks like it’s also very likely that we need to see a test of the $1,800 level before moving back above $1,900. There’s just more negative fundamentals in play right now and $1,850 is going to be taken out if it’s tested too many times. At the time of this writing gold is trading $1,875. Gold is finding some support in the raising number of COVID cases and additional lockdowns. Also, as mentioned, the Dollar doesn’t seem able to bounce. Maybe $1850 is the low, but I doubt it. Look for $1,820 to $1,805.
Gold Feb '21 Daily Chart If you have any questions or would like to discuss the markets further, please feel free to contact me at 800-826-4124 or fcholly@rjofutures.com. Energy - Oil Set for Third Consecutive Weekly Gain
Oil Set for Third Consecutive Weekly Gain
By: Alex Turro, Senior Market StrategistPosted Nov 20, 2020 9:44AM CT
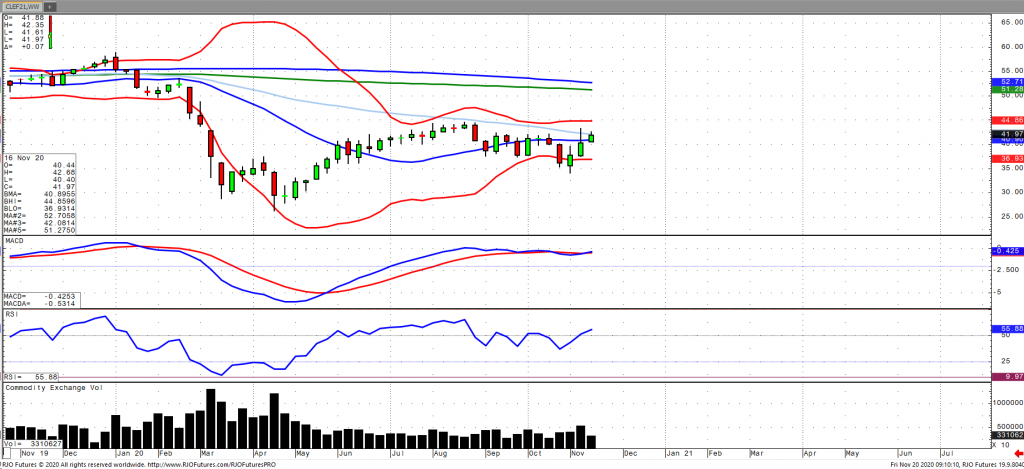
Oil prices have remained firm early Friday as the market is set for a third consecutive weekly gain as vaccine news continue to buoy prices despite the ongoing demand concerns. This has been coupled with OPEC+ expecting to delay production increases by three months lowering their cuts from 7.7 million bpd by about 2 million bpd with a meeting scheduled for Nov. 30th and Dec. 1st. Weekly inventories reported a slight build, however, the US operating rate increased by nearly 2%, suggesting an uptick in domestic demand for physical crude supplies. This in part may have offset by reports of residual demand from China as weekly stockpiles have fallen 5 out of the last 7 weeks. Regarding supply, Libya continues to increase production now raising to pre-blockade levels of 1.25 million bpd. The market continues to remain bullish trend with today’s range seen between 39.71 – 42.65.
Crude Oil Jan '21 Daily Chart If you have any questions or would like to discuss the markets further, please feel free to contact me at 800-438-4805 or aturro@rjofutures.com. Softs - Coffee Gets Bullish News
Coffee Gets Bullish News
By: Adam TuiaanaPosted 11/18/2020
A couple key factors have played a major role in
the recent breakout of March Coffee futures. At the center of the radar is the
flurry of two hurricanes, Eta earlier this month, did substantial damage to key
growing areas of Central America and Mexico, producing flash flooding and
mudslides. Shortly after, hurricane Iota was on the way, but has since been
downgraded from hurricane to tropical storm. Regardless, the extremely wet
weather will result in delays in harvesting and increase crop damage
on-the-whole, prompting solid support to March coffee prices.
In addition to the bullish fundamentals of weather,
Pfizer and Moderna’s recent announcement of 94-95% effective vaccines for Covid
19 has sparked a bit more confidence that life as we “knew it” will return in
time. Although several factors will continue to play a role in how effective
the vaccine and distribution of the vaccine will be, on-the-whole, the news is
positive for the future of coffee shops and restaurants.
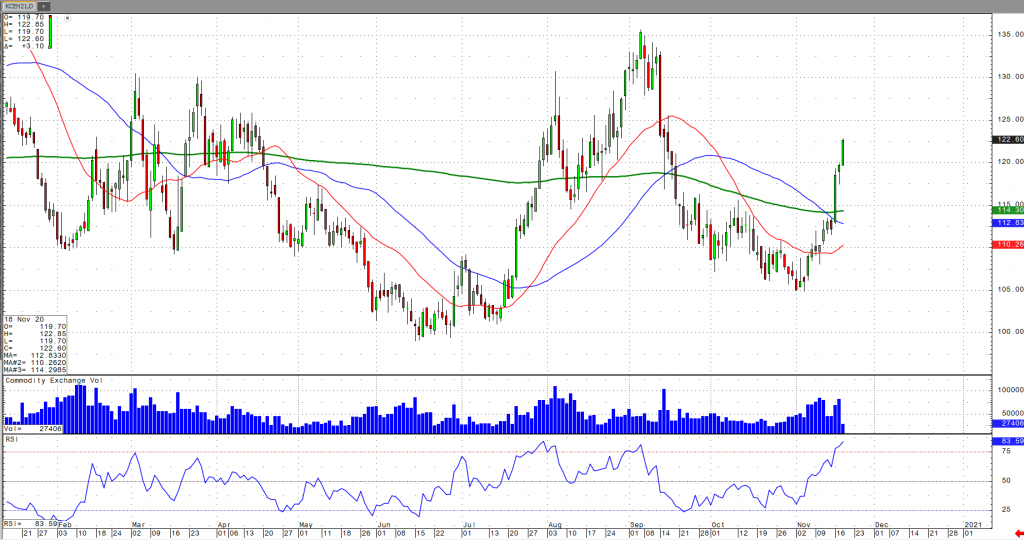
From a technical perspective, the aggressive
bullish crossover of the price action through the 200-day MA has been followed
by even more volatile buying. Both RSI and Momentum levels have increased with
no bearish diversion from the price action. There are several
strategies that traders can apply in this situation.
On
the heels of mid-Sep-to-early-Oct's steeper, accelerated, 3rd-wave-looking
recovery, the past week-and-a-half's boringly lateral chop is first considered
a corrective/consolidative event that warns of a continuation of the uptrend
that preceded it to new highs above 04-Oct's 891.0 high. This count
remains consistent with our broader base/correction/recovery count introduced
in 13-Sep's Technical Blog following that
day's bullish divergence in short-term momentum above 07-Sep's 809.5 minor
corrective high detailed in the hourly chart below.
The
important takeaway from this month's lateral, sleepy price action is the
definition of Wed's 851.5 low as
the end or lower boundary of a suspected 4th-Wave correction. A failure
below 851.5 will confirm a bearish divergence in daily momentum and defer or
threaten a bullish count enough to warrant non-bullish decisions like
long-covers. A failure below 851.5 will not
necessarily negate a broader bullish count, but it will threaten it enough to
warrant defensive measures as the next pertinent technical levels below 851.5 are
13-Sep's prospective minor 1st-Wave high at 813.8 and obviously 08-Sep's 766.0
low. And making non-bullish decisions "down there" is
sub-optimal to say the least. Per such, both short- and longer-term
commercial traders are advised to pare or neutralize bullish exposure on a
failure below 851.5, acknowledging and accepting whipsaw risk- back above 04-Oct's
891.0 high- in exchange for much deeper and sub-optimal nominal risk below
766.0.
On
a broader scale, the daily log scale chart above shows the developing potential
for a bearish divergence in daily momentum that will be considered confirmed
below 851.5. This chart also shows the past month's recovery thus far
stalling in the immediate neighborhood of the (888.0) Fibonacci
minimum 38.2% retrace of Apr-Sep's entire 1128 - 766 decline). COMBINED
with a failure below 851.5, traders
would then need to be concerned with at least a larger-degree correction pf the
past month's rally and possibly a resumption of Apr-Sep's major downtrend.
Until
and unless the market fails below 851.5 however, we would
remind longer-term players of the key elements on which our bullish count is
predicated:
a confirmed bullish divergence in WEEKLY momentum
(below)
amidst
an
historically low 11% reading in out RJO Bullish Sentiment Index and
a
textbook complete and major 5-wave Elliott sequence down from 29-Apr's
1128 high to 08-Sep's 766.0 low.
Thus
far, the market is only a month into correcting a 4-MONTH, 32% drawdown, so
further and possibly protracted gains remain well within the bounds of a major
(suspected 2nd-Wave) correction of Apr-Sep's decline within an even more
massive PEAK/reversal process from 17-May's 1219 high on an active continuation
basis below.
These
issues considered, a bullish policy and exposure remain advised with a failure
below 851.5 required to defer or threaten this call enough to warrant moving to
a neutral/sideline position. In lieu of such weakness, we anticipate a
continuation of the past month's rally to new highs and potentially significant
gains above 891.0.
Agricultural - Grain Futures Update w/Stephen Davis - 11/20/2020
Grain Futures Update w/Stephen Davis - 11/20/2020
By: Stephen DavisPosted 11/20/2020
Stephen Davis discusses the grain futures market amid continued uncertainty surrounding Covid-19 lockdowns.Currency - Resistance in USD Could Thicken
Resistance in USD Could Thicken
By: Tony Cholly, Senior Market StrategistPosted Nov 20, 2020 9:10AM CT
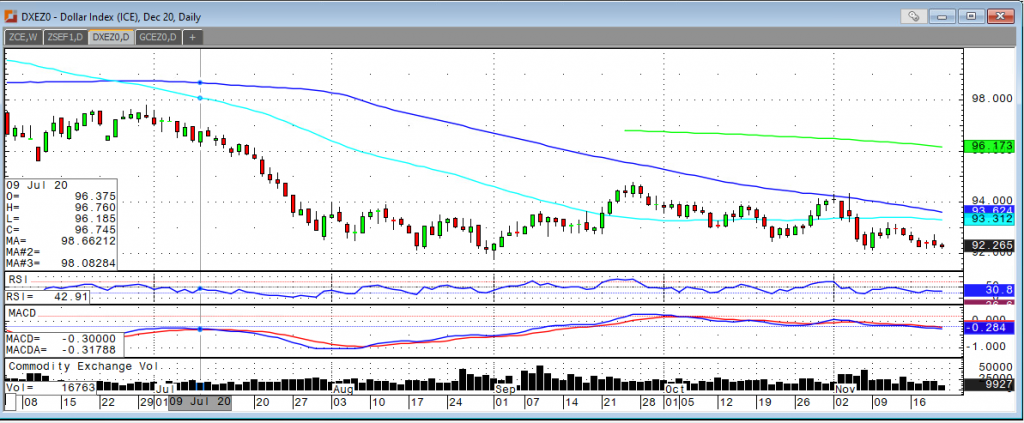
Seeing the USD index fail to rally on the US treasury claw back of stimulus funds from Federal Reserve highlights a lack of flight to quality sensitivity in the USD. However, it is possible that a portion of the trade thinks the treasury has plans to utilize the funds quicker than the treasury by some form of executive order. On the other hand, the other side of the political aisle sees the pullback as a move designed to rob the US economy of economic assistance for the next administration. Just as equity markets continue to look through the US infection surge, it seems that the currency markets have same capacity and that could thicken the resistance that comes in today at 9245. The next level of resistance would be 9280 with support coming in at 9200 and 9185.
USD Dec '20 Daily Chart If you have any questions or would like to discuss the markets further, please feel free to contact me at 800-826-2270 or tcholly@rjofutures.com. Interest Rates - Interest Rates Responding Well to Covid-19 Induced Shutdowns
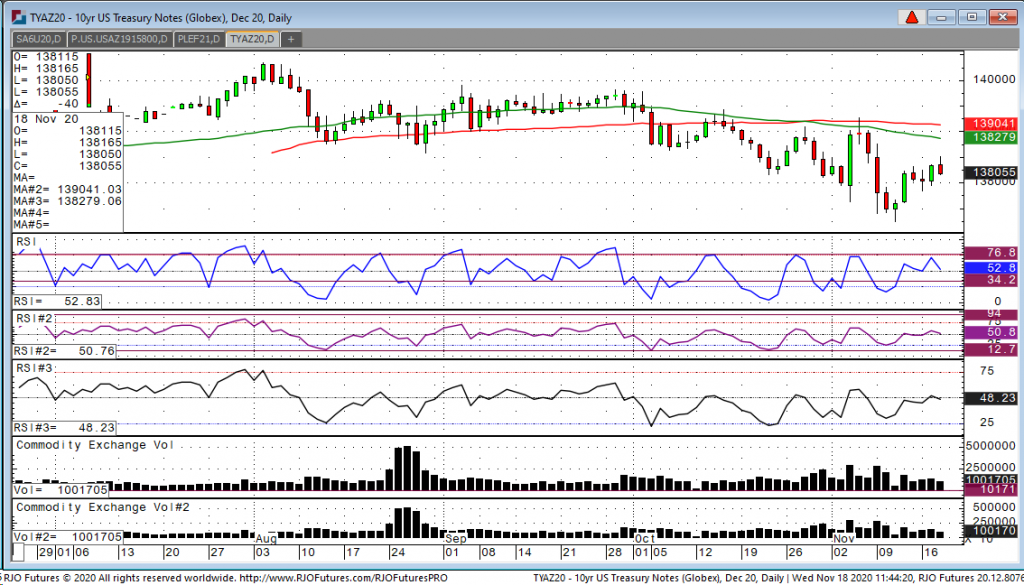
Interest Rates Responding Well to Covid-19 Induced Shutdowns
Looking at the December 10-year note, we had a high
overnight at 138-16.5 and a low of 138-06 and we’re currently trading at
138-07. The note has been acting well with ongoing shutdowns across the US due
to the ongoing and relenting spread of the virus. The good news is for everyone
is that a vaccine is coming shortly but with that news, brings up the question
on a few important items. How fast can
it be distributed? How do we store it to keep it fresh? I have heard it can only be stored in -50
degrees and many hospitals around the country lack the ability to store it. So,
it will be interesting how quickly they adapt to what they need to keep the
vaccine safe. Another important thing that many are not talking about is how
many people are going to take it once distributed. I think a fear some have is
that it was rushed and are skeptical to take it because of the unknown. IE,
side effects.
Technically the 10-year note has good support at 137-28 and more down at 137-21. On the upside I see resistance at 138-1655 todays high and more at 138-24-25 level.
10-Year Note Dec '20 Daily Chart If you have any questions or would like to discuss the markets further, please feel free to contact me at 800-826-2270 or gperlin@rjofutures.com. Equity - Stocks Remain Afloat Amid Lockdown Uncertainty
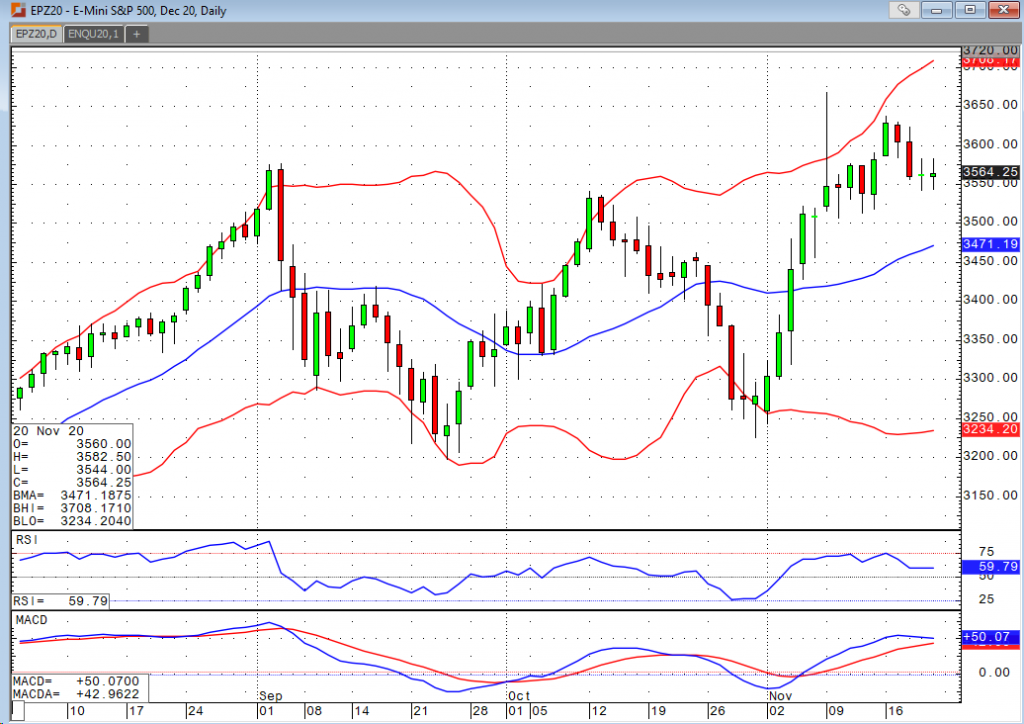
Stocks Remain Afloat Amid Lockdown Uncertainty
By: Bill Dixon, Senior Market StrategistPosted Nov 20, 2020 9:40AM CT
Throughout the United
States and Europe, lockdowns are turning from a conversation to a reality. We know the toll that such actions took on
the market last time, but we’re considerably more well informed about the virus
than we were several months ago. Cases
are surging again, and while some will suggest that is largely a function of
increases testing, it is hard to view that as a positive. Lockdowns are at the very least, unlikely to
help the recovery we’ve seen from the March lows, but we’re also nearing the
finish line on multiple vaccines. When
you factor in that we’re unlikely to see any form of additional stimulus for
the next couple months, one can only be impressed by how well the market has
maintained these trading levels.
The Dow, S&P, and Nasdaq continue to trade near the top end of their recent ranges dating back to early September. The Russell lagged the others on the way up (and was often the first to show signs of weakness on downturns), but it arguably has the strongest technicals of the bunch. All four indices are slightly lower this morning, but that’s not all that surprising given some of the risk factors on the fundamental front. We’re also headed into a holiday week, so some investors may just want to take their profits off the table and enjoy their time off. We’ve ramped up into the close three of the four days this week, so clearly the dip buyers are still out there. Considering how many people seem to be interested in buying lower, and the market’s tendency to please the least amount of investors, I believe we’re likely to remain relatively elevated in the near future.
E-mini S&P 500 Dec '20 Daily Chart If you have any questions or would like to discuss the markets further, please feel free to contact me at 800-669-5354 or bdixon@rjofutures.com. Economy - S-T Mo Failure Insufficient to End RBOB Correction, But Beware
S-T Mo Failure Insufficient to End RBOB Correction, But Beware
By: RJO Market InsightsPosted 11/08/2022
Posted on Nov 08, 2022, 07:51 by Dave Toth
In Fri's Technical Webcast we identified a
minor corrective low at 2.6328 from Thur as a mini risk parameter the market
needed to sustain gains above to maintain a more immediate bullish count.
The 240-min chart below shows the market's failure overnight below this level,
confirming a bearish divergence in very short-term momentum. This mo
failure defines Fri's 2.8172 high as
one of developing importance and a parameter from which very short-term traders
can objectively base non-bullish decisions like long-covers.
Given
the magnitude of the past three weeks' broader recovery however, this
short-term momentum failure is of an insufficient scale to conclude anything
more than another correction within this broader recovery from 26-Sep's 2.1877
low. Indeed, overnights failure below 2.6328 only allows us to conclude
the end of the portion of the month-and-a-half rally from 31-Oct's 2.4822 next
larger-degree corrective low. 2.4822 is the
risk parameter this market still needs to fail below to break the uptrend from
18-Oct's 2.3526 low while this 2.3526 low
remains intact as the risk parameter this market needs to fail below to break
the month-and-a-half uptrend. From an
intermediate-to-longer-term perspective, this week's setback falls well within
the bounds of another correction ahead of further gains. This is another
excellent example of the importance of technical and trading SCALE and
understanding and matching directional risk exposure to one's personal risk
profile.
The
reason overnight's admittedly minor mo failure might have longer-term
importance is the 2.8172-area from which it stemmed. In
Fri's Technical Blog we also noted the market's engagement of the
2.8076-to-2.8159-area marked by the 61.8% retrace of Jun0-Sewp's 3.2758 -2.1877
decline and the 1.000 progression of Sep-Oct's initial 2.1877 - 2.6185
(suspected a-Wave) rally from 18-Oct's 2.3526 (suspected b-Wave) low. We
remind longer-term players that because of the unique and compelling confluence
of:
early-Aug's bearish divergence in WEEKLY momentum
amidst
historically
extreme bullish sentiment/contrary opinion levels in our RJO Bullish
Sentiment Index
an
arguably complete and massive 5-wave Elliott sequence from Mar'20's 0.4605
low to Jun's 4.3260 high (as labeled in the weekly log active-continuation
chart below) and
the
5-wave impulsive sub-division of Jun-Sep's (suspected initial 1st-Wave) decline
The
recovery attempt from 26-Sep's 2.1877 low is arguably only a 3-wave (Wave-2)
corrective rebuttal to Jun-Sep's decline within a massive, multi-quarter
PEAK/reversal process. Now granted, due to the magnitude of 2020 -2022's
secular bull market, we discussed the prospect for this (2nd-Wave corrective)
recovery to be "extensive" in terms of both price and time. A
"more extensive" correction is typified by a retracement of 61.8% or
more and spanning weeks or even months following a 3-month decline. Per
such, the (suspected corrective) recovery from 26-Sep's 2.1877 low could easily
have further to go, with commensurately larger-degree weakness than that
exhibited this week (i.e., a failure below at least 2.4822) required
to consider the correction complete. Indeed, the daily log chart above
shows the market thus far respecting former 2.6185-area resistance from 10-Oct
as a new support candidate.
These
issues considered, very shorter-term traders have been advised to move to a neutral/sideline
position following overnight's momentum failure below 2.6328, with a recovery
above 2.8172 required to negate this call, reaffirm the recovery and re-expose
potentially significant gains thereafter. For intermediate- and
longer-term players, a bullish policy and exposure remain advised with a
failure below 2.4822 required to threaten this call enough to warrant
neutralizing exposure. We will be watchful for another bearish divergence
in momentum following a recovery attempt that falls short of Fri's 2.8172 high
that would be considered the next reinforcing factor to a count calling that
2.8172 high the prospective end to the month-and-a-half 2nd-Wave
correction. In lieu of such, a resumption of the current rally to
eventual new highs above 2.8172 should not surprise.
Economy - Futures Market Outlook w/John Caruso - 11/20/2020
Futures Market Outlook w/John Caruso - 11/20/2020
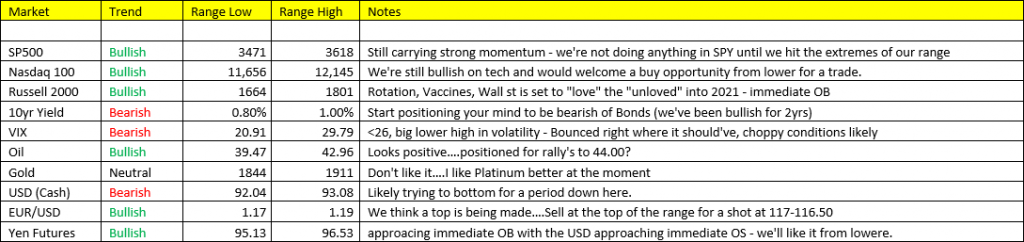
By: John Caruso, Senior Market StrategistPosted Nov 20, 2020 9:04AM CT
A considerably much more quiet morning than yesterday.
Looking at the board right now, more signs of inflation are jumping out at me….
Copper +2.06% (Immediate OB) to 328 Platinum prices +1.48%, to 965 Oil +0.52%, to 42.00 Gasoline +1.14% to 1.1783 Soybeans +1.34% to 1193 Corn +1.01% to 427 Bitcoin +1.30% to 18330
All of the above are signal OB this morning, but this is
Wall Street positioning for Growth/Inflation Accelerating out into next
year. The question is now, when do I begin positioning for a steeper
yield curve aka lower bond prices? I’m slowly making that turn, and plan
on moving to full position when the 10yr yields hit 80bps – But there’s always
a chance I go earlier too! Maybe today. We’re close this
morning at 83bps on the 10yr yield.
We have a nice bounce in Nat Gas to cover on this morning…back soon.
If you have any questions or would like to discuss the markets further, please feel free to contact me at 800-669-5354 or jcaruso@rjofutures.com.