Energy is something that has been traded and used since the dawn of man and is continually used by billions around the world today. We have assembled this kit with goal of informing you how to make money off these precious commodities. The Energy Investor Kit is complete with detailed fundamental and technical analysis on the energy sector and will teach you how to navigate these ever important and potentially lucrative markets.
RJO Futures PRO Trading Platform
FREE 100k Simulated Trading Account
Experience a trading platform like no other with integrated tools to seamlessly trade and monitor the markets. With a free simulated trading account and personal broker experience, we’ll teach you about futures trading and help you develop a trading strategy.
The Markets
Metals - Gold Found a Short-Term Bottom
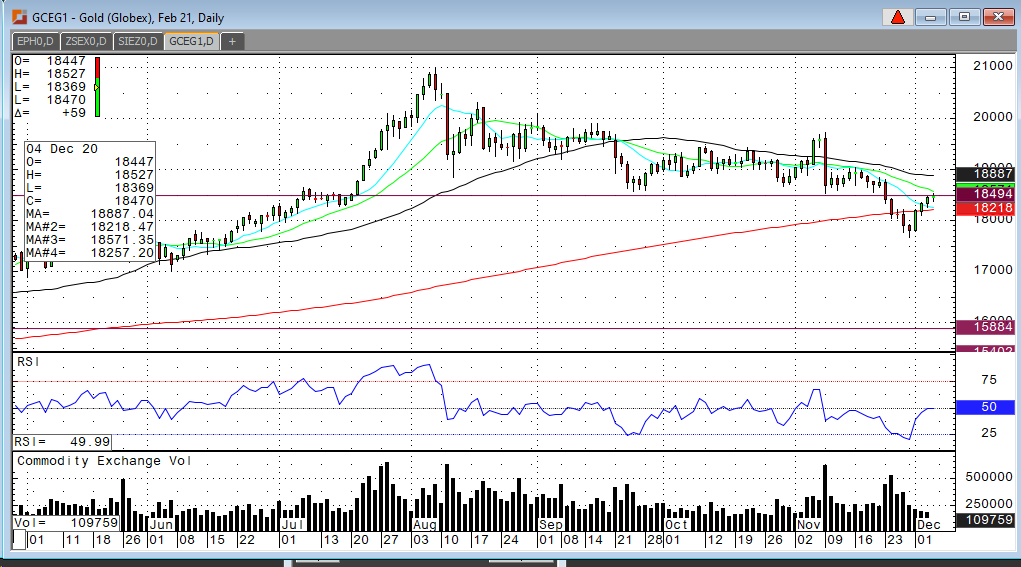
Gold Found a Short-Term Bottom
By: Frank J. Cholly, Senior Market StrategistPosted Dec 4, 2020 9:15AM CT
In my last update I discussed that gold was under pressure
with risk on trade and vaccine news. Since
then the $1,850 level and then $1,800 level were both violated. The selloff
spiked down to $1,762 and bounced back very quickly. I expect that now we see
gold consolidate in the range of $1,850 to $1,875 before ultimately moving back
above $1,900.
Now, in my mind the whole reason that gold reached as low as $1,762 was due to a huge flow of money into BTC! I personally don’t understand that but that’s what happened. I’d rather own something that I could touch! So, gold had a sharp selloff and an equally sharp recovery bounce. That is because the Dollar is weak. The Dollar will continue to be weak. You’ve heard what they’re calling it now…”Modern Monetary Theory”. Easy money, Fiscal Stimulus, Printing Money, Quantitative Easing all add up to the same thing. Debasement of the currency. This is why I will remain bullish on gold. Inflation will be unavoidable.
Gold Feb '21 Daily Chart If you have any questions or would like to discuss the markets further, please feel free to contact me at 800-826-4124 or fcholly@rjofutures.com. Metals - Silver Holding Around Resistance
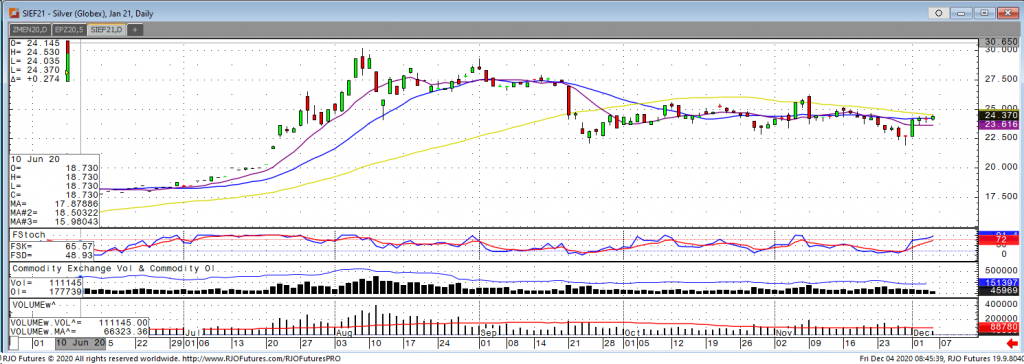
Monday we saw the silver market continue last weeks slide, posting a new recent low of 21.925 in the January contract before turning back positive for the week on Tuesday. The second half of the week we saw the move higher hold but not extend as the market holds around resistance. The silver was making new highs for the week with continued weakness in the dollar but less than desirable jobs numbers pressured silver off its highs early in today’s session. The bulls are in control with the inflation outlook increasing with the continued move lower in the US dollar and the Fed showing no signs of raising rates in the near term. A stimulus package getting passed would also support the silver market here. Since the second half of September January silver has been trading in a sideways range of 22.50 and 25.00 and although the market was trending higher this week it will take positive fundamental news to push the market through the 25 level and back to resistance at 27.50. I still believe the longer-term outlook for silver is to the upside but there will most likely be some back and forth along the way. The market would need to hold support of 23.45 and 22.50 to avoid another washout to the downside.
Silver Jan '21 Daily Chart If you have any questions or would like to discuss the markets further, please feel free to contact me at 800-826-2270 or therrmann@rjofutures.com. Energy - OPEC+ Come to Agreement
OPEC+ Come to Agreement
By: Alex Turro, Senior Market StrategistPosted Dec 4, 2020 9:00AM CT
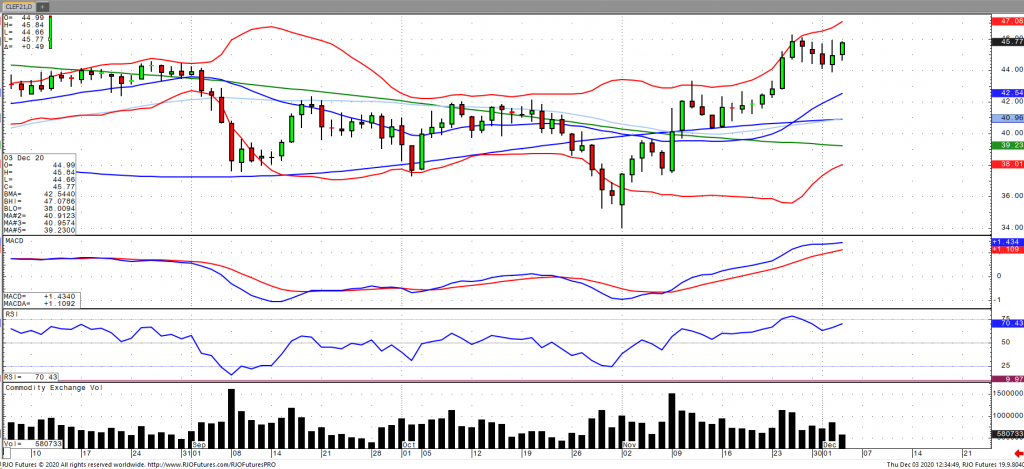
As of the Thursday afternoon session, oil prices have continued to edge higher following a multi-day retracement despite reports that OPEC+ have agreed to a collective output increase of 500k bpd next month ending a deadlock in discussion. The agreement was viewed as a form of cohesion following the impasse as the initial expectation was of a continuation of oil production cuts of 7.7 million bpd through March. The deal will be set proportionally with an agreement in place to review production each month as demand prospects continue to remain uncertain. This comes amidst a slight draw in EIA crude stocks and a surprise build of 4.1 million barrels in API crude stocks with a large increase in the weekly inflows of the product markets. The market may have been supported in by reports that the US exported nearly 3.5 million barrels last week, however, the refinery rate declined indicating a perhaps a setback in demand following the holiday uptick. The market remains bullish trend with today’s range seen between 42.07 – 47.11.
Crude Oil Jan '21 Daily Chart If you have any questions or would like to discuss the markets further, please feel free to contact me at 800-438-4805 or aturro@rjofutures.com. Softs - Coffee Holds Support
Coffee Holds Support
By: Adam TuiaanaPosted 12/02/2020
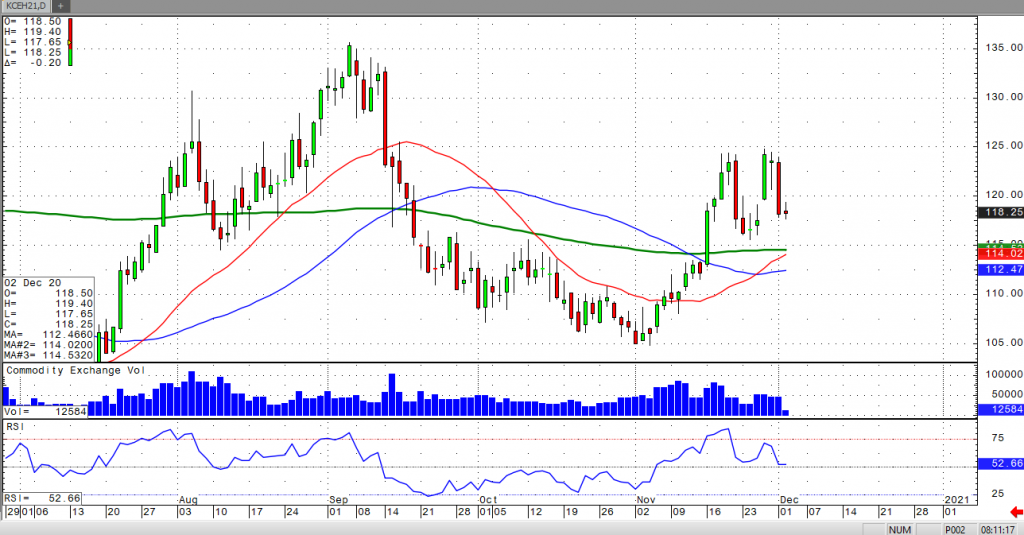
Some continued wet weather is key growing areas of
Brazil has helped to keep March coffee futures prices in check, as earlier dry
weather had been forecasted to be a large bullish factor. However, lock downs
on restaurants and coffee houses will continue to prompt sluggish demand on
coffee, but the promise of a future-tight crop should continue to provide March
coffee prices with some support.
The UK has announced that they will begin distributing
the Pfizer vaccine, which should be viewed as a bullish factor on the demand
side for coffee. Although several factors will continue to play a role in how
effective the vaccine and distribution of the vaccine will be, on-the-whole,
the news is positive for the future of coffee shops and restaurants.
From a technical perspective, the aggressive
bullish crossover of the price action through the 200-day MA has been followed
by consolidation and strong support. The March coffee price action has also
managed to back and fill the gap from 11/27/20 at 119, and has subsequently
held support above the 200-day MA. There are several strategies that traders can apply in this situation.
On
the heels of mid-Sep-to-early-Oct's steeper, accelerated, 3rd-wave-looking
recovery, the past week-and-a-half's boringly lateral chop is first considered
a corrective/consolidative event that warns of a continuation of the uptrend
that preceded it to new highs above 04-Oct's 891.0 high. This count
remains consistent with our broader base/correction/recovery count introduced
in 13-Sep's Technical Blog following that
day's bullish divergence in short-term momentum above 07-Sep's 809.5 minor
corrective high detailed in the hourly chart below.
The
important takeaway from this month's lateral, sleepy price action is the
definition of Wed's 851.5 low as
the end or lower boundary of a suspected 4th-Wave correction. A failure
below 851.5 will confirm a bearish divergence in daily momentum and defer or
threaten a bullish count enough to warrant non-bullish decisions like
long-covers. A failure below 851.5 will not
necessarily negate a broader bullish count, but it will threaten it enough to
warrant defensive measures as the next pertinent technical levels below 851.5 are
13-Sep's prospective minor 1st-Wave high at 813.8 and obviously 08-Sep's 766.0
low. And making non-bullish decisions "down there" is
sub-optimal to say the least. Per such, both short- and longer-term
commercial traders are advised to pare or neutralize bullish exposure on a
failure below 851.5, acknowledging and accepting whipsaw risk- back above 04-Oct's
891.0 high- in exchange for much deeper and sub-optimal nominal risk below
766.0.
On
a broader scale, the daily log scale chart above shows the developing potential
for a bearish divergence in daily momentum that will be considered confirmed
below 851.5. This chart also shows the past month's recovery thus far
stalling in the immediate neighborhood of the (888.0) Fibonacci
minimum 38.2% retrace of Apr-Sep's entire 1128 - 766 decline). COMBINED
with a failure below 851.5, traders
would then need to be concerned with at least a larger-degree correction pf the
past month's rally and possibly a resumption of Apr-Sep's major downtrend.
Until
and unless the market fails below 851.5 however, we would
remind longer-term players of the key elements on which our bullish count is
predicated:
a confirmed bullish divergence in WEEKLY momentum
(below)
amidst
an
historically low 11% reading in out RJO Bullish Sentiment Index and
a
textbook complete and major 5-wave Elliott sequence down from 29-Apr's
1128 high to 08-Sep's 766.0 low.
Thus
far, the market is only a month into correcting a 4-MONTH, 32% drawdown, so
further and possibly protracted gains remain well within the bounds of a major
(suspected 2nd-Wave) correction of Apr-Sep's decline within an even more
massive PEAK/reversal process from 17-May's 1219 high on an active continuation
basis below.
These
issues considered, a bullish policy and exposure remain advised with a failure
below 851.5 required to defer or threaten this call enough to warrant moving to
a neutral/sideline position. In lieu of such weakness, we anticipate a
continuation of the past month's rally to new highs and potentially significant
gains above 891.0.
Agricultural - Grain Futures Update w/Stephen Davis - 12/04/2020
Grain Futures Update w/Stephen Davis - 12/04/2020
By: Stephen DavisPosted 12/04/2020
Stephen Davis discusses the latest news moving the grain markets. He believes traders should look for corn to close out the year strong as China is still buying U.S. cornCurrency - USD Outlook Remains Poor
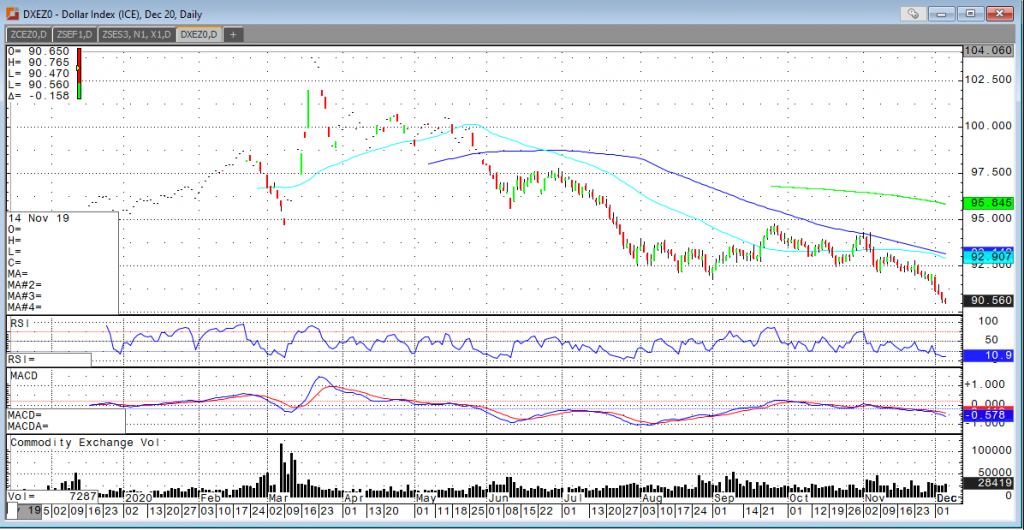
USD Outlook Remains Poor
By: Tony Cholly, Senior Market StrategistPosted Dec 4, 2020 9:09AM CT
While the USD short term remains technically oversold, the bias does remain down. Unfortunately, the US nonfarm payroll report is a coin flip, as historic conditions and large numbers should mean big surprise potentials. This report came in lower than expected today at 245,000. With a prevailing view in the marker that the US economy is losing recovery momentum against the idea that the economy will get beyond the crisis, today’s reaction in the dollar should be temporary. Getting short the USD is suspect from a trade location perspective but should agree with the ultimate trend. Today’s disappointing jobs report reaction might be delayed until late in the session when expectations for stimulus will either be confirmed or denied. Resistance comes in at 9095 and 9130 with support at 9035 and 9010
USD Dec '20 Daily Chart If you have any questions or would like to discuss the markets further, please feel free to contact me at 800-826-2270 or tcholly@rjofutures.com. Interest Rates - Interest Rates Facing Pressure from Covid-19 Vaccine
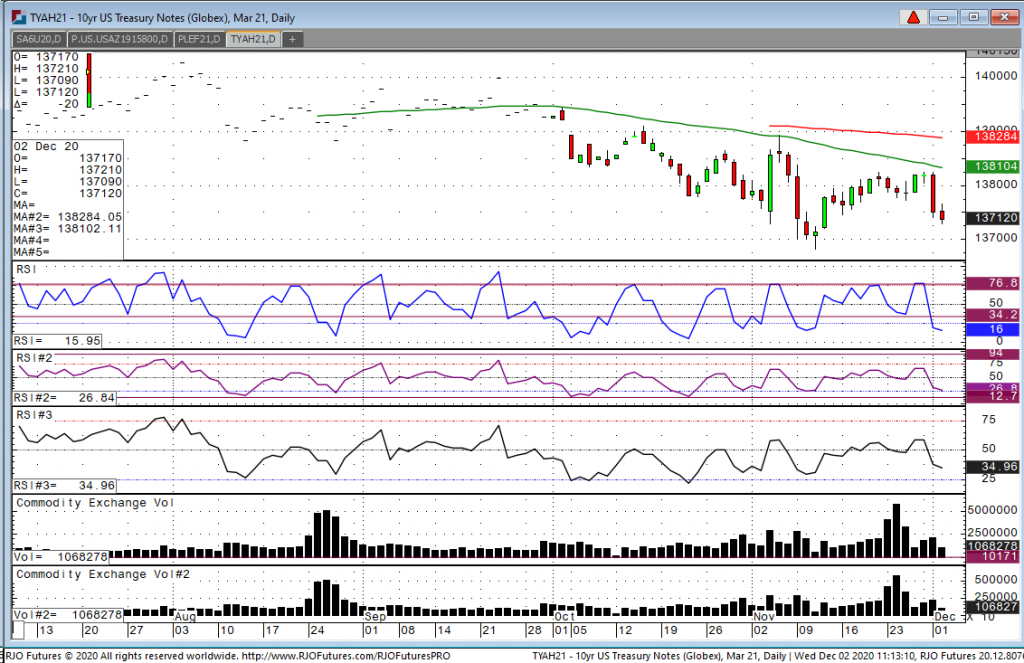
Interest Rates Facing Pressure from Covid-19 Vaccine
Looking at the March 10-year, overnight we saw a high of 137-21 and this morning we had a low of 137-09. Currently, we are trading at 137-105. We have seen pressure in todays trade on continued optimism on the vaccine front with deliveries taking place in the next two weeks. That has certainly added to a "risk on" environment in the trading complex. Earlier this morning we saw the monthly ADP employment report come in lower than expected. The street was looking for 410k, and the actual number came in significantly lower at 307K. Normally, this would have been a bullish sign for treasuries, but the market seems fixated on vaccine news rather than economic numbers. Friday morning, we have the monthly employment numbers which will certainly be watched closely as the weekly claims numbers in the last month or so have ticked up, so I would expect a weaker than expected payroll number as well. Technically the March 10-year being below the 50-day moving average is a bearish sign and that number sits at 138-105. On the downside, traders should be cognizant at the 136-265 level which was the low in the contract on November 11. First time down I would expect a bounce at that level.
10-Year Note Mar '21 Daily Chart If you have any questions or would like to discuss the markets further, please feel free to contact me at 800-826-2270 or gperlin@rjofutures.com. Equity - Stocks Remain Near Record Levels Despite Weak Jobs Data
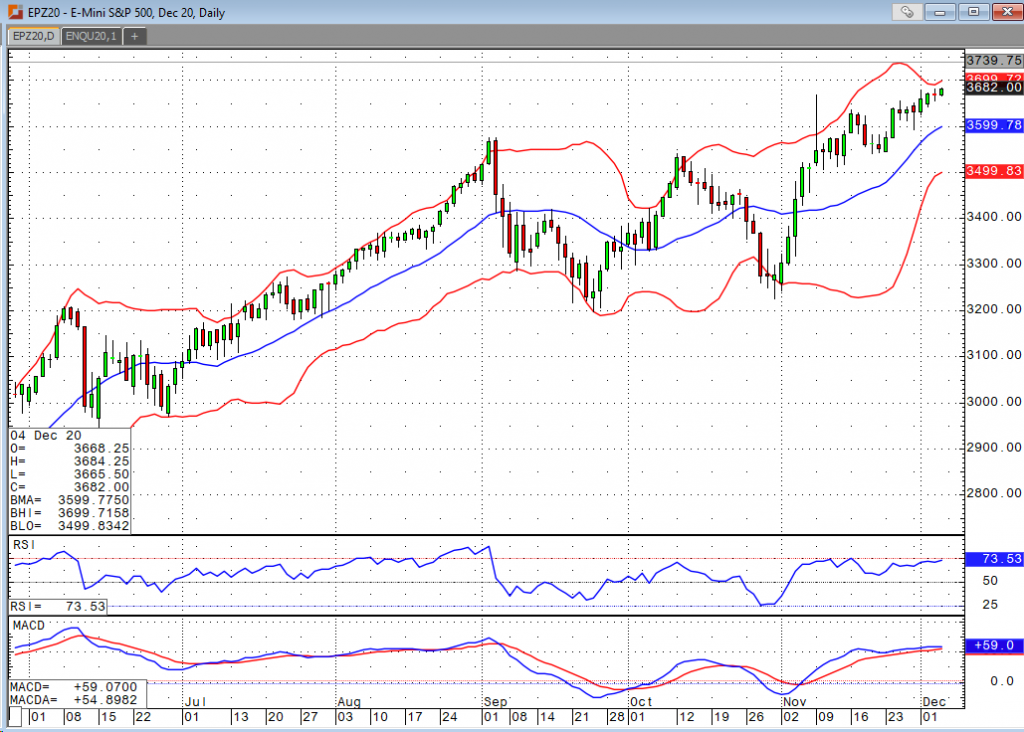
Stocks Remain Near Record Levels Despite Weak Jobs Data
By: Bill Dixon, Senior Market StrategistPosted Dec 4, 2020 9:07AM CT
This morning’s employment report did not exactly give the
bulls something to hang their hat on. We
expected to see a reading of 500k jobs added.
The actual number was only 245k.
We also revised the prior reading lower by 28k. Private payrolls and manufacturing readings
also missed expectations and saw previous numbers revised lower. While the news wasn’t the best, stocks
continue to trade at or near their all-time highs. Perhaps we’re back into the “Bad news is good
news” cycle in which bad readings just mean larger stimulus packages. Speaking of which, stimulus has been back in
the news this week as it appears we are getting closer to a bipartisan, Covid-19
relief bill. The word is that the
package will be in the neighborhood of one trillion dollars, and both sides
seem to be confident something will get passed in short order.
New highs were printed in the S&P and Russell. We’re not far off on the Dow and Nasdaq. Perhaps we’ll see some profit taking to close the week out, but seasonal trends still favor upside. Buyers of dips remain active, and I see little reason for that to stop in the near term.
E-mini S&P 500 Dec '20 Daily If you have any questions or would like to discuss the markets further, please feel free to contact me at 800-669-5354 or bdixon@rjofutures.com. Economy - S-T Mo Failure Insufficient to End RBOB Correction, But Beware
S-T Mo Failure Insufficient to End RBOB Correction, But Beware
By: RJO Market InsightsPosted 11/08/2022
Posted on Nov 08, 2022, 07:51 by Dave Toth
In Fri's Technical Webcast we identified a
minor corrective low at 2.6328 from Thur as a mini risk parameter the market
needed to sustain gains above to maintain a more immediate bullish count.
The 240-min chart below shows the market's failure overnight below this level,
confirming a bearish divergence in very short-term momentum. This mo
failure defines Fri's 2.8172 high as
one of developing importance and a parameter from which very short-term traders
can objectively base non-bullish decisions like long-covers.
Given
the magnitude of the past three weeks' broader recovery however, this
short-term momentum failure is of an insufficient scale to conclude anything
more than another correction within this broader recovery from 26-Sep's 2.1877
low. Indeed, overnights failure below 2.6328 only allows us to conclude
the end of the portion of the month-and-a-half rally from 31-Oct's 2.4822 next
larger-degree corrective low. 2.4822 is the
risk parameter this market still needs to fail below to break the uptrend from
18-Oct's 2.3526 low while this 2.3526 low
remains intact as the risk parameter this market needs to fail below to break
the month-and-a-half uptrend. From an
intermediate-to-longer-term perspective, this week's setback falls well within
the bounds of another correction ahead of further gains. This is another
excellent example of the importance of technical and trading SCALE and
understanding and matching directional risk exposure to one's personal risk
profile.
The
reason overnight's admittedly minor mo failure might have longer-term
importance is the 2.8172-area from which it stemmed. In
Fri's Technical Blog we also noted the market's engagement of the
2.8076-to-2.8159-area marked by the 61.8% retrace of Jun0-Sewp's 3.2758 -2.1877
decline and the 1.000 progression of Sep-Oct's initial 2.1877 - 2.6185
(suspected a-Wave) rally from 18-Oct's 2.3526 (suspected b-Wave) low. We
remind longer-term players that because of the unique and compelling confluence
of:
early-Aug's bearish divergence in WEEKLY momentum
amidst
historically
extreme bullish sentiment/contrary opinion levels in our RJO Bullish
Sentiment Index
an
arguably complete and massive 5-wave Elliott sequence from Mar'20's 0.4605
low to Jun's 4.3260 high (as labeled in the weekly log active-continuation
chart below) and
the
5-wave impulsive sub-division of Jun-Sep's (suspected initial 1st-Wave) decline
The
recovery attempt from 26-Sep's 2.1877 low is arguably only a 3-wave (Wave-2)
corrective rebuttal to Jun-Sep's decline within a massive, multi-quarter
PEAK/reversal process. Now granted, due to the magnitude of 2020 -2022's
secular bull market, we discussed the prospect for this (2nd-Wave corrective)
recovery to be "extensive" in terms of both price and time. A
"more extensive" correction is typified by a retracement of 61.8% or
more and spanning weeks or even months following a 3-month decline. Per
such, the (suspected corrective) recovery from 26-Sep's 2.1877 low could easily
have further to go, with commensurately larger-degree weakness than that
exhibited this week (i.e., a failure below at least 2.4822) required
to consider the correction complete. Indeed, the daily log chart above
shows the market thus far respecting former 2.6185-area resistance from 10-Oct
as a new support candidate.
These
issues considered, very shorter-term traders have been advised to move to a neutral/sideline
position following overnight's momentum failure below 2.6328, with a recovery
above 2.8172 required to negate this call, reaffirm the recovery and re-expose
potentially significant gains thereafter. For intermediate- and
longer-term players, a bullish policy and exposure remain advised with a
failure below 2.4822 required to threaten this call enough to warrant
neutralizing exposure. We will be watchful for another bearish divergence
in momentum following a recovery attempt that falls short of Fri's 2.8172 high
that would be considered the next reinforcing factor to a count calling that
2.8172 high the prospective end to the month-and-a-half 2nd-Wave
correction. In lieu of such, a resumption of the current rally to
eventual new highs above 2.8172 should not surprise.