Energy is something that has been traded and used since the dawn of man and is continually used by billions around the world today. We have assembled this kit with goal of informing you how to make money off these precious commodities. The Energy Investor Kit is complete with detailed fundamental and technical analysis on the energy sector and will teach you how to navigate these ever important and potentially lucrative markets.
RJO Futures PRO Trading Platform
FREE 100k Simulated Trading Account
Experience a trading platform like no other with integrated tools to seamlessly trade and monitor the markets. With a free simulated trading account and personal broker experience, we’ll teach you about futures trading and help you develop a trading strategy.
The Markets
Metals - Gold is Showing Signs of Life
Gold is Showing Signs of Life
By: Frank J. Cholly, Senior Market StrategistPosted Dec 18, 2020 9:34AM CT
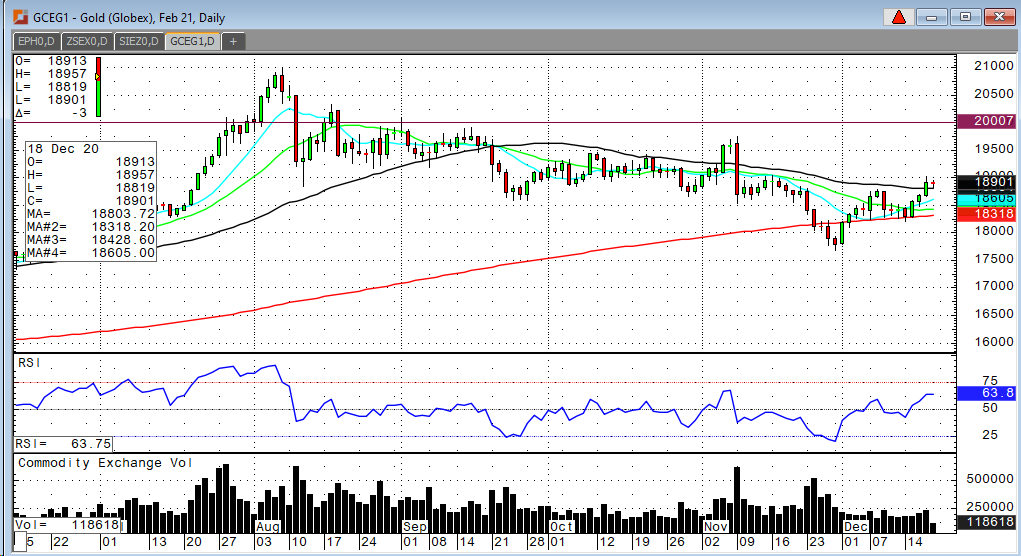
A very impressive rally in gold this week brings the market
back towards the pivotal $1,900 level. The bulls will need to see a close today
above $1,895 and then a close above $1,900. It shouldn’t take much to get back
to November highs around $1,50 to $1,960 range.
You can say the rally is about an additional stimulus
agreement, Dollar weakness or possible government shutdown. Taken together,
these things all add up to the same thing. More money. Print more money. Spend
more money. This is all they know how to do. After the FOMC Meeting conclusion
this week, Chairman Powell reminded us that we face significant challenges due
to the virus. The Fed is fully committed and will use every tool in their box
to hit their targeted rate of inflation. They already let us know also, that
there will be NO rate hikes thru 2021. Most would agree that there’s no sign or
at least no concerns about inflation. So, let me ask you this. Have you seen
what’s going on in the energies, crude and gasoline? How bout soybeans? How
bout copper?
I’m telling you now, that this is the early stages of the next big bull market in commodities. The signs are there. Look at the Money Supply at record highs. Look at what the Fed is willing to do. We now have several vaccines being distributed and the economy will have a huge rebound as businesses around the globe begin to re-open. Demand will return because there’s tons of cash out there! Gold will break out above $2,000 again, and that will become the new bottom in gold.
Gold Feb '21 Daily Chart If you have any questions or would like to discuss the markets further, please feel free to contact me at 800-826-4124 or fcholly@rjofutures.com. Metals - Silver Still Trading Sideways
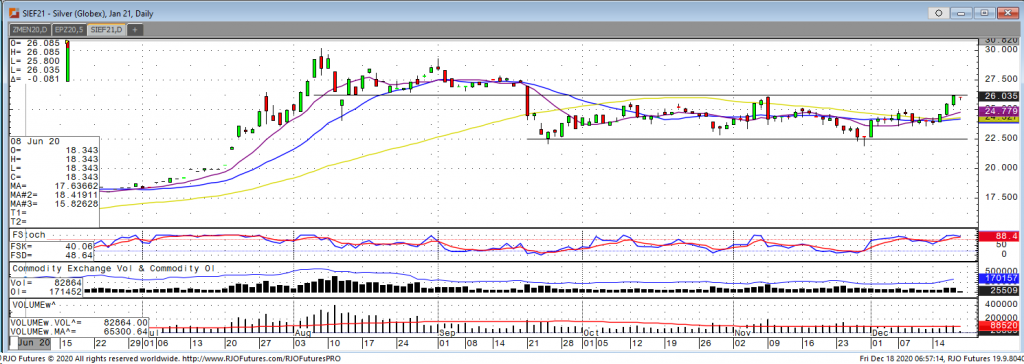
This week we saw silver trade to the upper end of the sideways range its been in since the second half of September. With positive moves higher on Tuesday, Wednesday, and Thursday, The Jan silver contract reached a weekly high of 26.20, a level not seen in over a month. This week’s rally had many bullish factors, reports of progress on a US stimulus package, continued pressure on the US dollar, and a dovish take away from this week’s FOMC meeting. The Fed looks to continue asset purchases and let inflation run which is supportive for both gold and silver. There has been a little bit of a pullback to start Friday’s session with the market unable to extend this week’s gain through support at this time. With the weakening dollar, low rates, and the Fed not looking to curtail inflation a longer-term rally in silver could be developing. We would need to see this rally continue up to the next resistance point of 27.50. First support comes in around 25.15 and if that level is broke expect the market to trade down to around 24.00 to 24.50.
Silver Jan '21 Daily Chart If you have any questions or would like to discuss the markets further, please feel free to contact me at 800-826-2270 or therrmann@rjofutures.com. Energy - Oil Advances but Signaling Overbought
Oil Advances but Signaling Overbought
By: Alex Turro, Senior Market StrategistPosted Dec 18, 2020 9:46AM CT
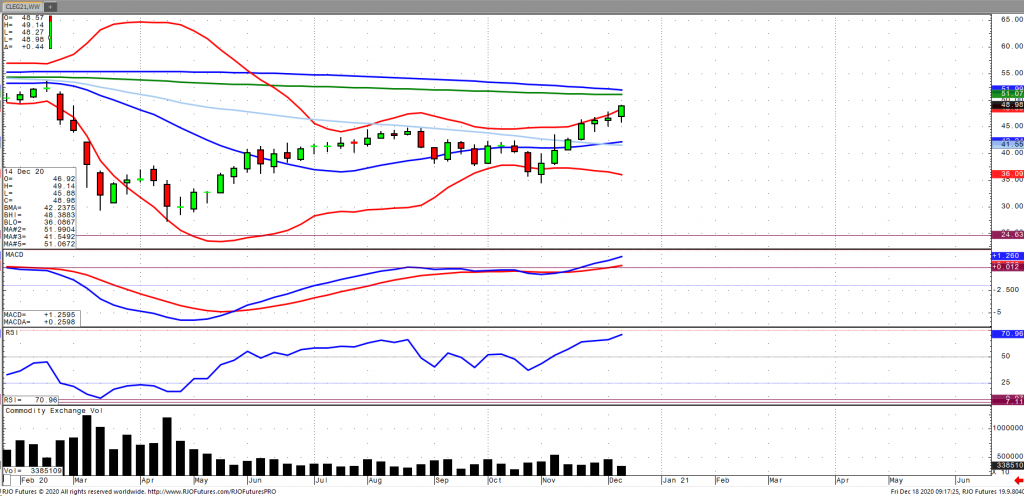
Oil prices are continuing their advance this morning amidst continued optimism in economic recovery, aided by the prospect of relief and continued vaccine rollouts and the subsequent impact on fuel demand. China and India are leading the Asian recovery move with record refining demand in India, which along with the continued crash in the US Dollar, which broke down to a 21/2-year low on Thursday, has only lent further support. In addition, US inventories fell more than expected coming in by 3.1 million barrels, according to the EIA. The market remains bullish trend but is signaling immediate term overbought with oil volatility (OVX) suggesting a move a lower with today’s range seen between 44.95 – 48.80.
Crude Oil Feb '21 Daily Chart If you have any questions or would like to discuss the markets further, please feel free to contact me at 800-438-4805 or aturro@rjofutures.com. Softs - Coffee Rallies Again
Coffee Rallies Again
By: Adam TuiaanaPosted 12/16/2020
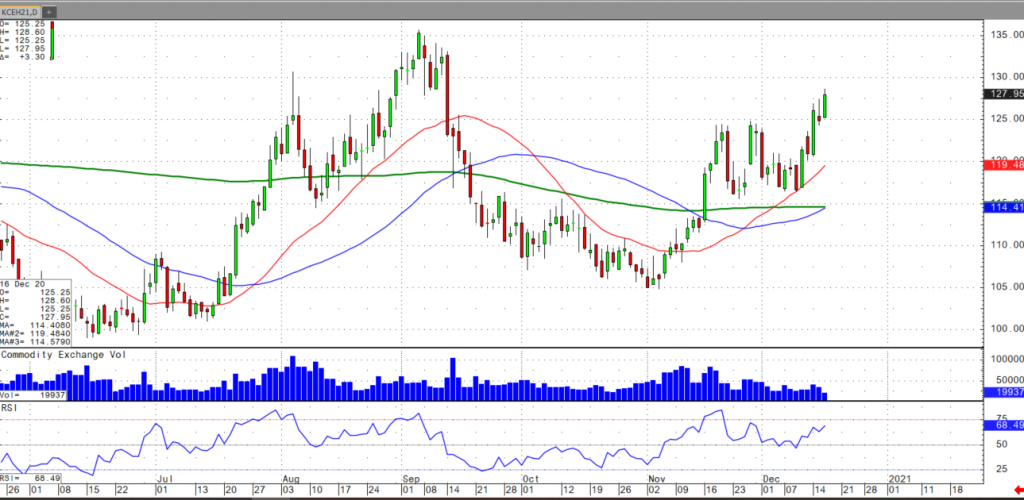
March coffee futures have been breaking out recently, clearing all
levels of resistance, mostly in part due to the continued bullish outlook for 2021/2022
crop year. This bullish supply outlook is due to the
extremely dry weather in Brazil earlier this year, and the subsequent wet
weather events precipitated by El Nina have not proven to be enough to offset
the tight supply. Although there is wet weather forecasted for this week for
the Brazilian States of Sao Paulo and Minas Gerias, these rains also most
likely will not be enough to offset the supply effects of the earlier dry
weather.
The UK and EU have also seen less demand due to
Covid restrictions, but the announcement of the distribution of the Pfizer
vaccine, along with several other vaccines on the horizon, give the much
awaited promise that many will gain the confidence to overcome their fears of
returning to coffee shops and restaurants, and ultimately their lives as they
knew them.
From a technical perspective, strong support is
being held at the 200-MA, resting at 1.14. In addition, a break above the key
resistance level of 1.25 is also very bullish, and RSI and Volume levels
holding steady. It is likely that corrective action will take place, back down
to 120, before another leg higher is made.
For more frequent commentary, please check out and subscribe to my daily futures market videos on coffee and other commodities.
On
the heels of mid-Sep-to-early-Oct's steeper, accelerated, 3rd-wave-looking
recovery, the past week-and-a-half's boringly lateral chop is first considered
a corrective/consolidative event that warns of a continuation of the uptrend
that preceded it to new highs above 04-Oct's 891.0 high. This count
remains consistent with our broader base/correction/recovery count introduced
in 13-Sep's Technical Blog following that
day's bullish divergence in short-term momentum above 07-Sep's 809.5 minor
corrective high detailed in the hourly chart below.
The
important takeaway from this month's lateral, sleepy price action is the
definition of Wed's 851.5 low as
the end or lower boundary of a suspected 4th-Wave correction. A failure
below 851.5 will confirm a bearish divergence in daily momentum and defer or
threaten a bullish count enough to warrant non-bullish decisions like
long-covers. A failure below 851.5 will not
necessarily negate a broader bullish count, but it will threaten it enough to
warrant defensive measures as the next pertinent technical levels below 851.5 are
13-Sep's prospective minor 1st-Wave high at 813.8 and obviously 08-Sep's 766.0
low. And making non-bullish decisions "down there" is
sub-optimal to say the least. Per such, both short- and longer-term
commercial traders are advised to pare or neutralize bullish exposure on a
failure below 851.5, acknowledging and accepting whipsaw risk- back above 04-Oct's
891.0 high- in exchange for much deeper and sub-optimal nominal risk below
766.0.
On
a broader scale, the daily log scale chart above shows the developing potential
for a bearish divergence in daily momentum that will be considered confirmed
below 851.5. This chart also shows the past month's recovery thus far
stalling in the immediate neighborhood of the (888.0) Fibonacci
minimum 38.2% retrace of Apr-Sep's entire 1128 - 766 decline). COMBINED
with a failure below 851.5, traders
would then need to be concerned with at least a larger-degree correction pf the
past month's rally and possibly a resumption of Apr-Sep's major downtrend.
Until
and unless the market fails below 851.5 however, we would
remind longer-term players of the key elements on which our bullish count is
predicated:
a confirmed bullish divergence in WEEKLY momentum
(below)
amidst
an
historically low 11% reading in out RJO Bullish Sentiment Index and
a
textbook complete and major 5-wave Elliott sequence down from 29-Apr's
1128 high to 08-Sep's 766.0 low.
Thus
far, the market is only a month into correcting a 4-MONTH, 32% drawdown, so
further and possibly protracted gains remain well within the bounds of a major
(suspected 2nd-Wave) correction of Apr-Sep's decline within an even more
massive PEAK/reversal process from 17-May's 1219 high on an active continuation
basis below.
These
issues considered, a bullish policy and exposure remain advised with a failure
below 851.5 required to defer or threaten this call enough to warrant moving to
a neutral/sideline position. In lieu of such weakness, we anticipate a
continuation of the past month's rally to new highs and potentially significant
gains above 891.0.
Agricultural - Grain Futures Update w/Stephen Davis
Grain Futures Update w/Stephen Davis
By: Stephen DavisPosted 12/18/2020
Stephen Davis discusses the latest news moving the grain markets including continued news on china and how the Covid-19 vaccine will impact U.S. grainsInterest Rates - Should Be Interesting Day in Interest Rates Ahead of Potential Stimulus Deal
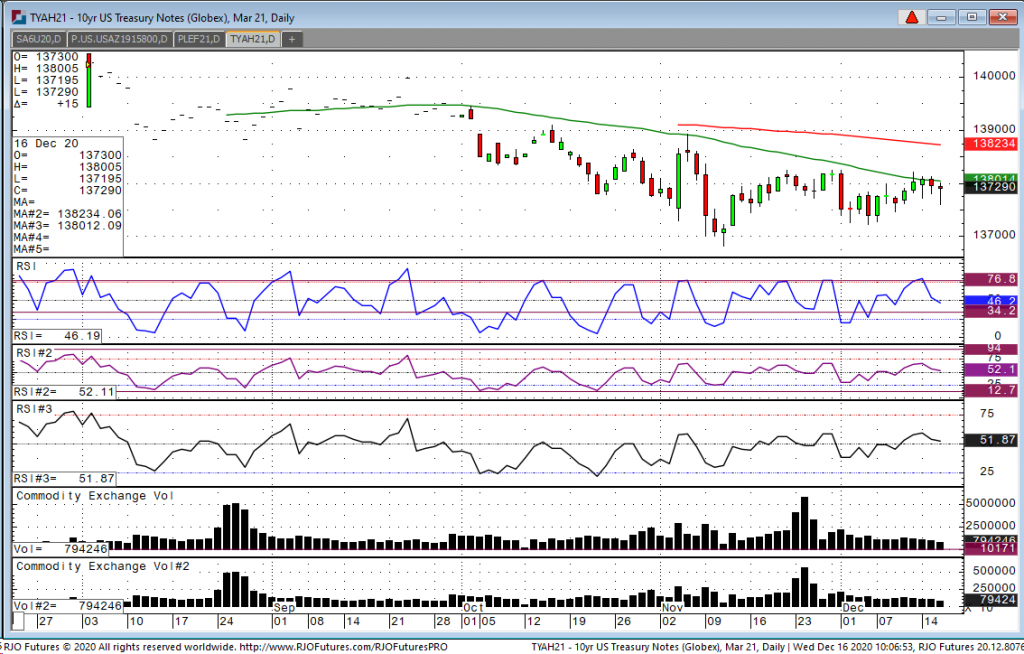
Should Be Interesting Day in Interest Rates Ahead of Potential Stimulus Deal
Looking at the 10-year notes today, we have a high of 138-005 and a low of 137-095. We should have a very interesting day. Many are expecting Congress to pass a Covid-19 stimulus bill today, but details of what is included in that bill remain unknown. Two big sticking points that remain are; does congress give money to most democratic states that are in deep financial distress, and are there going to be checks sent out to Americans. There has been talk the checks could be in the $300-$600 range as Pelosi is pushing for higher and McConnel pushing for the lower. We shall see. The other important item on the docket today is the last FOMC meeting today with the announcement coming at 1:00 PM central followed by a Q&A a 1:30 by chairman Powell. Consensus is that there will be no change by the Federal Reserve, but traders will be listening closely for any changes in the wording, which is very important because it gives traders insight on what the fed is thinking go forward. So, as we wait on both announcements today traders should be cautious looking ahead for early afternoon volatility.
10yr T-Note Mar '21 Daily Chart If you have any questions or would like to discuss the markets further, please feel free to contact me at 800-826-2270 or gperlin@rjofutures.com. Equity - Stocks Dipping to Close Week
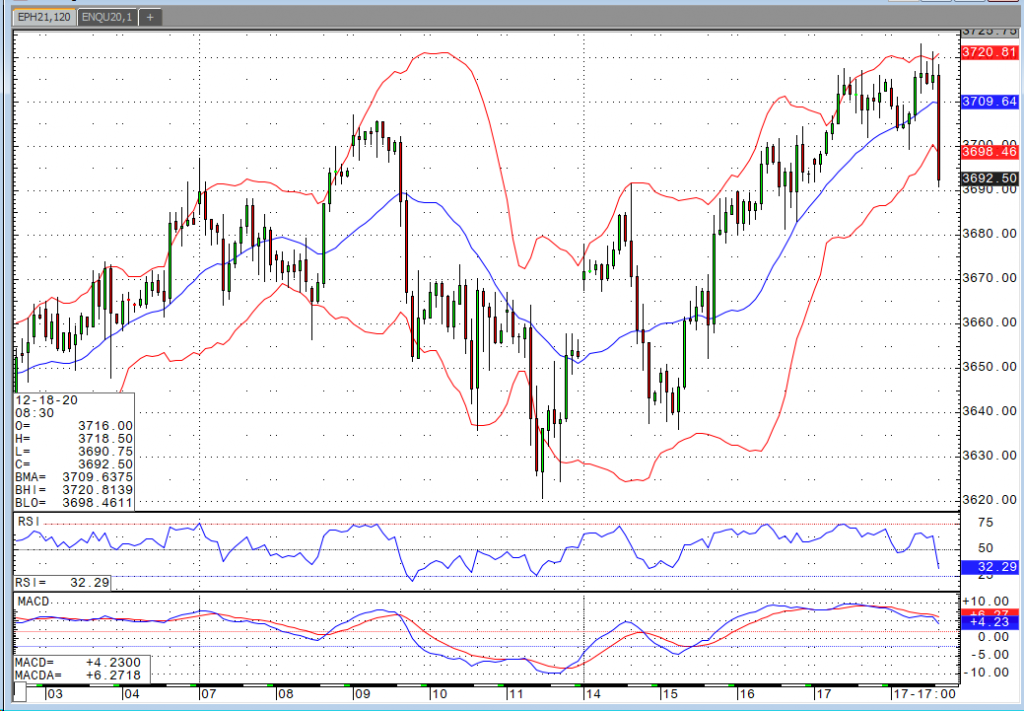
Stocks Dipping to Close Week
By: Bill Dixon, Senior Market StrategistPosted Dec 18, 2020 10:09AM CT
Three of the four major indices are lower this morning in
the wake of the opening bell. Stimulus
talks continue to be encouraging, but we still can’t seem to get over the goal
line there. Despite the fact that it’s
been nearly ¾ of a year since we last approved some form of relief/stimulus,
the market continues to get excited every time these talks seem to heat
up. One has to wonder how much of the
proposed $900 billion package is already priced in.
We also have more news on a significant hack to SolarWinds that effected several high profile users like the US Treasury and the US National Nuclear Security Administration. It is believed that the upwards of 18,000 users were affected by the hack. Of those, the hackers have pursued seem to have focused on about 40 including the previously mentioned government agencies and Microsoft.
E-mini S&P 500 Mar '21 Daily Chart If you have any questions or would like to discuss the markets further, please feel free to contact me at 800-669-5354 or bdixon@rjofutures.com. Equity - S&P 500 and Gold Futures Update w/Adam Tuiaana - 12/17/2020
S&P 500 and Gold Futures Update w/Adam Tuiaana - 12/17/2020
By: Adam TuiaanaPosted 12/17/2020
Adam provides an update on the E-mini S&P and gold futures. Adam also provides an overview of today's system pick, Golden Boy.Economy - S-T Mo Failure Insufficient to End RBOB Correction, But Beware
S-T Mo Failure Insufficient to End RBOB Correction, But Beware
By: RJO Market InsightsPosted 11/08/2022
Posted on Nov 08, 2022, 07:51 by Dave Toth
In Fri's Technical Webcast we identified a
minor corrective low at 2.6328 from Thur as a mini risk parameter the market
needed to sustain gains above to maintain a more immediate bullish count.
The 240-min chart below shows the market's failure overnight below this level,
confirming a bearish divergence in very short-term momentum. This mo
failure defines Fri's 2.8172 high as
one of developing importance and a parameter from which very short-term traders
can objectively base non-bullish decisions like long-covers.
Given
the magnitude of the past three weeks' broader recovery however, this
short-term momentum failure is of an insufficient scale to conclude anything
more than another correction within this broader recovery from 26-Sep's 2.1877
low. Indeed, overnights failure below 2.6328 only allows us to conclude
the end of the portion of the month-and-a-half rally from 31-Oct's 2.4822 next
larger-degree corrective low. 2.4822 is the
risk parameter this market still needs to fail below to break the uptrend from
18-Oct's 2.3526 low while this 2.3526 low
remains intact as the risk parameter this market needs to fail below to break
the month-and-a-half uptrend. From an
intermediate-to-longer-term perspective, this week's setback falls well within
the bounds of another correction ahead of further gains. This is another
excellent example of the importance of technical and trading SCALE and
understanding and matching directional risk exposure to one's personal risk
profile.
The
reason overnight's admittedly minor mo failure might have longer-term
importance is the 2.8172-area from which it stemmed. In
Fri's Technical Blog we also noted the market's engagement of the
2.8076-to-2.8159-area marked by the 61.8% retrace of Jun0-Sewp's 3.2758 -2.1877
decline and the 1.000 progression of Sep-Oct's initial 2.1877 - 2.6185
(suspected a-Wave) rally from 18-Oct's 2.3526 (suspected b-Wave) low. We
remind longer-term players that because of the unique and compelling confluence
of:
early-Aug's bearish divergence in WEEKLY momentum
amidst
historically
extreme bullish sentiment/contrary opinion levels in our RJO Bullish
Sentiment Index
an
arguably complete and massive 5-wave Elliott sequence from Mar'20's 0.4605
low to Jun's 4.3260 high (as labeled in the weekly log active-continuation
chart below) and
the
5-wave impulsive sub-division of Jun-Sep's (suspected initial 1st-Wave) decline
The
recovery attempt from 26-Sep's 2.1877 low is arguably only a 3-wave (Wave-2)
corrective rebuttal to Jun-Sep's decline within a massive, multi-quarter
PEAK/reversal process. Now granted, due to the magnitude of 2020 -2022's
secular bull market, we discussed the prospect for this (2nd-Wave corrective)
recovery to be "extensive" in terms of both price and time. A
"more extensive" correction is typified by a retracement of 61.8% or
more and spanning weeks or even months following a 3-month decline. Per
such, the (suspected corrective) recovery from 26-Sep's 2.1877 low could easily
have further to go, with commensurately larger-degree weakness than that
exhibited this week (i.e., a failure below at least 2.4822) required
to consider the correction complete. Indeed, the daily log chart above
shows the market thus far respecting former 2.6185-area resistance from 10-Oct
as a new support candidate.
These
issues considered, very shorter-term traders have been advised to move to a neutral/sideline
position following overnight's momentum failure below 2.6328, with a recovery
above 2.8172 required to negate this call, reaffirm the recovery and re-expose
potentially significant gains thereafter. For intermediate- and
longer-term players, a bullish policy and exposure remain advised with a
failure below 2.4822 required to threaten this call enough to warrant
neutralizing exposure. We will be watchful for another bearish divergence
in momentum following a recovery attempt that falls short of Fri's 2.8172 high
that would be considered the next reinforcing factor to a count calling that
2.8172 high the prospective end to the month-and-a-half 2nd-Wave
correction. In lieu of such, a resumption of the current rally to
eventual new highs above 2.8172 should not surprise.