It’s time to turn the page to a new year! Receive $5-A-Side commissions for 60-days when you open a Broker-Assisted account anytime during January and February!
RJO Futures PRO Trading Platform
FREE 100k Simulated Trading Account
Experience a trading platform like no other with integrated tools to seamlessly trade and monitor the markets. With a free simulated trading account and personal broker experience, we’ll teach you about futures trading and help you develop a trading strategy.
The Markets
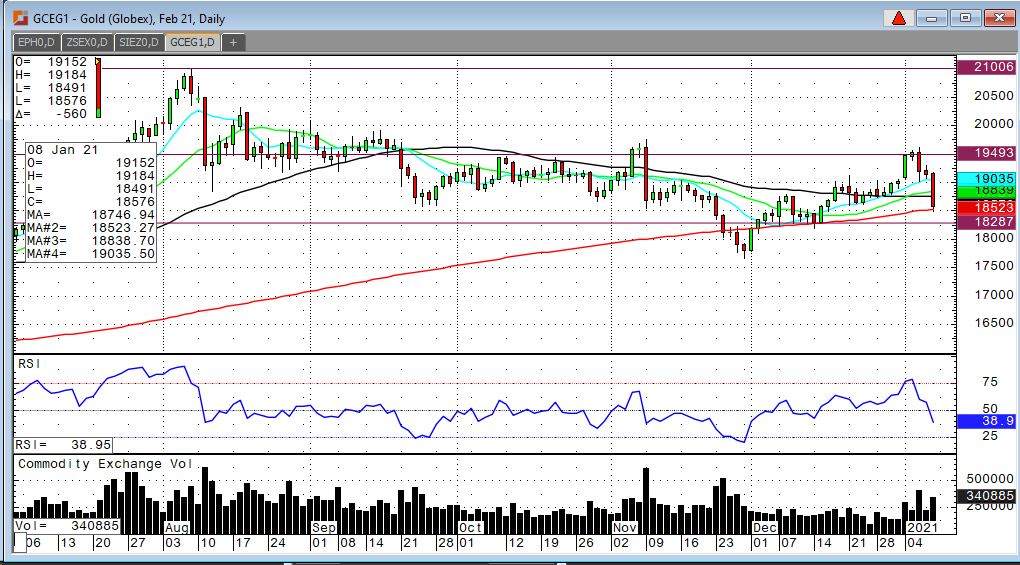
Metals - Gold Stuck in a Big Sideways Range
Gold Stuck in a Big Sideways Range
By: Frank J. Cholly, Senior Market StrategistPosted Jan 8, 2021 10:40AM CT
Once again gold futures most actively traded contract fails to break out above $1,950! I’m surprised that all the talk about additional stimulus checks going out isn’t more supportive. So now if $1,850 support fails to hold, the 200 DMA comes in at $1,852, then you should look for a test of $1,825 range. Buyers should get more aggressive in that range. I remain bullish metals. A bounce in the Dollar contributes a bit to the weakness, but I’m also aware of what’s going on in Bitcoin. It certainly looks like funds are reallocating from gold to BTC. I don’t want to get off subject here, but we must watch outside markets and right now BTC is on fire. When, not if, the Bitcoin bubble burst you’re going to see a flight to safety in gold. Bitcoin will not replace gold.
Buying the low end of this current trading range should continue to work. The new administration will continue to print money and hand out checks and devalue the Dollar. Nothing changes. Maybe only gets more aggressive, so therefore gold prices will be well supported and eventually breakout above $2,000. There’s just too much cash out there and people like things that they can touch…like gold.
Gold Feb '21 Daily Chart If you have any questions or would like to discuss the markets further, please feel free to contact me at 800-826-4124 or fcholly@rjofutures.com. Metals - Silver Market Starting to See Pressure
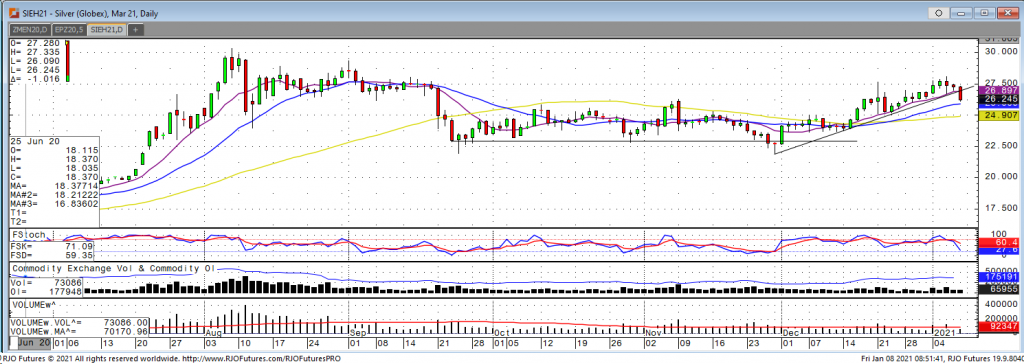
After seeing a continuation of last week’s trend higher to start the week, the silver market is starting to see some pressure with lower days on Wednesday, Thursday, and to start Friday. Wednesday’s trading session got to a high of 28.105 on the March contract before closing lower on the day. The US dollar up off its lows with looks of strengthening and the stock market shaking off the lower trade on the first day of the year is pressuring the silver market. Better than expected jobs numbers and a calming of political tensions also give the bears an edge. The bears are watching for a stimulus package to be passed and more signs of inflation to provide support. It looks like there has been a change in the short-term trend with support being broken at 26.70. Right now the bears are in control with the next levels of support being 25.25 and then 24.25. The bulls are needing to see a close up of the low today and then trade above 26.90 next week to turn the trend back to the upside.
Silver Mar '21 Daily Chart If you have any questions or would like to discuss the markets further, please feel free to contact me at 800-826-2270 or therrmann@rjofutures.com. Energy - Oil Continues Inflation Higher
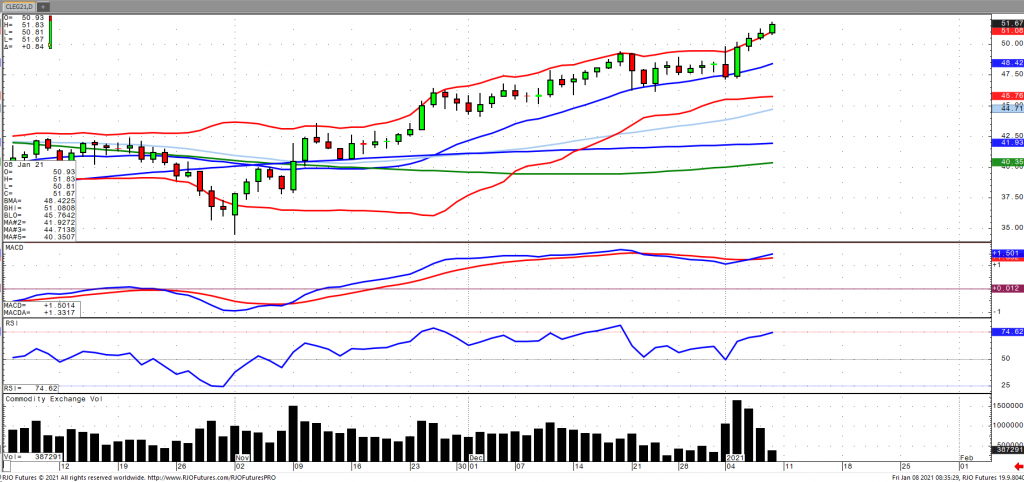
Oil Continues Inflation Higher
By: Alex Turro, Senior Market StrategistPosted Jan 8, 2021 9:00AM CT
Oil prices have continued to ramp higher taking its inflation to +42% since November and rising to its highest price since February after Saudi Arabia committed to supporting prices with voluntary production cuts earlier in the week. This includes a cut of 1 million bpd, which followed a meeting of OPEC+ with producers agreeing to steady output in February and March while allowing Russia and Kazakhstan to moderately increase output by 75k bpd for those two consecutive months. This comes amidst a much larger than expected draw of oil stocks along with a reported increase in fuel inventories, according to the EIA. This drop in stocks was supported by strong export numbers as well as refinery utilization. The market remains bullish trend but is signaling immediate term overbought with today’s range seen between 47.37 – 51.34.
Crude Oil Feb '21 Daily Chart If you have any questions or would like to discuss the markets further, please feel free to contact me at 800-438-4805 or aturro@rjofutures.com. Softs - Coffee Holding Support
Coffee Holding Support
By: Adam TuiaanaPosted 01/06/2021
March coffee futures have breached the 1.29 level, not seen since
September of 2020. This level of past consolidation is largely due to the
vaccine rollout, prompting optimism that more coffee shops and restaurants will
ultimately return, with coffee-drinking customers. However, the rollout has been
slow, with new shutdowns looming through the UK and the potential for others to
follow suit. March coffee prices
continue to hold support above the 25-day MA, with high levels of volume and
open interest.
From a technical perspective, strong support should
be held at the 50-day MA, resting at 1.17. In addition, a break above the key
resistance level of 1.29 is also very bullish, and the subsequent selloff back
to the 1.22 level should be a great opportunity for bulls to step back in.
For more frequent commentary, please check out and subscribe to my daily futures market videos on coffee and other commodities.
On
the heels of mid-Sep-to-early-Oct's steeper, accelerated, 3rd-wave-looking
recovery, the past week-and-a-half's boringly lateral chop is first considered
a corrective/consolidative event that warns of a continuation of the uptrend
that preceded it to new highs above 04-Oct's 891.0 high. This count
remains consistent with our broader base/correction/recovery count introduced
in 13-Sep's Technical Blog following that
day's bullish divergence in short-term momentum above 07-Sep's 809.5 minor
corrective high detailed in the hourly chart below.
The
important takeaway from this month's lateral, sleepy price action is the
definition of Wed's 851.5 low as
the end or lower boundary of a suspected 4th-Wave correction. A failure
below 851.5 will confirm a bearish divergence in daily momentum and defer or
threaten a bullish count enough to warrant non-bullish decisions like
long-covers. A failure below 851.5 will not
necessarily negate a broader bullish count, but it will threaten it enough to
warrant defensive measures as the next pertinent technical levels below 851.5 are
13-Sep's prospective minor 1st-Wave high at 813.8 and obviously 08-Sep's 766.0
low. And making non-bullish decisions "down there" is
sub-optimal to say the least. Per such, both short- and longer-term
commercial traders are advised to pare or neutralize bullish exposure on a
failure below 851.5, acknowledging and accepting whipsaw risk- back above 04-Oct's
891.0 high- in exchange for much deeper and sub-optimal nominal risk below
766.0.
On
a broader scale, the daily log scale chart above shows the developing potential
for a bearish divergence in daily momentum that will be considered confirmed
below 851.5. This chart also shows the past month's recovery thus far
stalling in the immediate neighborhood of the (888.0) Fibonacci
minimum 38.2% retrace of Apr-Sep's entire 1128 - 766 decline). COMBINED
with a failure below 851.5, traders
would then need to be concerned with at least a larger-degree correction pf the
past month's rally and possibly a resumption of Apr-Sep's major downtrend.
Until
and unless the market fails below 851.5 however, we would
remind longer-term players of the key elements on which our bullish count is
predicated:
a confirmed bullish divergence in WEEKLY momentum
(below)
amidst
an
historically low 11% reading in out RJO Bullish Sentiment Index and
a
textbook complete and major 5-wave Elliott sequence down from 29-Apr's
1128 high to 08-Sep's 766.0 low.
Thus
far, the market is only a month into correcting a 4-MONTH, 32% drawdown, so
further and possibly protracted gains remain well within the bounds of a major
(suspected 2nd-Wave) correction of Apr-Sep's decline within an even more
massive PEAK/reversal process from 17-May's 1219 high on an active continuation
basis below.
These
issues considered, a bullish policy and exposure remain advised with a failure
below 851.5 required to defer or threaten this call enough to warrant moving to
a neutral/sideline position. In lieu of such weakness, we anticipate a
continuation of the past month's rally to new highs and potentially significant
gains above 891.0.
Agricultural - Grain Futures Update w/Stephen Davis - 01/08/2021
Grain Futures Update w/Stephen Davis - 01/08/2021
By: Stephen DavisPosted 01/08/2021
Stephen Davis discusses the latest news moving the grain markets this morning. China is looking to keep purchasing U.S. corn along with purchasing U.S. soy.Currency - USD Should Continue to Bounce, but No Trend Reversal Yet
USD Should Continue to Bounce, but No Trend Reversal Yet
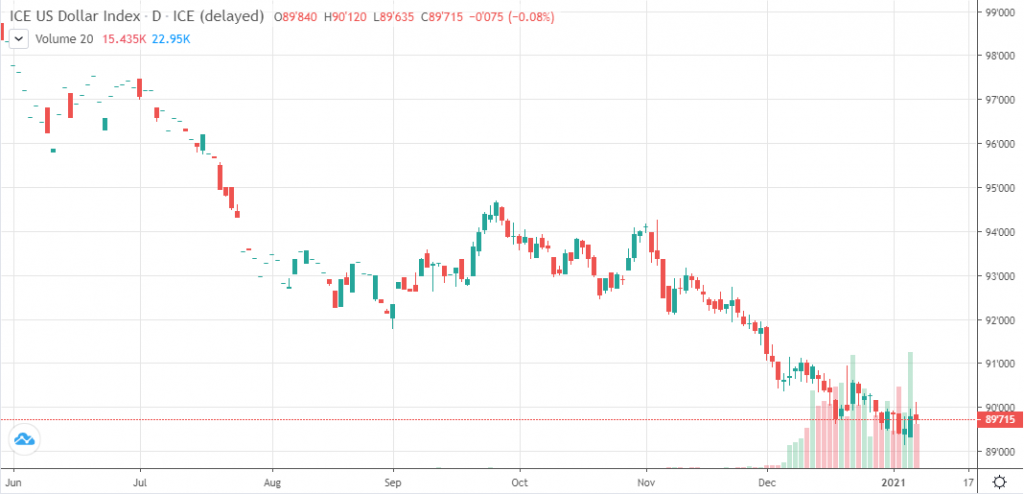
By: Tony Cholly, Senior Market StrategistPosted Jan 8, 2021 8:56AM CT
The USD has found a way to make another higher high for the move early today and this suggests we may see even more short covering ahead. However, we would not discount the potential for a flare higher off jobs data and potentially from the elevation of daily infections in the headlines. Apparently disgust and embarrassment of the US system is not a deterrent to strength in the USD, with the index apparently retaining some measure of flight to quality interest. In the end, we do not expect the downtrend to end and suggest a rally today could be a potential short entry point for more aggressive traders. Technically speaking, stochastics are rising from oversold levels, which is bullish and should support the market moving higher. Resistance is around 9007 and support hits today at 8945.
If you have any questions or would like to discuss the markets further, please feel free to contact me at 800-826-2270 or tcholly@rjofutures.com. Interest Rates - Interest Rates Up as it Looks Like Democrats Will Gain Control of Senate
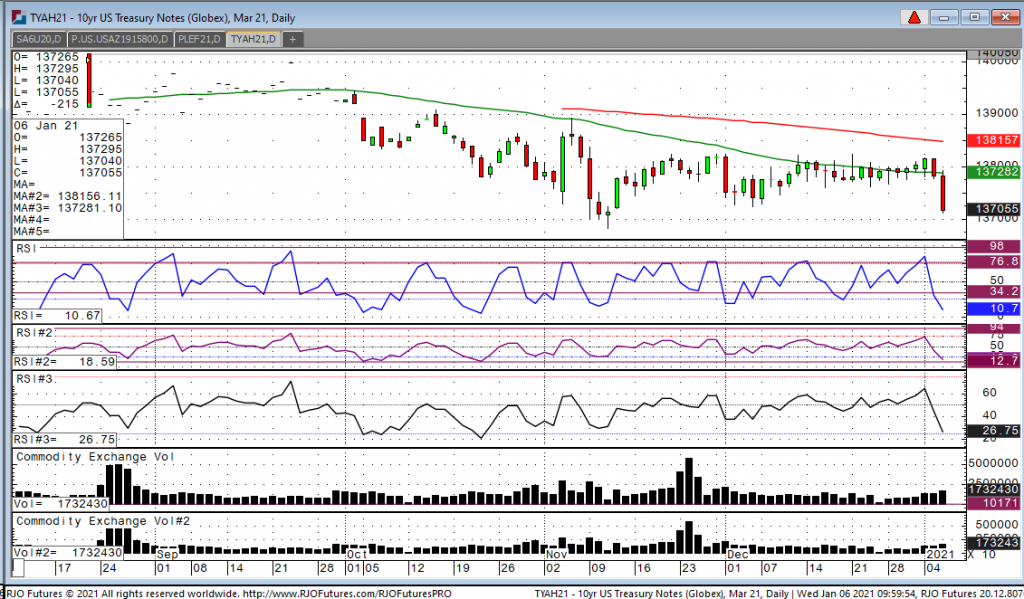
Interest Rates Up as it Looks Like Democrats Will Gain Control of Senate
Big news overnight in the treasury complex overnight as the 10-year breached 1% on a yield basis. This is significant as it’s the first time we have been at these levels since early 2020 when the pandemic started. There are a few reasons we are at these levels as investors believe once President Biden is sworn in we will see a major stimulus package before the end of the month which will put money in people’s pocket and hopefully increase consumer spending which should help in all aspects of the recovery. Another reason we are seeing a big jump in yields this morning is the because of the runoff elections in Georgia. It looks as if the Democrats will oversee all aspects of the government. As the Dems control taxes will most likely increase across the board which will result in higher inflation. Economic numbers this week will also be on trader’s minds as this morning we saw the ADP come in much lower than expected with a negative reading of 123k. The job outlook currently looks grim. Later this afternoon we will get the FOMC minutes which is a report that reviews economic and financial conditions in all four regions of the US. On Friday, we see the US monthly employment numbers which is expected to come in at 100K.
10-yr Note Mar '21 Daily Chart If you have any questions or would like to discuss the markets further, please feel free to contact me at 800-826-2270 or gperlin@rjofutures.com. Equity - Jobs Number Misses
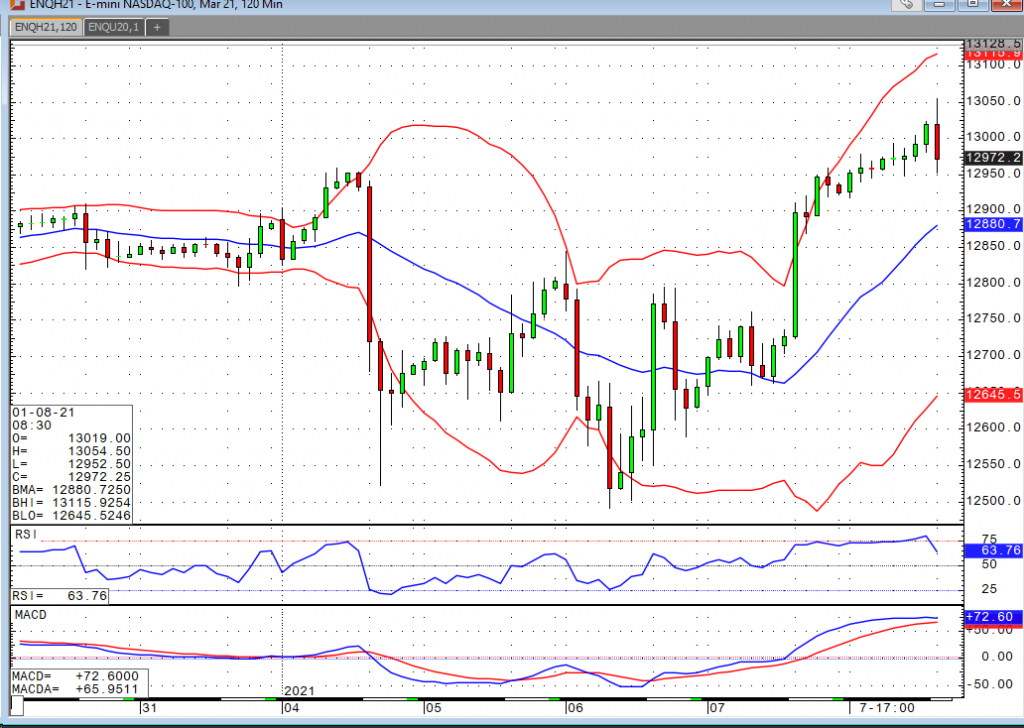
Jobs Number Misses
By: Bill Dixon, Senior Market StrategistPosted Jan 8, 2021 9:43AM CT
Today’s jobs data was expecting to see another 50k jobs added. Unfortunately, the number came out as having lost 140k jobs. The market initially reacted negatively to the news, but quickly recouped the losses. The Nasdaq has even printed a new, all-time high. Very little seems to be able to shake this market for more than a day or so. New record in positive coronavirus tests? Meh. We’ve got multiple vaccines. Political unrest/violence? Who cares? Not to mention businesses closing at an incredible rate, tax hikes a near certainty, etc. This market is on, and has been on, a tear. I’ve listed plenty of reasons (there are plenty that went unmentioned) for investors to be concerned, but the market seems to believe they too shall pass. Each and every dip is getting bought, and those participants continue to get paid. Until that stops working, why change it up?
E-mini S&P 500 Mar '21 Daily Chart If you have any questions or would like to discuss the markets further, please feel free to contact me at 800-669-5354 or bdixon@rjofutures.com. Economy - S-T Mo Failure Insufficient to End RBOB Correction, But Beware
S-T Mo Failure Insufficient to End RBOB Correction, But Beware
By: RJO Market InsightsPosted 11/08/2022
Posted on Nov 08, 2022, 07:51 by Dave Toth
In Fri's Technical Webcast we identified a
minor corrective low at 2.6328 from Thur as a mini risk parameter the market
needed to sustain gains above to maintain a more immediate bullish count.
The 240-min chart below shows the market's failure overnight below this level,
confirming a bearish divergence in very short-term momentum. This mo
failure defines Fri's 2.8172 high as
one of developing importance and a parameter from which very short-term traders
can objectively base non-bullish decisions like long-covers.
Given
the magnitude of the past three weeks' broader recovery however, this
short-term momentum failure is of an insufficient scale to conclude anything
more than another correction within this broader recovery from 26-Sep's 2.1877
low. Indeed, overnights failure below 2.6328 only allows us to conclude
the end of the portion of the month-and-a-half rally from 31-Oct's 2.4822 next
larger-degree corrective low. 2.4822 is the
risk parameter this market still needs to fail below to break the uptrend from
18-Oct's 2.3526 low while this 2.3526 low
remains intact as the risk parameter this market needs to fail below to break
the month-and-a-half uptrend. From an
intermediate-to-longer-term perspective, this week's setback falls well within
the bounds of another correction ahead of further gains. This is another
excellent example of the importance of technical and trading SCALE and
understanding and matching directional risk exposure to one's personal risk
profile.
The
reason overnight's admittedly minor mo failure might have longer-term
importance is the 2.8172-area from which it stemmed. In
Fri's Technical Blog we also noted the market's engagement of the
2.8076-to-2.8159-area marked by the 61.8% retrace of Jun0-Sewp's 3.2758 -2.1877
decline and the 1.000 progression of Sep-Oct's initial 2.1877 - 2.6185
(suspected a-Wave) rally from 18-Oct's 2.3526 (suspected b-Wave) low. We
remind longer-term players that because of the unique and compelling confluence
of:
early-Aug's bearish divergence in WEEKLY momentum
amidst
historically
extreme bullish sentiment/contrary opinion levels in our RJO Bullish
Sentiment Index
an
arguably complete and massive 5-wave Elliott sequence from Mar'20's 0.4605
low to Jun's 4.3260 high (as labeled in the weekly log active-continuation
chart below) and
the
5-wave impulsive sub-division of Jun-Sep's (suspected initial 1st-Wave) decline
The
recovery attempt from 26-Sep's 2.1877 low is arguably only a 3-wave (Wave-2)
corrective rebuttal to Jun-Sep's decline within a massive, multi-quarter
PEAK/reversal process. Now granted, due to the magnitude of 2020 -2022's
secular bull market, we discussed the prospect for this (2nd-Wave corrective)
recovery to be "extensive" in terms of both price and time. A
"more extensive" correction is typified by a retracement of 61.8% or
more and spanning weeks or even months following a 3-month decline. Per
such, the (suspected corrective) recovery from 26-Sep's 2.1877 low could easily
have further to go, with commensurately larger-degree weakness than that
exhibited this week (i.e., a failure below at least 2.4822) required
to consider the correction complete. Indeed, the daily log chart above
shows the market thus far respecting former 2.6185-area resistance from 10-Oct
as a new support candidate.
These
issues considered, very shorter-term traders have been advised to move to a neutral/sideline
position following overnight's momentum failure below 2.6328, with a recovery
above 2.8172 required to negate this call, reaffirm the recovery and re-expose
potentially significant gains thereafter. For intermediate- and
longer-term players, a bullish policy and exposure remain advised with a
failure below 2.4822 required to threaten this call enough to warrant
neutralizing exposure. We will be watchful for another bearish divergence
in momentum following a recovery attempt that falls short of Fri's 2.8172 high
that would be considered the next reinforcing factor to a count calling that
2.8172 high the prospective end to the month-and-a-half 2nd-Wave
correction. In lieu of such, a resumption of the current rally to
eventual new highs above 2.8172 should not surprise.
Economy - Futures Market Outlook w/John Caruso - 01/08/2021
Futures Market Outlook w/John Caruso - 01/08/2021
By: John Caruso, Senior Market StrategistPosted Jan 8, 2021 8:50AM CT
“Remember when I asked for your opinion? Yeah me neither.” –
The stock market to every political narrative
Good morning,
The rundown:
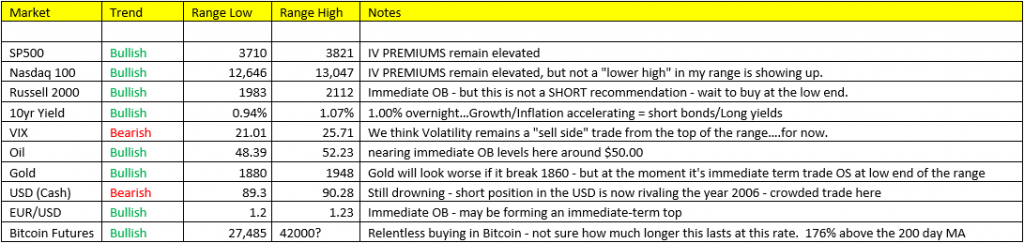
Stocks: that’s right, fresh All-time high’s yesterday, and of course “all-time is a long time”. Stocks don’t care about hooligans storming the capitol, just like they didn’t care when our major cities were being torched by ingrates this summer. Hello! McFly…It’s the cycle! It's always about the cycle! Growth accelerating/inflation accelerating through the first half of 2021 as y/y comps of macro data and corporate earnings and profits may perhaps express the greatest rate of change acceleration since post WW2 – Scenario 2 in the model remains our call until further notice. On that note, stocks are now immediate OB within our range analysis – scale some back.
Yields: the 10yr yield is up again overnight to 1.09% ahead of the US Unemployment report due out at 7:30am CST. Perhaps the most significant development this week was surpassing the 1.00% level in 10yr yields as growth and inflation is set to continue their acceleration through Q1/Q2 2021. We’re trade immediate OS this morning in the 30yr and 10yrs, trim some, so we can replant (get bigger) when yields move back to the low end of our range.
US Dollar: No coincidence that the dollar has ceased its decline this week as yields pressed through 1.00%. But recognize that this trade isn’t likely to get too far on the upside in the near-term. We do believe the Dollar has entered a secular bear market that may last for many years to come. We’re still sellers of USD AT the top end of our range within the longer bear market cycle. BONUS: gold and silver got hit overnight. Gold is now at the low end of the range, remains bullish trend, but not one of our favorite places to be at the moment in a rising yields environment. Remember up yields = up dollar = down gold, and this is precisely the action we’re seeing today. Ultimately we expect gold to remain range bound for the near-term.
If you have any questions or would like to discuss the markets further, please feel free to contact me at 800-669-5354 or jcaruso@rjofutures.com.