New Special Report: Inflation, How Much is Too Much?
With so much money in the market, coupled with weakened supply chains and workforces due to the fallout of Covid-19, we are seeing a rampant run on inflation. Prices from everything to lumber, oil, and groceries are up. Learn why this is happening, how long it will go on for, and how to protect yourself with this Special Report!
The Markets
Metals - Gold Resistance - New Support
Gold Resistance - New Support
By: Frank J. Cholly, Senior Market StrategistPosted Jan 21, 2022 9:02AM CT
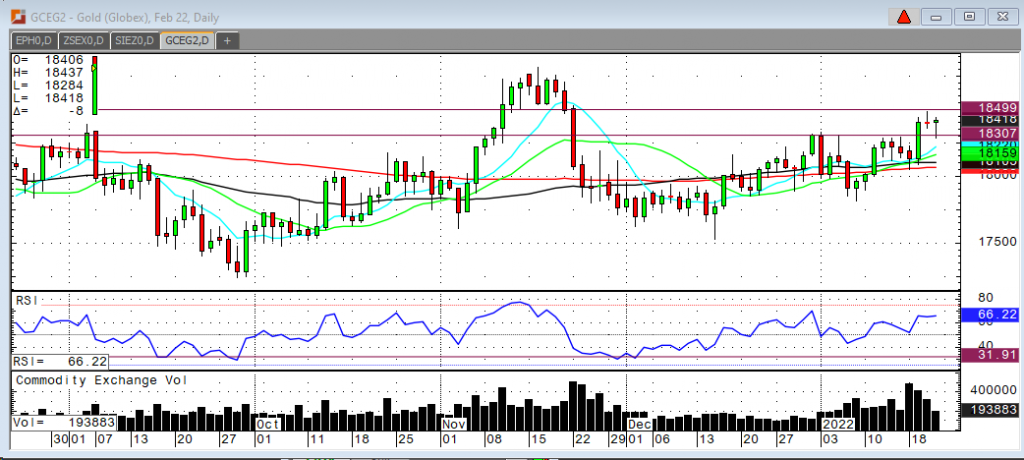
Now that gold has managed two consecutive closes at roughly
$1,840, we can look at $1,830 as a good support level. A minor dip or
correction must hold above $1,830 on a closing basis for this rally to
continue. It’s no coincidence that gold has had a very strong rally while
stocks have had a really bad week. Gold has been unable to find its legs
recently, despite all this inflation. I caution you to closely monitor
“outside” markets. If we continue to see weakness in stocks, we should continue
to see strength in precious metals. The money has to go somewhere! Gold prices
must be able to penetrate $1,850 and hold several closes above $1,850 before I
get more confident about this rally. I think a bottom is in, but I’m not
convinced that gold doesn’t move back to that sideways range.
Silver may assume a leadership role in this precious metal rally, as silver is in my opinion, severely undervalued. Even more so than gold. All precious metals are undervalued.
Gold Feb '22 Daily Chart If you have any questions or would like to discuss the markets further, please feel free to contact me at 800-826-4124 or fcholly@rjofutures.com. Energy - Oil Prices Coming Off Seven Year High
Oil Prices Coming Off Seven Year High
By: Alex Turro, Senior Market StrategistPosted Jan 21, 2022 9:49AM CT
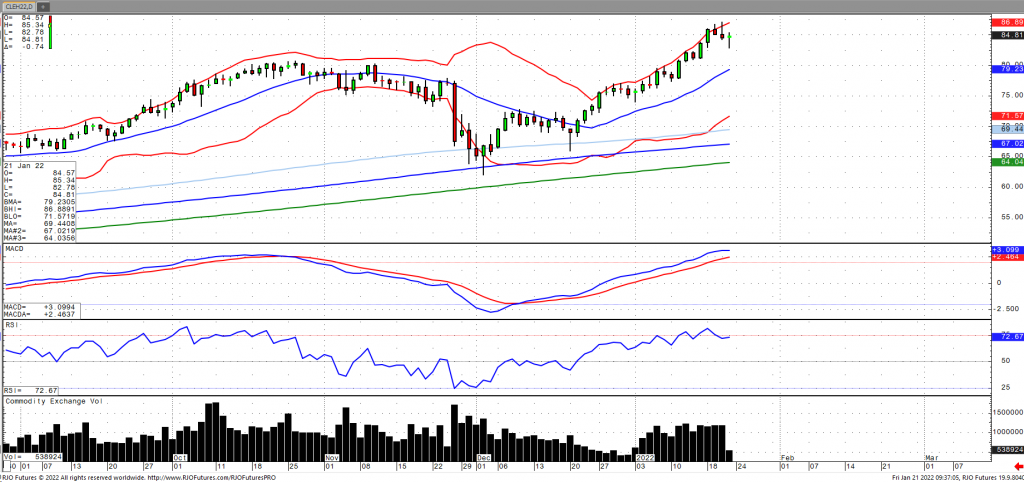
Oil prices are coming off seven-year highs following some profit taking as short-term supply disruptions have continued to underpin prices. On Tuesday, a fire temporary stopped flows through a pipeline in Iraq’s Kirkuk. In addition, an attack on Yemen’s Houthis on the UAE heightened geopolitical risks. The market was also supported by reports that OPEC+ fell 800k barrels per day below its December target. The IEA upgraded their demand forecast for 2022 while noting that the oil market could be in a surplus for the first quarter. Oil inventories rose 515k barrels for the first time in eight weeks with stocks now down 72.75 million barrels below year ago levels and 38.10 million barrels below the five-year average. Oil volatility (ovx) has rebounded into the upper mid-upper 40s with the market remaining bullish trend with today’s range seen between 77.03 – 87.24.
Crude Oil Mar '22 Daily Chart If you have any questions or would like to discuss the markets further, please feel free to contact me at 800-438-4805 or aturro@rjofutures.com. Agricultural - Bullish Canola Count Intact Above Minimum 851.5
Bullish Canola Count Intact Above Minimum 851.5
By: RJO Market InsightsPosted 10/14/2022
Posted on Oct 14, 2022, 07:42 by Dave Toth
On
the heels of mid-Sep-to-early-Oct's steeper, accelerated, 3rd-wave-looking
recovery, the past week-and-a-half's boringly lateral chop is first considered
a corrective/consolidative event that warns of a continuation of the uptrend
that preceded it to new highs above 04-Oct's 891.0 high. This count
remains consistent with our broader base/correction/recovery count introduced
in 13-Sep's Technical Blog following that
day's bullish divergence in short-term momentum above 07-Sep's 809.5 minor
corrective high detailed in the hourly chart below.
The
important takeaway from this month's lateral, sleepy price action is the
definition of Wed's 851.5 low as
the end or lower boundary of a suspected 4th-Wave correction. A failure
below 851.5 will confirm a bearish divergence in daily momentum and defer or
threaten a bullish count enough to warrant non-bullish decisions like
long-covers. A failure below 851.5 will not
necessarily negate a broader bullish count, but it will threaten it enough to
warrant defensive measures as the next pertinent technical levels below 851.5 are
13-Sep's prospective minor 1st-Wave high at 813.8 and obviously 08-Sep's 766.0
low. And making non-bullish decisions "down there" is
sub-optimal to say the least. Per such, both short- and longer-term
commercial traders are advised to pare or neutralize bullish exposure on a
failure below 851.5, acknowledging and accepting whipsaw risk- back above 04-Oct's
891.0 high- in exchange for much deeper and sub-optimal nominal risk below
766.0.
On
a broader scale, the daily log scale chart above shows the developing potential
for a bearish divergence in daily momentum that will be considered confirmed
below 851.5. This chart also shows the past month's recovery thus far
stalling in the immediate neighborhood of the (888.0) Fibonacci
minimum 38.2% retrace of Apr-Sep's entire 1128 - 766 decline). COMBINED
with a failure below 851.5, traders
would then need to be concerned with at least a larger-degree correction pf the
past month's rally and possibly a resumption of Apr-Sep's major downtrend.
Until
and unless the market fails below 851.5 however, we would
remind longer-term players of the key elements on which our bullish count is
predicated:
a confirmed bullish divergence in WEEKLY momentum
(below)
amidst
an
historically low 11% reading in out RJO Bullish Sentiment Index and
a
textbook complete and major 5-wave Elliott sequence down from 29-Apr's
1128 high to 08-Sep's 766.0 low.
Thus
far, the market is only a month into correcting a 4-MONTH, 32% drawdown, so
further and possibly protracted gains remain well within the bounds of a major
(suspected 2nd-Wave) correction of Apr-Sep's decline within an even more
massive PEAK/reversal process from 17-May's 1219 high on an active continuation
basis below.
These
issues considered, a bullish policy and exposure remain advised with a failure
below 851.5 required to defer or threaten this call enough to warrant moving to
a neutral/sideline position. In lieu of such weakness, we anticipate a
continuation of the past month's rally to new highs and potentially significant
gains above 891.0.
Agricultural - Grains - Let the Chart Do the Talking
Grains - Let the Chart Do the Talking
By: Michael Sabo, Senior Market StrategistPosted Jan 21, 2022 11:12AM CT
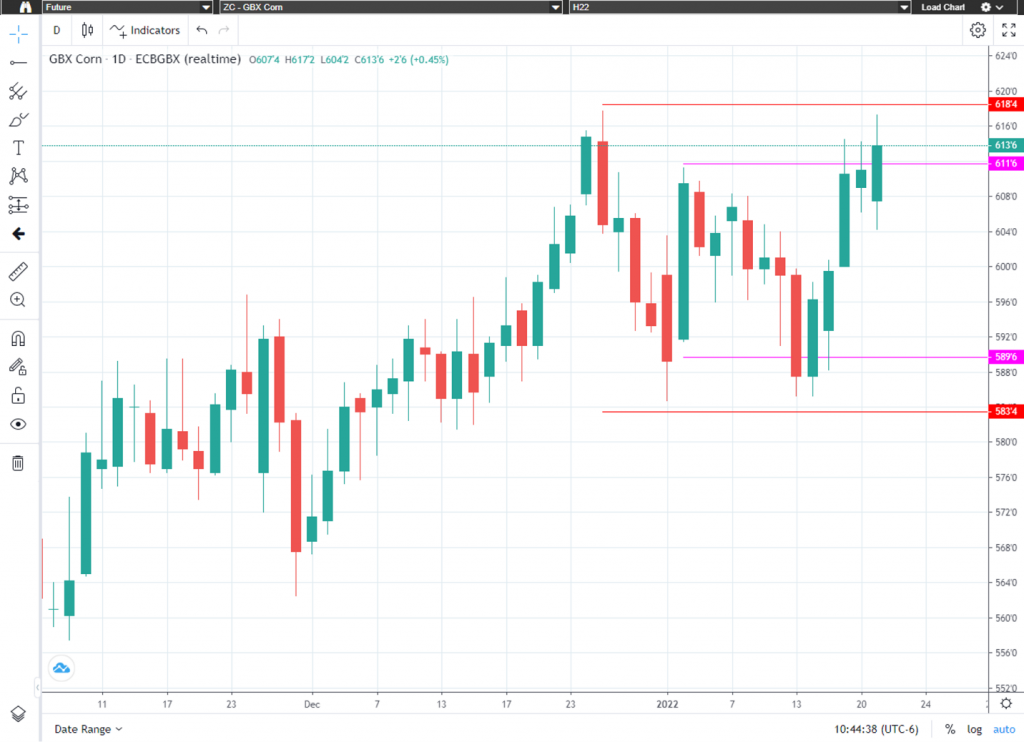
On January 7th I
advised traders on the following “Today I would advise traders to watch for
another breakout” “I believe short term aggressive levels are $6.11 ¾ on
the upside and $5.89 ¾ on the downside and the medium term breakout levels are $6.18
½ upside and $5.83 ½ on the downside.” Let’s
take a look at what has happened since last Friday (see both charts below). As
you can see the medium-term downside breakout level held at $5.83 ½ with lows
coming in at $5.85 ¼ before seeing moves this week to a high of $6.17 ¼ which
was reached today after seeing a small inside day yesterday. With the break
higher today the market has triggered a short-term buy (for aggressive traders)
in my playbook. As I said last week, I still remain bullish and traders should
watch the medium term breakout levels for market direction.
The “big picture” numbers remain the
same and probably will for some time. I firmly believe a break below $4.96 could
give the bears control of the market and a break above $6.39 ½ on the upside may
have enough bulls behind it to propel corn to all-time highs. There are several
minor areas of support and resistance inside this range that can help with
short-term market direction if violated. Call me directly at 1-800-367-7290 for
more in-depth discussion on these numbers and to discuss trading strategies
specific to your situation.
I would suggest using an option
strategy to manage your futures position risk or an outright option strategy.
Implied option volatility has come down quite a bit from its most recent highs
mainly due to the consolidation and tighter trading ranges. I have 25-years of grain
market experience, feel free to call or email with any questions you may have. Be sure to check out my archived weekly grain
market insight articles posted on our website.
**** Request
your FREE 2022 Commodity Trading Guide Today! ****
This 55-page guide is packed with indispensable market information. It has a complete commodity calendar that lists the dates and times of Market Reports, option expiration dates, futures first notice dates, futures last trade dates, etc. It readily serves as your commodity market encyclopedia giving you an in depth look at each commodity, there is market almanac for all actively traded commodities and much more! To reserve your complimentary Commodity Trading Guide, send me an email at msabo@rjofutures.com with the following information: your full name, mailing address and a preferred phone number so we can confirm your request. Once confirmed, I will reserve your trading guide, and have it sent out as soon as we receive them.
Corn Jan '22 Daily Chart If you have any questions or would like to discuss the markets further, please feel free to contact me at 800-367-7290 or msabo@rjofutures.com. Interest Rates - Investors Calling for Interest Rate Hikes
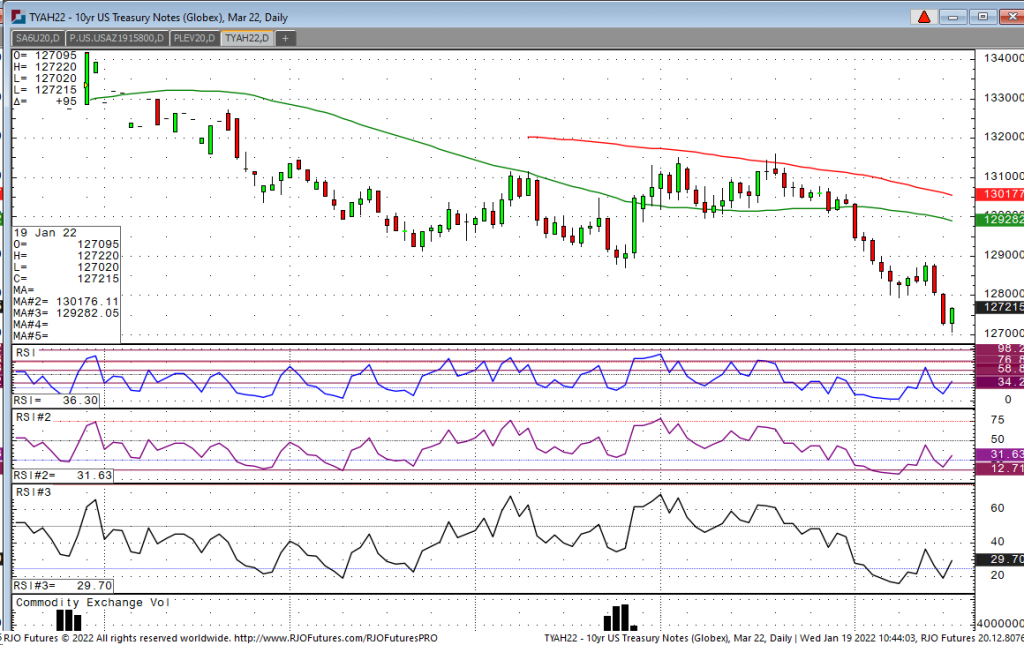
We have seen a wild ride the last few weeks in the March 10-year note, with yields rising to a two-year high overnight to 1.90%. The rise is largely driven by continued strong readings from the CPI, strength in oil, and hawkish comments out of many of the Fed governors. Additionally, many of the Fed speakers are now nervous that the Fed is behind the curve and some are calling for four rated hikes in 2022. That is an aggressive call and I’m not sure that will come to fruition, but I do believe we see at least two hikes. So, going forward, as hikes are now being priced in and we have seen yields in the 10’s spike from around 1.65-1.90%, where do we go from here? I believe the market still has room to go lower and yields gravitate toward the psychological level of 2%, but currently the market is oversold, and I believe the market is quite short, so a short covering rally is certainly possible. Another important development that is starting to gain momentum is the build up in troops by Russia near Ukraine. I am certainly not suggesting that Russia will invade but the fact that there is a significant build up in troops near the border could bring a safe haven bid into treasuries at any time.
10-Year Note Mar '22 Daily Chart If you have any questions or would like to discuss the markets further, please feel free to contact me at 800-826-2270 or gperlin@rjofutures.com. Equity - Navigating S&P Correction-vs-Reversal Challenge
Navigating S&P Correction-vs-Reversal Challenge
By: RJO Market InsightsPosted 01/20/2022
In
our constant pursuit of objectively managing risk of directional biases and
exposure, we're always on the lookout for momentum failures needed to stem
trends. Following early-Jan's continuation of the secular bull trend, we
were able to identify risk levels the bull needed to sustain gains above to
maintain a bullish count. In 06-Jan's Technical Blog we introduced a
peak/correction/reversal threat directly on the heels of 05-Jan's bearish
divergence in very short-term momentum. This mo failure defined
04-Jan's 4808.25 high as one of developing importance from which non-bullish
decisions could be objectively based and managed.
More
than two weeks on and following Tue's break below 10-Jan's 4572 initial
counter-trend low, those early and minor threats to the bull have reached at
least intermediate-term levels as the market has lost 6%. Now, "down
here", we're on the lookout for elements needed to defer or threaten a
broader peak/reversal process and give odds to the ultimately bullish prospect
that this month's 6% decline is a 3-wave and thus corrective affair that might
re-expose the secular bull trend.
The
240-min chart below shows that, thus far at least, the decline from
04-Jan's 4808.25 high to yesterday's 4514 low is only a 3-wave
structure as labeled. But while a recovery above 12-Jan's 4740
corrective high remains required to CONFIRM such a bullish count, this chart
also shows the developing potential for a bullish divergence in very short-term
momentum. This divergence will be considered CONFIRMED to the point of
non-bearish action by short-term traders on a recovery above yesterday's 4603
corrective high. Per such, this 4603 level is
considered a mini risk parameter, the recovery above which will define
yesterday's 4514 low as one of developing importance and a new mini risk parameter
from which the risk of non-bearish decisions can be objectively based and
managed.
Can we conclude the end of the correction by such piddly strength above 4603? No, no more than we could conclude a massive reversal lower by 05-Jan's piddly failure below 4747. But such 4603+ strength could be pursued as a start of a recovery that would then require further, sustained, trendy, impulsive gains above 12-Jan's next larger-degree corrective high at 4740 needed to resurrect odds of the secular bull trend's resumption. But most importantly, 4603+ strength would identify some semblance of early strength and bull potential from that 4514 low that would then serve as the objective risk parameter to any bullish decisions.
On
a broader scale and until the market recovers above at least 4603 and
preferably 4740, a broader peak/correction/reversal threat remains intact ahead of
what could be protracted losses. Waning upside momentum since early-Nov
and historically frothy levels in the Bullish Consensus (marketvane.net)
measure of market sentiment/contrary opinion remain intact as threats against
the major bull market.
Interestingly
however, the American Association of Individual Investors (AAII) Bullish
Sentiment Survey and Bull-Bear Differential have both eroded to historical lows
that, in the past, have been associated with the ENDS of corrections and starts
of the resumptions of the secular bull trend. This factor will become
increasingly important in support of a resumed long-term bull trend upon proof
of strength in the contract above at least 4603 and especially
above 4740. Until the market arrests the clear and present and at least
intermediate-term downtrend with strength above levels like these, it would be
premature to conclude the end of a correction or reversal lower.
These issues considered, a bearish policy and exposure remain advised with a recovery above at least 4603 and preferably 4740 before a bullish policy can be reconstructed. In lieu of such strength and especially if this market breaks yesterday's 4514 low, further and possibly steep losses remain expected.
Economy - S-T Mo Failure Insufficient to End RBOB Correction, But Beware
S-T Mo Failure Insufficient to End RBOB Correction, But Beware
By: RJO Market InsightsPosted 11/08/2022
Posted on Nov 08, 2022, 07:51 by Dave Toth
In Fri's Technical Webcast we identified a
minor corrective low at 2.6328 from Thur as a mini risk parameter the market
needed to sustain gains above to maintain a more immediate bullish count.
The 240-min chart below shows the market's failure overnight below this level,
confirming a bearish divergence in very short-term momentum. This mo
failure defines Fri's 2.8172 high as
one of developing importance and a parameter from which very short-term traders
can objectively base non-bullish decisions like long-covers.
Given
the magnitude of the past three weeks' broader recovery however, this
short-term momentum failure is of an insufficient scale to conclude anything
more than another correction within this broader recovery from 26-Sep's 2.1877
low. Indeed, overnights failure below 2.6328 only allows us to conclude
the end of the portion of the month-and-a-half rally from 31-Oct's 2.4822 next
larger-degree corrective low. 2.4822 is the
risk parameter this market still needs to fail below to break the uptrend from
18-Oct's 2.3526 low while this 2.3526 low
remains intact as the risk parameter this market needs to fail below to break
the month-and-a-half uptrend. From an
intermediate-to-longer-term perspective, this week's setback falls well within
the bounds of another correction ahead of further gains. This is another
excellent example of the importance of technical and trading SCALE and
understanding and matching directional risk exposure to one's personal risk
profile.
The
reason overnight's admittedly minor mo failure might have longer-term
importance is the 2.8172-area from which it stemmed. In
Fri's Technical Blog we also noted the market's engagement of the
2.8076-to-2.8159-area marked by the 61.8% retrace of Jun0-Sewp's 3.2758 -2.1877
decline and the 1.000 progression of Sep-Oct's initial 2.1877 - 2.6185
(suspected a-Wave) rally from 18-Oct's 2.3526 (suspected b-Wave) low. We
remind longer-term players that because of the unique and compelling confluence
of:
early-Aug's bearish divergence in WEEKLY momentum
amidst
historically
extreme bullish sentiment/contrary opinion levels in our RJO Bullish
Sentiment Index
an
arguably complete and massive 5-wave Elliott sequence from Mar'20's 0.4605
low to Jun's 4.3260 high (as labeled in the weekly log active-continuation
chart below) and
the
5-wave impulsive sub-division of Jun-Sep's (suspected initial 1st-Wave) decline
The
recovery attempt from 26-Sep's 2.1877 low is arguably only a 3-wave (Wave-2)
corrective rebuttal to Jun-Sep's decline within a massive, multi-quarter
PEAK/reversal process. Now granted, due to the magnitude of 2020 -2022's
secular bull market, we discussed the prospect for this (2nd-Wave corrective)
recovery to be "extensive" in terms of both price and time. A
"more extensive" correction is typified by a retracement of 61.8% or
more and spanning weeks or even months following a 3-month decline. Per
such, the (suspected corrective) recovery from 26-Sep's 2.1877 low could easily
have further to go, with commensurately larger-degree weakness than that
exhibited this week (i.e., a failure below at least 2.4822) required
to consider the correction complete. Indeed, the daily log chart above
shows the market thus far respecting former 2.6185-area resistance from 10-Oct
as a new support candidate.
These
issues considered, very shorter-term traders have been advised to move to a neutral/sideline
position following overnight's momentum failure below 2.6328, with a recovery
above 2.8172 required to negate this call, reaffirm the recovery and re-expose
potentially significant gains thereafter. For intermediate- and
longer-term players, a bullish policy and exposure remain advised with a
failure below 2.4822 required to threaten this call enough to warrant
neutralizing exposure. We will be watchful for another bearish divergence
in momentum following a recovery attempt that falls short of Fri's 2.8172 high
that would be considered the next reinforcing factor to a count calling that
2.8172 high the prospective end to the month-and-a-half 2nd-Wave
correction. In lieu of such, a resumption of the current rally to
eventual new highs above 2.8172 should not surprise.
By: John Caruso, Senior Market StrategistPosted Jan 21, 2022 8:59AM CT
The next move is likely “up”, and perhaps very aggressively. Let me get that out of the way first, but do not let that fool you. We have a real problem. The problem lies within the Fed and them not taking action sooner, and now find themselves in a state of impotence. With CPI at 7% and oil and gas prices on a steep incline, the Fed has no choice but to follow through with the full taper and at least 1 rate hike. The caveat here with regards to rate hikes effectively staving off higher oil and gas prices is …. *drumroll* …. war with Russia. Our president on Wednesday essentially “Greenlighted” a Russian incursion….don’t believe me, rollback the tape. Sec. Blinken meets in Geneva with Russia, at which Russia will make demands, we won’t comply and we could be on the brink of a major conflict because of it. The Fed will stay their course until interest rates once again collapse, and if you’re not buying that, I don’t care - this is how it happens - the bond market knows, and it’s of our assessment the short end of the curve has or is very close to fully pricing in current Fed policy . So by the time the Fed lifts off with its first rate hike in March, I fully expect yields to be moving backwards by then. That’s it, that’s the real.
Yesterday we saw our 3rd weekly increase in US
Jobless Claims, so we’ll be keeping a watchful eye on the Jan employment data
come early Feb. – and so will the Fed.
Next Wed: FOMC Policy Meeting
That’s all I’ve got today, we’ve given adequate warnings of Scenario 4 enough – now it’s playing out – Commodities are likely the next shoe to drop.
If you have any questions or would like to discuss the markets further, please feel free to contact me at 800-669-5354 or jcaruso@rjofutures.com.