New Special Report: Inflation, How Much is Too Much?
With so much money in the market, coupled with weakened supply chains and workforces due to the fallout of Covid-19, we are seeing a rampant run on inflation. Prices from everything to lumber, oil, and groceries are up. Learn why this is happening, how long it will go on for, and how to protect yourself with this Special Report!
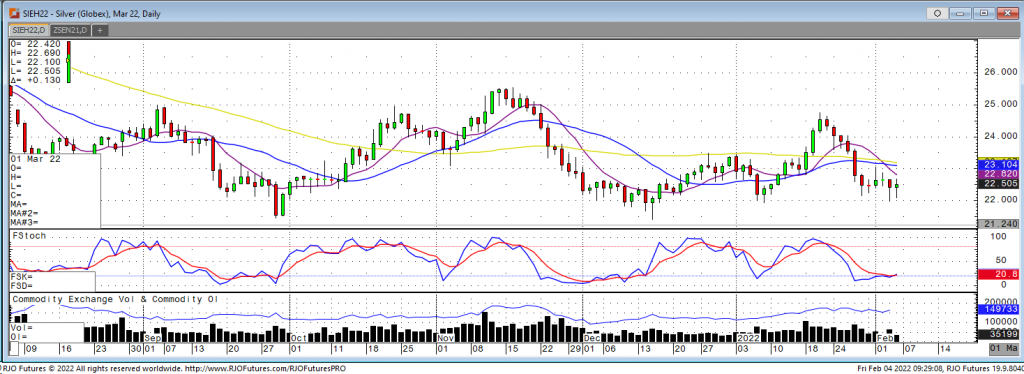
Overall sideways trade this week for silver despite a promising push higher on Tuesday to 23.06 that it was not able to hold onto. Yesterday, we saw any weekly gains get erased with trade falling to a weekly low of 21.985. To start the last day of this trading week we are green with the market looking to close out on a positive note. Global equity markets were mixed this week and a weaker U.S. dollar is providing some support to silver and the rest of the metal’s markets. Despite all the inflation talk and hype building around silver and the other metals, the silver market hasn’t managed to do much, staying in a range of 22-25.50 for the most part looking back to Aug 21. The bullish side is looking for a move higher through resistance at 23 and 23.50 in order to see a continued breakout higher. The bear side would like to see weaker trade settle down to support at 22 before breaking that and pushing down to a new recent low. The 22 level has been a good base of support with most trading below that level being pretty short lived. At this time more fundamental drivers are needed to start a longer term trend higher and see silver back in the high 20s.
Silver Mar '22 Daily Chart If you have any questions or would like to discuss the markets further, please feel free to contact me at 800-826-2270 or therrmann@rjofutures.com. Energy - Oil Prices at Seven-Year High
Oil Prices at Seven-Year High
By: Alex Turro, Senior Market StrategistPosted Feb 4, 2022 9:43AM CT
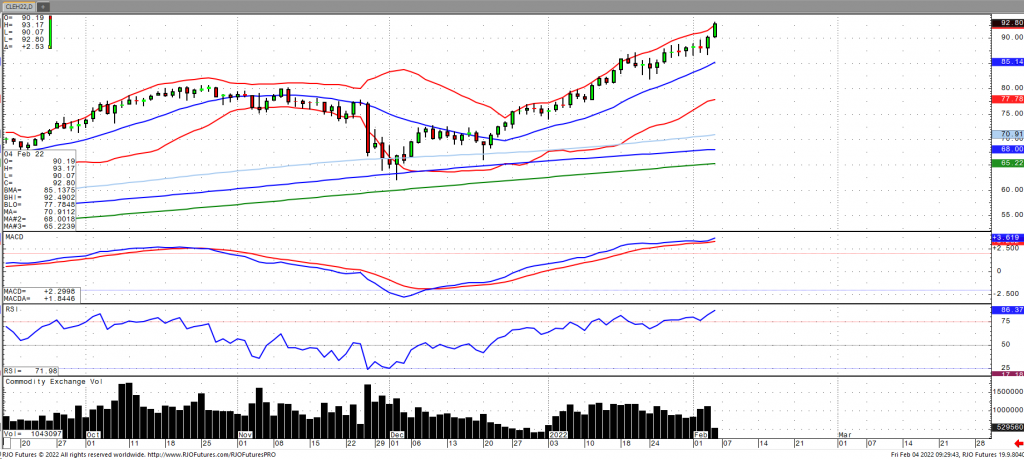
Oil prices have continued their relentless march higher, surpassing a seven-year high and topping $90 a barrel for the first time since 2014. This comes as demand for petroleum products continues to outstrip supply. OPEC+, as largely expected, are going to continue with their gradual increase in supply of 400k barrels per day in March, while reports have shown that Iraq, the second largest oil producer, pumped far less than it’s January quota. Tensions continue to persist in Eastern Europe as the potential for Russian supply disruptions remain, while domestically, the recent winter storm in Texas has temporarily slowed US production and distribution in the Permian basin. Crude stocks fell -1.047 million barrels with the deficit remaining at -60.516 million barrels and the five-year average widening to -42.201 million barrels, according to the EIA. Strategic petroleum reserves (SPR) fell -1.19 million barrels to 588.91 million barrels, reaching the lowest since 2002. Oil volatility (ovx) continues to remain relatively elevated in the low 40s with the market remaining bullish trend with today’s range seem between 83.17 – 91.79.
Crude Oil Mar '22 Daily Chart If you have any questions or would like to discuss the markets further, please feel free to contact me at 800-438-4805 or aturro@rjofutures.com. Softs - Coffee Still Consolidating, But Drawdown in Stocks is Bullish
Coffee Still Consolidating, But Drawdown in Stocks is Bullish
By: Tony Cholly, Senior Market StrategistPosted Feb 2, 2022 9:24AM CT
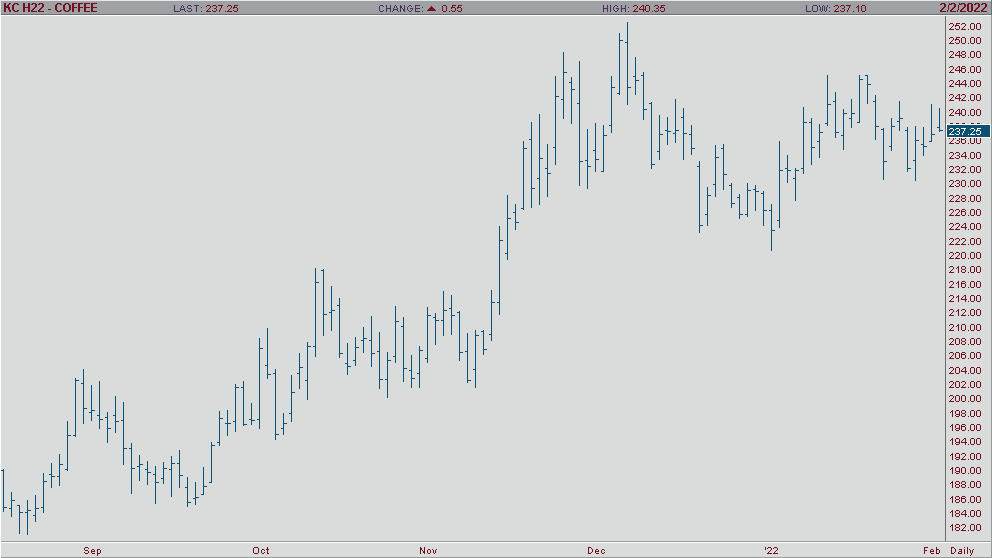
Coffee prices have seen coiling action over the past few
weeks that has kept the market well clear of its early January low. With
tightening near term supply, the trend could turn higher at any time. The
Brazilian currency extended its 2022 rally to a new 4 momth high, which
provided coffee with a carryover support as it eases pressure on Brazils
farmers to market their remaining supply. In addition, the more that 42%
drawdown in ICE exchange coffee stocks since the end of Sep. has provided
significant support to the market as that reflects tightening near term supply
in major consuming nations.
The crossover and close above the 40 day MA is an indication the longer term trend has turned to the upside. That being said, the shorter term trend on the 9 and 18 day MA has indicated a possible downtrend. Resistance comes in at 23920 and 24255, while support hits at 23420 and 23235.
Coffee Mar '22 Daily Chart If you have any questions or would like to discuss the markets further, please feel free to contact me at 800-826-2270 or tcholly@rjofutures.com. Agricultural - Bullish Canola Count Intact Above Minimum 851.5
Bullish Canola Count Intact Above Minimum 851.5
By: RJO Market InsightsPosted 10/14/2022
Posted on Oct 14, 2022, 07:42 by Dave Toth
On
the heels of mid-Sep-to-early-Oct's steeper, accelerated, 3rd-wave-looking
recovery, the past week-and-a-half's boringly lateral chop is first considered
a corrective/consolidative event that warns of a continuation of the uptrend
that preceded it to new highs above 04-Oct's 891.0 high. This count
remains consistent with our broader base/correction/recovery count introduced
in 13-Sep's Technical Blog following that
day's bullish divergence in short-term momentum above 07-Sep's 809.5 minor
corrective high detailed in the hourly chart below.
The
important takeaway from this month's lateral, sleepy price action is the
definition of Wed's 851.5 low as
the end or lower boundary of a suspected 4th-Wave correction. A failure
below 851.5 will confirm a bearish divergence in daily momentum and defer or
threaten a bullish count enough to warrant non-bullish decisions like
long-covers. A failure below 851.5 will not
necessarily negate a broader bullish count, but it will threaten it enough to
warrant defensive measures as the next pertinent technical levels below 851.5 are
13-Sep's prospective minor 1st-Wave high at 813.8 and obviously 08-Sep's 766.0
low. And making non-bullish decisions "down there" is
sub-optimal to say the least. Per such, both short- and longer-term
commercial traders are advised to pare or neutralize bullish exposure on a
failure below 851.5, acknowledging and accepting whipsaw risk- back above 04-Oct's
891.0 high- in exchange for much deeper and sub-optimal nominal risk below
766.0.
On
a broader scale, the daily log scale chart above shows the developing potential
for a bearish divergence in daily momentum that will be considered confirmed
below 851.5. This chart also shows the past month's recovery thus far
stalling in the immediate neighborhood of the (888.0) Fibonacci
minimum 38.2% retrace of Apr-Sep's entire 1128 - 766 decline). COMBINED
with a failure below 851.5, traders
would then need to be concerned with at least a larger-degree correction pf the
past month's rally and possibly a resumption of Apr-Sep's major downtrend.
Until
and unless the market fails below 851.5 however, we would
remind longer-term players of the key elements on which our bullish count is
predicated:
a confirmed bullish divergence in WEEKLY momentum
(below)
amidst
an
historically low 11% reading in out RJO Bullish Sentiment Index and
a
textbook complete and major 5-wave Elliott sequence down from 29-Apr's
1128 high to 08-Sep's 766.0 low.
Thus
far, the market is only a month into correcting a 4-MONTH, 32% drawdown, so
further and possibly protracted gains remain well within the bounds of a major
(suspected 2nd-Wave) correction of Apr-Sep's decline within an even more
massive PEAK/reversal process from 17-May's 1219 high on an active continuation
basis below.
These
issues considered, a bullish policy and exposure remain advised with a failure
below 851.5 required to defer or threaten this call enough to warrant moving to
a neutral/sideline position. In lieu of such weakness, we anticipate a
continuation of the past month's rally to new highs and potentially significant
gains above 891.0.
Agricultural - Grains - Let The Chart Do the Talking
Grains - Let The Chart Do the Talking
By: Michael Sabo, Senior Market StrategistPosted Feb 4, 2022 10:20AM CT
On January 14th I advised traders on the following: “As you can see the medium-term downside breakout level held at $5.83 ½ with lows coming in at $5.85 ¼ before seeing moves this week to a high of $6.17 ¼ which was reached today after seeing a small inside day yesterday. With the break higher today the market has triggered a short term buy (for aggressive traders) in my playbook. As I said last week, I still remain bullish and traders should watch the medium term breakout levels for market direction.” As one can see by looking at the chart below on Jan 24th March corn broke out above $6.18 ½, a level I mentioned several times in my articles. By January 31st March corn reached a contract high of $6.42 ½ which took out another key level, in my opinion, of $6.39 ½ a level I have been advising on for months. With the small pullback to current trading / consolidation levels (inside day forming so far today). If today forms an inside day I would advise traders buying on a breakout above todays high. I remain bullish for now but traders should be prepared for additional volatility at these prices especially with the recent breakout.
The “big picture” numbers remain the same and probably will for some time. I firmly believe a break below $4.96 could give the bears control of the market and a break above $6.39 ½ on the upside may have enough bulls behind it to propel corn to all-time highs. There are several minor areas of support and resistance inside this range that can help with short term market direction if violated. Call me directly at 1-800-367-7290 for more in-depth discussion on these numbers and to discuss trading strategies specific to your situation.
I would suggest using an option strategy to manage your futures position risk or an outright option strategy. Implied option volatility has come down quite a bit from its most recent highs mainly due to the consolidation and tighter trading ranges. I have 25 years of grain market experience, feel free to call or email with any questions you may have. Be sure to check out my archived weekly grain market insight articles posted on our website.
**** Request
your FREE 2022 Commodity Trading Guide Today! ****
This 55-page guide is packed with indispensable market information. It has a complete commodity calendar that lists the dates and times of Market Reports, option expiration dates, futures first notice dates, futures last trade dates, etc. It readily serves as your commodity market encyclopedia giving you an in depth look at each commodity, there is market almanac for all actively traded commodities and much more! To reserve your complimentary Commodity Trading Guide, send me an email at msabo@rjofutures.com with the following information: your full name, mailing address and a preferred phone number so we can confirm your request. Once confirmed, I will reserve your trading guide, and have it sent out as soon as we receive them.
If you have any questions or would like to discuss the markets further, please feel free to contact me at 800-367-7290 or msabo@rjofutures.com. Interest Rates - Could Fed Raise Interest Rates Today?
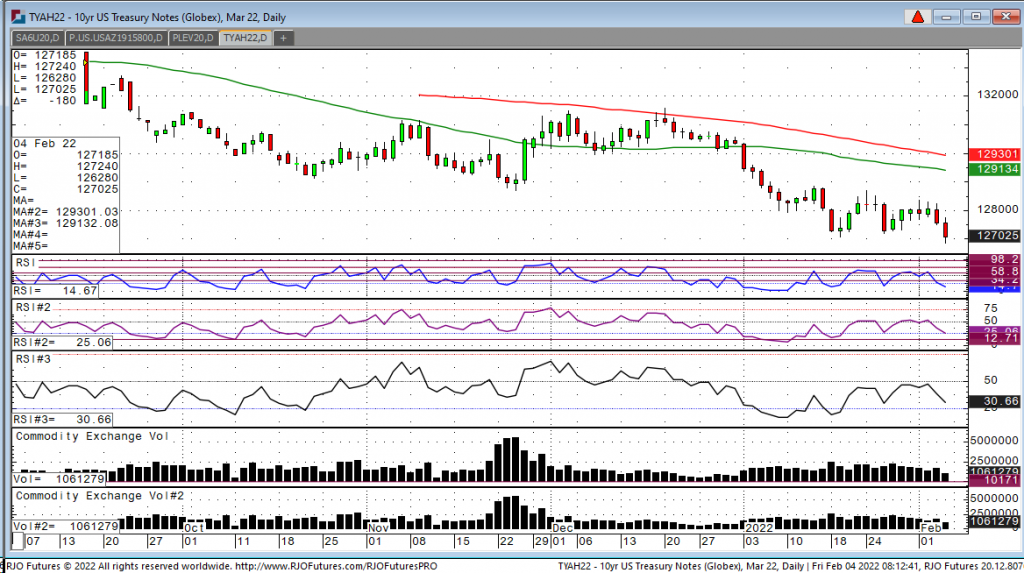
Looking at the March 10-year today, we have a high 127-24, a low of 126-30, and currently trading at 127-01. Certainly, the highlight news of the week was this morning’s non-farm payroll number that smashed expectations with a rise of 467K way more than the expected rise of 150K. But that really doesn’t tell the whole story, all week most economists had been predicting a negative print, some as low as negative 200K. On Wednesday, ADP came out negative, so most were expecting the same for today’s NFP number. Looking deeper into the number, you will notice the key, hourly earnings shot up to 5.7% blowing away expectations of a rise of 5.2% which is what the fed is looking at closely in determining if and when they will raise rates. It would not be inconceivable if the Fed comes in and does a live hike at some point today, I am certainly not saying it is going to happen. But, the price of oil is now above 90$ for the first time in seven years and even though AMZN had great earnings yesterday they came out after the bell and said they are raising the price of their exclusive “prime”, arguably the most popular expense for most people. you can bet the fed is under great pressure to raise rates immediately to put a lid on prices of goods and services.
10yr Note Mar '22 Daily Chart If you have any questions or would like to discuss the markets further, please feel free to contact me at 800-826-2270 or gperlin@rjofutures.com. Equity - Jobs Beats Number
Jobs Beats Number
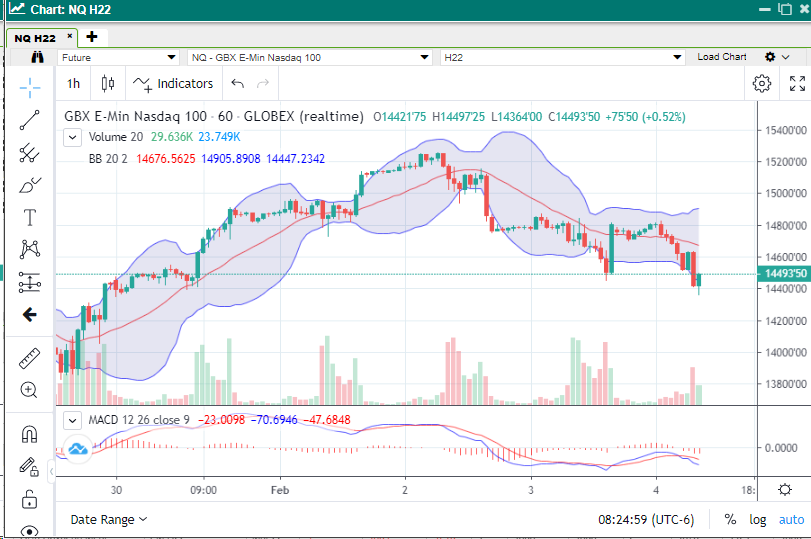
By: Bill Dixon, Senior Market StrategistPosted Feb 4, 2022 9:02AM CT
Nonfarm Payrolls added a whopping 467k (150k exp), while the prior reading of 199k was revised up to 510k. The unemployment rate ticked up a tenth to 4.0%, but we saw big increases in private payrolls (444k vs 150k exp) and average hourly earnings (0.7% vs 0.5% exp M/M and 5.7% vs 5.2 exp Y/Y). This follows what was a pretty disastrous reading from Wednesday’s ADP report in which an expected 225k came out as -301k. Despite this blowout number, stocks are selling off. Tech is leading the way down. Amazon did its best to save the market after the close yesterday, but the Nasdaq has now printed a new weekly low following the impressive jobs data. One has to think that kind of reading paves the way for the Fed to continue down the hawkish path, and the markets are reacting as if that is the case. Trader’s will now set their sites on next Thursday’s CPI reading to see if there is a chance they veer off course.
Nasdaq 60-min Chart If you have any questions or would like to discuss the markets further, please feel free to contact me at 800-669-5354 or bdixon@rjofutures.com. Economy - S-T Mo Failure Insufficient to End RBOB Correction, But Beware
S-T Mo Failure Insufficient to End RBOB Correction, But Beware
By: RJO Market InsightsPosted 11/08/2022
Posted on Nov 08, 2022, 07:51 by Dave Toth
In Fri's Technical Webcast we identified a
minor corrective low at 2.6328 from Thur as a mini risk parameter the market
needed to sustain gains above to maintain a more immediate bullish count.
The 240-min chart below shows the market's failure overnight below this level,
confirming a bearish divergence in very short-term momentum. This mo
failure defines Fri's 2.8172 high as
one of developing importance and a parameter from which very short-term traders
can objectively base non-bullish decisions like long-covers.
Given
the magnitude of the past three weeks' broader recovery however, this
short-term momentum failure is of an insufficient scale to conclude anything
more than another correction within this broader recovery from 26-Sep's 2.1877
low. Indeed, overnights failure below 2.6328 only allows us to conclude
the end of the portion of the month-and-a-half rally from 31-Oct's 2.4822 next
larger-degree corrective low. 2.4822 is the
risk parameter this market still needs to fail below to break the uptrend from
18-Oct's 2.3526 low while this 2.3526 low
remains intact as the risk parameter this market needs to fail below to break
the month-and-a-half uptrend. From an
intermediate-to-longer-term perspective, this week's setback falls well within
the bounds of another correction ahead of further gains. This is another
excellent example of the importance of technical and trading SCALE and
understanding and matching directional risk exposure to one's personal risk
profile.
The
reason overnight's admittedly minor mo failure might have longer-term
importance is the 2.8172-area from which it stemmed. In
Fri's Technical Blog we also noted the market's engagement of the
2.8076-to-2.8159-area marked by the 61.8% retrace of Jun0-Sewp's 3.2758 -2.1877
decline and the 1.000 progression of Sep-Oct's initial 2.1877 - 2.6185
(suspected a-Wave) rally from 18-Oct's 2.3526 (suspected b-Wave) low. We
remind longer-term players that because of the unique and compelling confluence
of:
early-Aug's bearish divergence in WEEKLY momentum
amidst
historically
extreme bullish sentiment/contrary opinion levels in our RJO Bullish
Sentiment Index
an
arguably complete and massive 5-wave Elliott sequence from Mar'20's 0.4605
low to Jun's 4.3260 high (as labeled in the weekly log active-continuation
chart below) and
the
5-wave impulsive sub-division of Jun-Sep's (suspected initial 1st-Wave) decline
The
recovery attempt from 26-Sep's 2.1877 low is arguably only a 3-wave (Wave-2)
corrective rebuttal to Jun-Sep's decline within a massive, multi-quarter
PEAK/reversal process. Now granted, due to the magnitude of 2020 -2022's
secular bull market, we discussed the prospect for this (2nd-Wave corrective)
recovery to be "extensive" in terms of both price and time. A
"more extensive" correction is typified by a retracement of 61.8% or
more and spanning weeks or even months following a 3-month decline. Per
such, the (suspected corrective) recovery from 26-Sep's 2.1877 low could easily
have further to go, with commensurately larger-degree weakness than that
exhibited this week (i.e., a failure below at least 2.4822) required
to consider the correction complete. Indeed, the daily log chart above
shows the market thus far respecting former 2.6185-area resistance from 10-Oct
as a new support candidate.
These
issues considered, very shorter-term traders have been advised to move to a neutral/sideline
position following overnight's momentum failure below 2.6328, with a recovery
above 2.8172 required to negate this call, reaffirm the recovery and re-expose
potentially significant gains thereafter. For intermediate- and
longer-term players, a bullish policy and exposure remain advised with a
failure below 2.4822 required to threaten this call enough to warrant
neutralizing exposure. We will be watchful for another bearish divergence
in momentum following a recovery attempt that falls short of Fri's 2.8172 high
that would be considered the next reinforcing factor to a count calling that
2.8172 high the prospective end to the month-and-a-half 2nd-Wave
correction. In lieu of such, a resumption of the current rally to
eventual new highs above 2.8172 should not surprise.